Magnetic field enabled in situ control over the structure and dynamics of colloids interacting via SALR potentials†
Hashir M.
Gauri
a,
Zachary M.
Sherman
b,
Ahmed
Al Harraq
a,
Thomas M.
Truskett
 b and
Bhuvnesh
Bharti
 *a
*a
aCain Department of Chemical Engineering, Louisiana State University, Baton Rouge, LA 70803, USA. E-mail: bbharti@lsu.edu
bMcKetta Department of Chemical Engineering, The University of Texas at Austin, Austin, TX 78712, USA
First published on 10th May 2023
Abstract
Colloidal suspensions are an ideal model for studying crystallization, nucleation, and glass transition mechanisms, due to the precise control of interparticle interactions by changing the shape, charge, or volume fraction of particles. However, these tuning parameters offer insufficient active control over interparticle interactions and reconfigurability of assembled structures. Dynamic control over the interparticle interactions can be obtained through the application of external magnetic fields that are contactless and chemically inert. In this work, we demonstrate the dual nature of magnetic nanoparticle dispersions to program interactions between suspended nonmagnetic microspheres using an external magnetic field. The nanoparticle dispersion simultaneously behaves as a continuous magnetic medium at the microscale and a discrete medium composed of individual particles at the nanoscale. This enables control over a depletion attractive potential and the introduction of a magnetic repulsive potential, allowing a reversible transition of colloidal structures within a rich phase diagram by applying an external magnetic field. Active control over competing interactions allows us to create a model system encompassing a range of states, from large fractal clusters to low-density Wigner glass states. Monitoring the dynamics of colloidal particles reveals dynamic heterogeneity and a marked slowdown associated with approaching the Wigner glass state.
1. Introduction
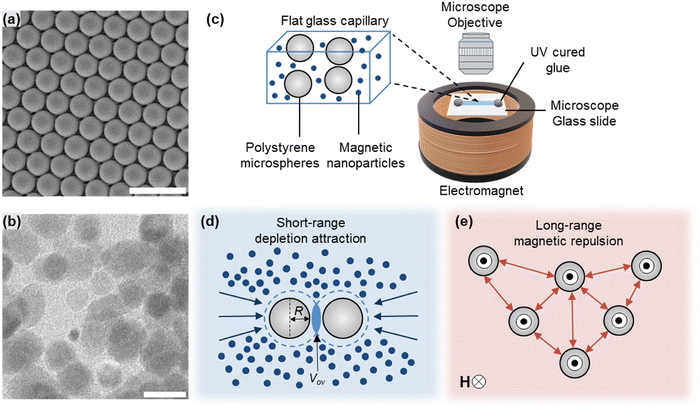
Understanding the interactions underlying the structure and dynamics of colloidal assemblies is critical for designing advanced materials such as photonic crystals,1 biosensors,2 and magnetorheological fluids.3 Colloidal particles are generalized as a model system for probing complex phenomena such as glass transitions4,5 and crystal nucleation6 due to the precise control over their shape, charge, and density. However, none of these tuning parameters affords active control over interparticle interactions using a single colloidal suspension, as each modulation typically requires preparing a new colloidal suspension. The application of external fields7 as a source of energy, e.g., electric8 and magnetic fields,9 provides the ability to tune interactions in situ for programming the structure and dynamics of an ensemble of colloids. This has garnered significant interest10 in fabricating photonic crystals11 that change colors due to variations in lattice spacing upon the application of the electric field and colloidal microbots12 driven by magnetic fields to perform tasks such as capturing and transporting cargo. Developing out-of-equilibrium structures using colloids as building blocks takes inspiration from nature, where living organisms consume biochemical energy to move and assemble, forming collective states and assemblies.13,14 The application of external fields alters the energy landscape of colloidal particles, allowing them to access metastable states in response to changes in the environment.7,13Colloidal particles interacting via short-range attractive (SA) and long-range repulsive (LR) potentials, referred to as SALR,14,15 are an emerging class of microscopic matter. Competing attractive and repulsive interactions in SALR systems have generated vast structural diversity encompassing multiple soft condensed matter states such as crystals,16,17 gel,18–20 Wigner glass,21 and microphases with exotic structures,22–25 and are also utilized in model protein interactions.26–28 Traditionally, the short-range attractive component of SALR is generated by depletion interactions via the addition of a non-adsorbing polymer. The larger colloidal particles are driven closer together by the imbalance in osmotic pressure generating attractive interactions.29 The long-range repulsion is induced by electrostatic double-layer interactions between particles and depends on the ionic strength of the dispersion medium. We recently reported30 a dynamic version of SALR (d-SALR) based on suspending nonmagnetic microparticles in an aqueous dispersion of magnetic nanoparticles (MNPs). On the one hand, the MNP dispersion promotes the assembly of colloidal microparticles into clusters due to short-range depletion attraction among the suspended nonmagnetic microspheres. On the other hand, applying an external magnetic field magnetizes the dispersion, which, due to the small size of MNPs compared to the microparticles, can be approximated as a continuous magnetic medium. The effective contrast in magnetic permeability induces a diamagnetic response from the nonmagnetic microspheres,31i.e., the microspheres acquire effective dipoles that are antiparallel to the external field. The magnetized particles experience a long-range side-to-side repulsion in response to an applied out-of-plane oriented magnetic field. The intricate balance between attraction and repulsions forms colloidal clusters of controllable size using an external magnetic field (H). The d-SALR interaction potential opens opportunities to utilize the active control over competing interactions between colloidal particles to cycle through phase transitions and explore new in- and out-of-equilibrium structures.
In this work, we investigate the occurrences and transitions between different phases achievable in a dynamic SALR system. We expand on an existing d-SALR system by enabling precise control over the competing attractive and repulsive interactions among the suspended nonmagnetic microspheres. Tuning the concentration of MNPs in the dispersion allows control over depletion-induced attraction, and modulating the strength of the external magnetic field allows dynamic control over repulsion between the suspended microspheres. The interplay and tunability of competing interactions allow us to create a model system encompassing a range of states, from large fractal clusters to a low-density Wigner glass state.13 We observe a slowdown of dynamics at the region of high H, highlighting an arrested state similar to Wigner glass18 with confined movement due to strong repulsion from neighboring particles.
2. Materials and methods
The experimental system consists of polystyrene (PS) microspheres (radius R = 1 μm, Invitrogen) functionalized with negatively charged sulfate groups for stabilization (Fig. 1a). PS microspheres are suspended in a water-based dispersion of iron oxide MNPs (radius a = 9 nm, EMG 705, Ferrotec) shown in (Fig. 1b) and size distributions available in (Fig. S1 and S2, ESI†). The effects of electrostatic repulsion between the negatively charged PS microspheres are minimized by adding 20 mM NaCl to the MNP dispersion. In a typical experiment, the volume fraction of PS microsphere is kept constant at 0.02. The concentration of MNPs (φ – vol%) in the dispersion was varied in the range of 1–2 vol%. The prepared suspension of PS microspheres and MNPs was then transferred into flat glass tubes (Vitrocom). The glass tube filled with suspension was placed on a microscope slide and sealed by placing UV curable glue at both ends of the glass tube. The sample chamber was then positioned inside an air-cooled Helmholtz coil wired to a direct current (DC) power supply (BK Precision 1665) to generate a uniform out-of-plane magnetic field. The adjustment of current through the DC power supply allowed tunability of the magnetic field strength, which was measured by a Gaussmeter (AlphaLab Inc. GM2) (Fig. S3, ESI†). The Helmholtz coil and the sample chamber were then placed on the microscope stage, and image acquisition was performed with a Leica DM6B upright microscope using a 40×/0.55 air objective and a Leica DFC9000GTC camera. The schematic of the experimental setup is shown in Fig. 1c. Our microscope setup has an estimated depth of field of ∼0.9 μm. The waiting time prior to imaging for all experiments is approximately 30 minutes, which allows the majority of the particles to settle at the bottom of the glass tube, resulting in a quasi two-dimensional system. A series of 800 images (512 × 512 pixels) covering approximately 65 μm × 65 μm area in the x–y plane and at 20 frames per second were acquired for 40 seconds. The obtained positions of particles are projected on the x–y plane, and any 3D stacking of particles leads to interparticle separation being less than the diameter of the particle. The area fraction covered by colloidal particles in an image is approximately 0.18. Mean squared displacement (MSD) measurements reveal the dynamics of the colloidal particles, which were computed using particle trajectories obtained by standard tracking algorithms19 applied on captured image sequences.3. Theory
The MNPs serve as depletants and induce an attractive force between PS microspheres due to their exclusion from the region between larger PS microspheres (Fig. 1d). The imbalance in osmotic pressure across the neighboring PS microspheres pushes the larger colloidal particles together in a short-range entropic interparticle attraction. The depletion interaction energy (Udep) is approximated using the Asakura–Oosawa potential20 | (1) |
| Udep(h) = 0 for h > 2a | (2) |
 | (3) |
 | (4) |
 | (5) |
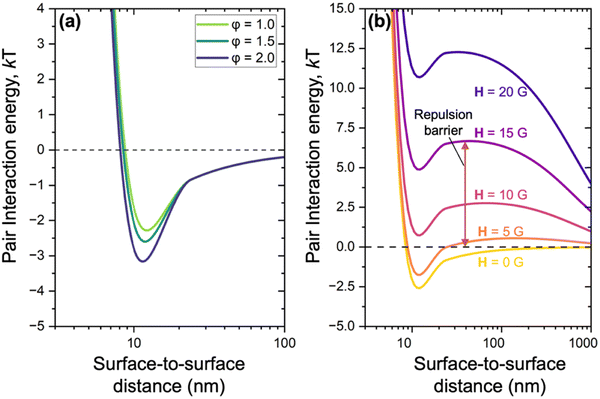
First, we note how at fixed H the strength of depletion attraction increases with φ, producing a minimum interaction energy of ∼−3.2 kT at φ = 2.0 vol% (Fig. 2a). At constant φ (here 1.5%), varying H modulates the pair interaction potential (Fig. 2b). When H = 0 G, there is an attractive well of depth ∼−2.5 kT; as we incrementally increase H, the attractive well becomes shallower, and for H larger than 5 G, a repulsive barrier of several kT appears. The particles experience side-to-side repulsion due to the parallel alignment of their acquired magnetic dipoles upon the application of an external magnetic field. Additionally, eqn (3) highlights that the magnitude of acquired magnetic dipole moment scales linearly with the strength of the external magnetic field. Therefore, increasing the strength of the magnetic field results in larger repulsive potentials.
4.1. Results and discussion
4.1. Structures formed by d-SALR
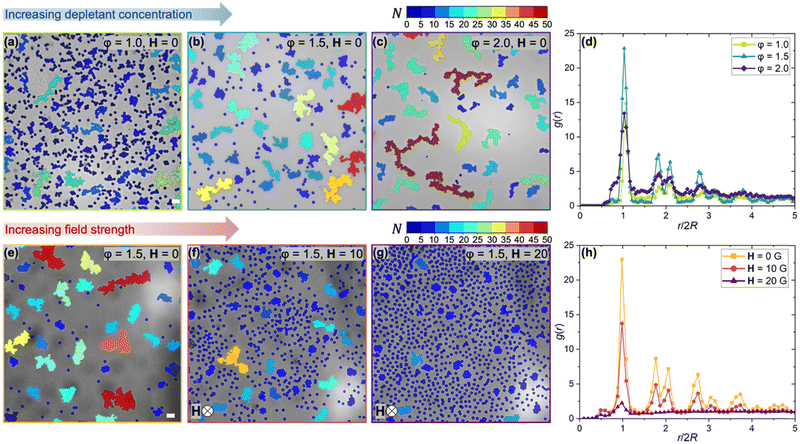
The hallmark feature of d-SALR is the in situ tunability of the repulsive interactions by controlling the strength of the applied magnetic field. Hence, a sample of fixed volume fraction of PS microspheres dispersed in MNP dispersion can exhibit different assembled states by fine-tuning the attractive and repulsive components of the SALR potential. First, we investigate the role of short-range attraction between PS microspheres by varying the concentration of MNPs (φ – vol%) in the dispersion. We examine the structure of the different states with increasing φ in the absence of an external magnetic field H, effectively only changing the attractive interactions between PS microspheres. The micrographs of the suspensions are obtained at an increasing magnitude of φ and are color labeled according to the number of particles in a cluster (N), shown in Fig. 3a–c. Initially, at φ = 1.0 vol%, a large number of small clusters and individual PS microspheres are observed as the attractive short-range forces by depletion interactions are weak compared to Brownian motion, thus limiting the size of assembled structures. Monitoring the evolution of N with increasing φ, shows an increase in the size of the assemblies formed by PS microspheres due to the stronger depletion strength.The structures formed by the PS microspheres are compared by computing the radial distribution function g(r) in a 2D plane as a function of dimensionless radial distance (r/2R) depicted in (Fig. 3d) for various φ. For φ = 1.0 vol%, a few peaks are observed at short distances r/2R < 3, indicating the presence of local ordering and formation of small assemblies. The appearance of a split in peaks at r/2R ≈ 2 is associated as a structural precursor to the freezing transition in colloidal systems.32,33 As we increase φ to 1.5 vol%, a significant increase in the intensity of peaks at contact is observed, reflecting an increment in the number of neighboring particles and the presence of larger-sized clusters. Interestingly, for φ = 2.0 vol%, the observance of a peak at r/2R < 1 indicates the formation of 3D fractal clusters (Fig. 3c). The particles assembled due to depletion interactions can reorient and rearrange their positions within a cluster. However, with increased depletion interaction strength at higher φ, the rotational reorganization of particles is limited due to the larger structure of clusters. The rate of aggregation competes with the rotational movement, leading to inhibited cluster growth laterally and attaining a 3D configuration.34 The results highlight the influence of the strength of depletion interactions displaying a crossover from the formation of many small clusters to a lower number of fractal clusters at constant PS concentration.
Next, we investigate the contribution of the repulsive interaction in our d-SALR potential, which is controlled by varying the strength of the external magnetic field H while fixing φ at 1.5 vol%. In the absence of an external magnetic field (H = 0 G), particles assemble as 2D crystals due to unhindered short-range attraction (Fig. 3e). The radial distribution function g(r) is computed for structures observed at varying magnitudes of H and shown in Fig. 3h. The presence of colloidal crystals in the absence of magnetic fields is quantified by the significant peak intensity at contact (r/2R = 1). Applying an external magnetic field with increasing magnitude induces long-range magnetic repulsion among the PS microspheres, gradually overcoming the depletion attraction and promoting the disassembly of clusters into individual particles (Fig. 3f–g). Consequently, the g(r) has a significantly smaller peak intensity at contact (Fig. 3h) for H = 10 and 20 G and quickly returns to the bulk density (g(r) = 1), indicating the disappearance of the local ordering of PS microspheres in the dispersion.
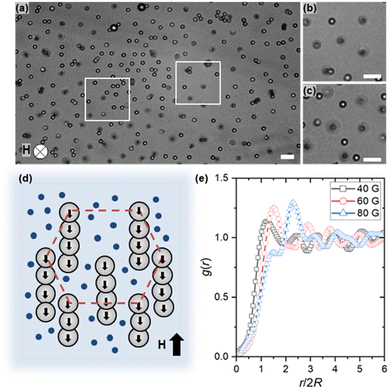
When H > 20 G, the observed configuration is comparable to a low-density arrested Wigner glass state,21,35,36 where interparticle spacing is larger than their diameter (Fig. 4a). Previously,37 a Wigner glass state was attained using low colloidal particle concentration, which was stabilized by long-range electrostatic interactions. In contrast, we here observe the Wigner glass state after tuning long-range magnetic repulsion in situ. To analyze the Wigner glass structure for varying H, we extract the average immediate neighbor interparticle spacing ((r/2R)*) from g(r) in the 2D plane (Fig. 4e). For H = 40 G, we observe the first peak at (r/2R)* ∼ 1.2, indicating a low-density state with interparticle spacing slightly larger than the diameter of the PS microsphere due to the magnetic field-induced lateral repulsion. Upon increasing the magnitude of H further, the first peak shift towards higher values of (r/2R)* ∼ 1.5 at 60 G and ∼2.5 at 80 G is a direct consequence of stronger long-range magnetic repulsion between PS microspheres and interparticle spacing. Note that at H ≥ 60 G, the PS microspheres assemble into out-of-plane chains due to strong dipolar attraction between the microspheres in the direction of the applied field, i.e., out of the viewing plane (Fig. 4b–d and Movie S1, ESI†). The in-plane magnetic repulsion combined with out-of-plane magnetic attraction leads to formation of the Wigner glass state, where linear chains instead of individual particles occupy the ordered sites.
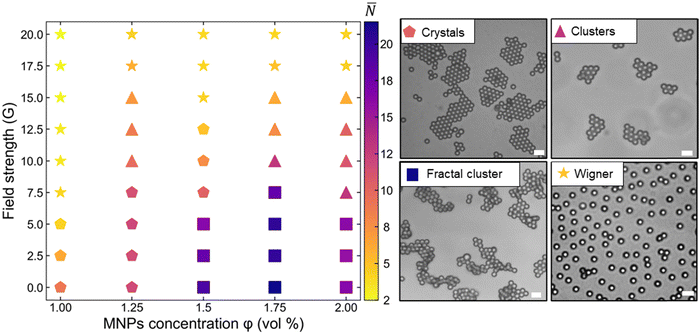
The phase diagram summarizing the assembly of PS microspheres via competing d-SALR interactions is shown in Fig. 5, along with images of the representative structures. In the studied (φ, H) region, we identified four distinct structures based on the average number of particles in structures (![[N with combining macron]](https://www.rsc.org/images/entities/i_char_004e_0304.gif) ): Wigner glass, 2D crystals, 2D clusters, and fractal clusters. At φ = 1 vol%, we observe colloidal crystals for H ≤ 5 G, as the depletion attraction is comparatively stronger than magnetic repulsion. For H > 5 G, the ordered crystals dissemble into individual disconnected particles resembling Wigner glassy state reported in simulations38,39 and experimental studies21 of highly repulsive colloids. As we move towards regions of high φ = 1.5–2.0 vol%, the increasing depletion strength favors the formation of fractal clusters with
): Wigner glass, 2D crystals, 2D clusters, and fractal clusters. At φ = 1 vol%, we observe colloidal crystals for H ≤ 5 G, as the depletion attraction is comparatively stronger than magnetic repulsion. For H > 5 G, the ordered crystals dissemble into individual disconnected particles resembling Wigner glassy state reported in simulations38,39 and experimental studies21 of highly repulsive colloids. As we move towards regions of high φ = 1.5–2.0 vol%, the increasing depletion strength favors the formation of fractal clusters with ![[N with combining macron]](https://www.rsc.org/images/entities/i_char_004e_0304.gif) > 18 for H < 10 G. The increase in the magnitude of φ highlights the threshold values for H necessary to disassemble clusters increases. As colloidal crystals formed at φ = 1 vol% start disassembling at H = 5 G, whereas clusters at φ = 1.75 vol% disassemble only after H > 10 G, the d-SALR system allows us to tune the delicate balance of competing interactions to achieve quasi-balanced regions in the phase diagram where neither attraction nor repulsion dominates. In these narrow regions for H = 10–15 G and φ = 1.25–2.0 vol%, we observed 2D finite-sized clusters with
> 18 for H < 10 G. The increase in the magnitude of φ highlights the threshold values for H necessary to disassemble clusters increases. As colloidal crystals formed at φ = 1 vol% start disassembling at H = 5 G, whereas clusters at φ = 1.75 vol% disassemble only after H > 10 G, the d-SALR system allows us to tune the delicate balance of competing interactions to achieve quasi-balanced regions in the phase diagram where neither attraction nor repulsion dominates. In these narrow regions for H = 10–15 G and φ = 1.25–2.0 vol%, we observed 2D finite-sized clusters with ![[N with combining macron]](https://www.rsc.org/images/entities/i_char_004e_0304.gif) > 12. For field strength H = 15 G or higher for all the studied values of φ, low-density Wigner glass structures are observed.
> 12. For field strength H = 15 G or higher for all the studied values of φ, low-density Wigner glass structures are observed.
4.2. Dynamics of structures
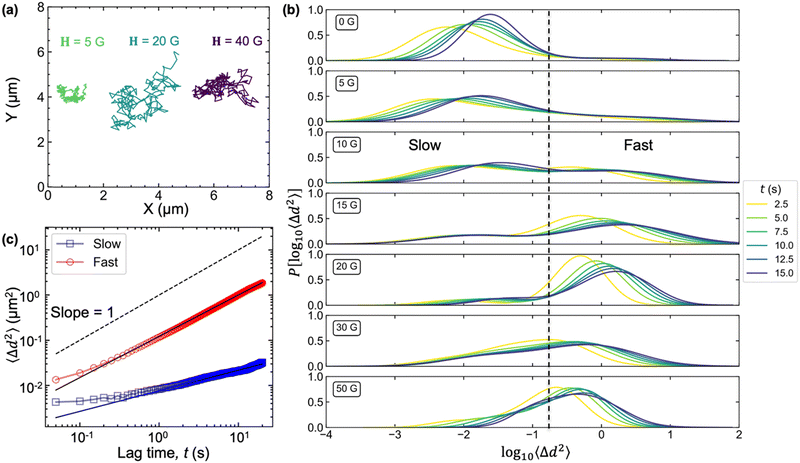
We identify the existence of arrested states by monitoring the dynamics of PS microspheres interacting via d-SALR. To visualize the dynamic arrest of microspheres, we track the motion of individual particles upon increasing H while keeping φ constant at 1.5 vol% (Fig. 6a). At H = 5 G, depletion induced attraction dominates and the majority of particles exist in a clustered state, thus the PS microspheres exhibit restricted motion due to the presence of neighboring particles within a cluster. Upon increasing H to 20 G, long-range magnetic repulsion mobilizes the PS microspheres against their static clustered state (supplementary movie 2). At H = 40 G, the strong lateral magnetic repulsion limits the particle motion, visualized by the confined trajectory obtained, and confirms the onset of dynamic arrest.To investigate the slowing down of dynamics observable at higher H, we characterize the dynamic heterogeneities by analyzing the probability distributions of the logarithm of MSD (P[1og10〈Δd2〉]) as a function of lag time for PS microspheres at varying H and constant φ = 1.5% (Fig. 6b). The lag time, t is defined as the time interval between the positions of a particle of interest. The experiments are conducted through a step-wise process where the magnetic field is altered and then the system is allowed to equilibrate for 30 minutes before monitoring the dynamics of particles. A homogeneous fluid would display a unimodal distribution for P[1og10〈Δd2〉] with its width dependent on t and diffusion coefficient (D).40 In the absence of H, the PS microspheres are assembled in clusters via depletion attraction and P[1og10〈Δd2〉] has a single peak skewed towards smaller displacements. As we increase H to 10 G, the P[1og10〈Δd2〉] exhibits a bimodal distribution with a second peak appearing at larger displacements, which indicates distinct subpopulations of ‘slow’ and ‘fast’ PS microspheres. To distinguish between the slow and fast populations of particles, we determined the local minimum of the probability distributions of the logarithm of the mean squared displacement P[1og10〈Δd2〉] for systems exhibiting a bimodal distribution41i.e.H = 10 G. We use this value to distinguish the subpopulations of particles where bimodal distributions are not present such as H = 0 G. To ensure consistency, the differentiation between subpopulations is performed uniformly at t = 10 seconds for all magnetic field strengths. The appearance of the second peak at H = 10 G is due to long-range magnetic dipolar repulsion induced by the external magnetic field as it starts to overcome attractive forces leading to dissembling clusters and separated mobilized particles. At an intermediate magnitude of (H= 20 G), we observed a more pronounced peak of P[1og10〈Δd2〉] at higher displacements, indicating complete disassembly of clusters and most particles moving freely within the system and achieving larger displacements. However, at H= 30 and 50 G, the P[1og10〈Δd2〉] curve starts to shift back towards the smaller displacements, and we observe a slowing down of the dynamics. The initial increase and then steady decline towards smaller displacements in the obtained P[1og10〈Δd2〉] distribution curves quantitively verify the dynamic arrest approaching and supported by the confined trajectories obtained for PS microspheres at high H (Fig. 6a).
To further investigate the dynamics of the ‘slow’ and ‘fast’ moving particles, we plot the mean squared displacement 〈Δd2〉 for the individual particle of the two categories at H = 10 G in (Fig. 6c). The obtained MSD curves are fitted to a power law, 〈Δd2〉 = 4Dtγ, where γ is the anomalous diffusion exponent. The anomalous diffusion exponent allows us to determine diffusive regimes for the particles observed; γ = 1 indicates purely diffusive behavior, while γ > 1 and γ < 1 represent super-diffusive and sub-diffusive regimes, respectively. For fast-moving particles, the value of γ is 0.91, which indicates a near-diffusive motion whereas for slow-moving particles primarily bounded in clusters due to attractive depletion forces, the value of γ is 0.46 suggesting a sub-diffusive behavior.
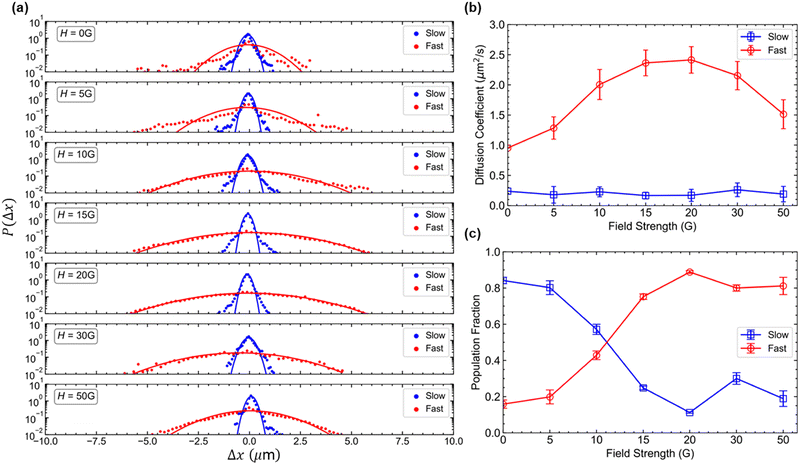
To distinguish between the subpopulation of particles, we start by examining the distribution of displacements for particles at specified lag time t, also known as the van Hove correlation function P(Δx,t). The ensemble-averaged van Hove correlation function for increasing magnitude of H at lag time t = 2.5 s is plotted in Fig. 7a. The variance of the Gaussian fitting for distributions in the van Hove correlation function provides the estimated diffusion coefficients (D) using the approximation of particle movement by a simple random walk:42
 | (6) |
At H = 0 G, the Gaussian fitting for the ensemble-averaged van Hove correlation for both the slow and fast population of particles exhibits narrower distribution relative to larger magnetic field strengths. Upon increasing H to 20 G, the microspheres display markedly different distributions especially for population of fast-moving particles, as the widths of distribution increase indicating the occurrence of noticeable dynamic heterogeneity. These increased widths of van Hove distributions reflect higher diffusion coefficients as the PS microspheres disassemble from the clustered states to individual particles upon increasing H. For the higher magnitudes of H > 30 G, the width of the Gaussian distribution for fast-moving particles starts to become narrower instead, indicating that particles are moving with reduced mobility. The strong repulsions form the Wigner glass state, where individual PS microspheres are collectively arrested.
The extracted diffusion coefficients from Gaussian fittings of the van Hove correlation function are shown in (Fig. 7b). For the slow-moving PS microspheres, D remains constant throughout the applied magnitude of H, as particles remain bound within the clusters and primarily immobilized. However, for the fast-moving particles, the D shows an increase with increasing field strength and peaks at H = 20 G, followed by a decline as reflected in a broad tail distribution. The initial increase in D can be explained by the magnetic repulsions among colloidal particles overcoming the depletion-induced attractive forces, disassembling finite 2D clusters into disconnected individual particles which can translate freely within the sample. The subsequent decline in D for H > 20 G is attributed to the presence of sufficiently strong magnetic repulsion among colloidal particles leading to the confined movement of the particles.
To analyze how the subpopulations of fast and slow-moving particles vary quantitatively as a function of H, we plot the proportions of particles classified under each category (Fig. 7c). At low H < 5 G, the d-SALR system is composed of many slow-moving particles in comparison to fast-moving. This is suggestive that magnetic field-induced repulsion among PS microspheres is insufficient to overcome the attractive depletion interactions and remain within assembled clusters. At an intermediate magnitude of H = 10–20 G, we observe a decline in slow-moving and an increment in fast-moving particle populations, highlighting particle disassembly and free movement due to increasing magnetic repulsion. Interestingly, for higher values of H = 30 G, we observe a slight decrease in the fast-moving particle subpopulation as particles have restricted mobility due to long-range magnetic repulsions and a subsequent increase in the slow-moving particle subpopulation. These results highlight the ability of colloids interacting via d-SALR to crossover between homogenous and heterogenous dynamic regimes by controlling the balance of attractive and repulsive forces using an external magnetic field.
5. Conclusions
We introduced an experimental model system that allows for dynamic tuning of competing short-range attractive and long-range repulsive (SALR) interactions among nonmagnetic PS microspheres suspended in a magnetic nanoparticle (MNP) dispersion. The concentration of MNPs (φ) in the colloidal dispersion controls the short-range depletion attraction, and the magnitude of the applied external magnetic field (H) tunes the long-range magnetic repulsion. The in situ tunability of the competing interactions allows us to switch between crystal, 2D cluster, and 3D fractal states. In regions of high H, the induced long-range magnetic dipole–dipole repulsions can completely overcome the attractive short-range forces and lead to the formation of low-density Wigner glass states.21 Monitoring the colloidal dynamics, a crossover between a diffusive and sub-diffusive regime and slowing down dynamics emerges as the Wigner glassy state approaches for regions of high H. The proposed experimental system opens new avenues to correlate microscopic clustering in liquid states to macroscopic structures.43,44 This includes the effects of dynamic variations in the clustering of proteins which are also known to interact via SALR potentials.26,45,46Conflicts of interest
There are no conflicts to declare.Acknowledgements
H. M. G., A. A. H. and B. B. acknowledge the financial support from the National Science Foundation (NSF) under Grants CBET–1943986 (NSF-CAREER) and CBET–2038305. T. M. T. acknowledges support from the Welch Foundation (Grant No. F-1696).References
- W. Cheng, J. Wang, U. Jonas, G. Fytas and N. Stefanou, Nat. Mater., 2006, 5, 830–836 CrossRef CAS PubMed
.
- O. D. Velev and E. W. Kaler, Langmuir, 1999, 15, 3693–3698 CrossRef CAS
.
- J. de Vicente, D. J. Klingenberg and R. Hidalgo-Alvarez, Soft Matter, 2011, 7, 3701–3710 RSC
.
- G. L. Hunter and E. R. Weeks, Rep. Prog. Phys., 2012, 75, 66501 CrossRef
.
- E. R. Weeks, ACS Macro Lett., 2017, 6, 27–34 CrossRef CAS PubMed
.
- S. Auer and D. Frenkel, Nature, 2001, 409, 1020–1023 CrossRef CAS PubMed
.
- A. Al Harraq, B. D. Choudhury and B. Bharti, Langmuir, 2022, 38, 3001–3016 CrossRef
.
- B. Bharti, G. H. Findenegg and O. D. Velev, Langmuir, 2014, 30, 6577–6587 CrossRef CAS PubMed
.
- A. A. Harraq, J. G. Lee and B. Bharti, Sci. Adv., 2020, 6, 5337–5345 CrossRef
.
- B. A. Grzybowski, K. Fitzner, J. Paczesny and S. Granick, Chem. Soc. Rev., 2017, 46, 5647–5678 RSC
.
- B. Liu, T. H. Besseling, M. Hermes, A. F. Demirörs, A. Imhof and A. van Blaaderen, Nat. Commun., 2014, 5, 3092 CrossRef
.
- K. Han, C. W. Shields IV, N. M. Diwakar, B. Bharti, G. P. López and O. D. Velev, Sci. Adv., 2017, 3, e1701108 CrossRef PubMed
.
- A. Al Harraq, M. Bello and B. Bharti, Curr. Opin. Colloid Interface Sci., 2022, 101612 CrossRef CAS
.
- J. Ruiz-Franco and E. Zaccarelli, Annu. Rev. Condens. Matter Phys., 2021, 12, 51–70 CrossRef CAS
.
- Y. Liu and Y. Xi, Curr. Opin. Colloid Interface Sci., 2019, 39, 123–136 CrossRef CAS PubMed
.
- Q. Chen, S. C. Bae and S. Granick, Nature, 2011, 469, 381–384 CrossRef CAS PubMed
.
- M. E. Leunissen, C. G. Christova, A. P. Hynninen, C. P. Royall, A. I. Campbell, A. Imhof, M. Dijkstra, R. van Roij and A. van Blaaderen, Nature, 2005, 437, 235–240 CrossRef CAS PubMed
.
- P. J. Lu, E. Zaccarelli, F. Ciulla, A. B. Schofield, F. Sciortino and D. A. Weitz, Nature, 2008, 453, 499–503 CrossRef CAS PubMed
.
- K. N. Pham, A. M. Puertas, J. Bergenholtz, S. U. Egelhaaf, A. Moussaïd, P. N. Pusey, A. B. Schofield, M. E. Cates, H. Fuchs and W. C. K. Poon, Science, 2002, 296, 104–106 CrossRef CAS PubMed
.
- A. I. Campbell, V. J. Anderson, J. S. van Duijneveldt and P. Bartlett, Phys. Rev. Lett., 2005, 94, 208301 CrossRef PubMed
.
- C. L. Klix, C. P. Royall and H. Tanaka, Phys. Rev. Lett., 2010, 104, 165702 CrossRef
.
- B. A. Lindquist, R. B. Jadrich and T. M. Truskett, Soft Matter, 2016, 12, 2663–2667 RSC
.
- B. A. Lindquist, S. Dutta, R. B. Jadrich, D. J. Milliron and T. M. Truskett, Soft Matter, 2017, 13, 1335–1343 RSC
.
- Y. Zhuang and P. Charbonneau, J. Phys. Chem. B, 2016, 120, 7775–7782 CrossRef CAS PubMed
.
- A. Ciach, J. Pękalski and W. T. Góźdź, Soft Matter, 2013, 9, 6301–6308 RSC
.
- A. Stradner, H. Sedgwick, F. Cardinaux, W. C. K. Poon, S. U. Egelhaaf and P. Schurtenberger, Nature, 2004, 432, 492–495 CrossRef CAS PubMed
.
- B. Lonetti, E. Fratini, S. H. Chen and P. Baglioni, Phys. Chem. Chem. Phys., 2004, 6, 1388–1395 RSC
.
- A. Stradner and P. Schurtenberger, Soft Matter, 2020, 16, 307–323 RSC
.
-
H. N. W. Lekkerkerker and R. Tuinier, Colloids and the depletion interaction, Springer, 2011, pp. 57–108 Search PubMed
.
- A. A. Harraq, A. A. Hymel, E. Lin, T. M. Truskett and B. Bharti, Commun. Chem., 2022, 5, 1–9 CrossRef
.
- A. T. Skjeltorp, Phys. Rev. Lett., 1983, 51, 2306 CrossRef CAS
.
- T. M. Truskett, S. Torquato, S. Sastry, P. G. Debenedetti and F. H. Stillinger, Phys. Rev. E: Stat. Phys., Plasmas, Fluids, Relat. Interdiscip. Top., 1998, 58, 3083 CrossRef CAS
.
- K. Zhang, H. Li, L. Li and X. F. Bian, Appl. Phys. Lett., 2013, 102, 71907 CrossRef
.
- A. D. Dinsmore and D. A. Weitz, J. Phys.: Condens. Matter, 2002, 14, 7581 CrossRef CAS
.
- F. Sciortino, S. Mossa, E. Zaccarelli and P. Tartaglia, Phys. Rev. Lett., 2004, 93, 55701 CrossRef PubMed
.
- J. C. F. Toledano, F. Sciortino and E. Zaccarelli, Soft Matter, 2009, 5, 2390–2398 RSC
.
- D. Bonn, H. Tanaka, G. Wegdam, H. Kellay and J. Meunier, Europhys. Lett., 1999, 45, 52 CrossRef CAS
.
- J. C. F. Toledano, F. Sciortino and E. Zaccarelli, Soft Matter, 2009, 5, 2390–2398 RSC
.
- E. Zaccarelli, S. Andreev, F. Sciortino and D. R. Reichman, Phys. Rev. Lett., 2008, 100, 195701 CrossRef
.
- W. P. Krekelberg, V. Ganesan and T. M. Truskett, J. Chem. Phys., 2010, 132, 184503 CrossRef
.
- A. M. Puertas, M. Fuchs and M. E. Cates, J. Chem. Phys., 2004, 121, 2813–2822 CrossRef CAS
.
- M. T. Valentine, P. D. Kaplan, D. Thota, J. C. Crocker, T. Gisler, R. K. Prud’homme, M. Beck and D. A. Weitz, Phys. Rev. E: Stat., Nonlinear, Soft Matter Phys., 2001, 64, 061506 CrossRef CAS PubMed
.
- P. D. Godfrin, N. E. Valadez-Pérez, R. Castaneda-Priego, N. J. Wagner and Y. Liu, Soft Matter, 2014, 10, 5061–5071 RSC
.
- R. B. Jadrich, J. A. Bollinger, K. P. Johnston and T. M. Truskett, Phys. Rev. E: Stat., Nonlinear, Soft Matter Phys., 2015, 91, 042312 CrossRef PubMed
.
- L. Porcar, P. Falus, W.-R. Chen, A. Faraone, E. Fratini, K. Hong, P. Baglioni and Y. Liu, J. Phys. Chem. Lett., 2010, 1, 126–129 CrossRef CAS
.
- S. S. Virk and P. T. Underhill, Mol. Pharmacol., 2022, 19, 4233–4240 CrossRef CAS
.
Footnote |
| † Electronic supplementary information (ESI) available. See DOI: https://doi.org/10.1039/d3sm00354j |
| This journal is © The Royal Society of Chemistry 2023 |

