Degradation of herbicide atrazine in water by high voltage electrical discharge in comparison with Fenton oxidation and ultrasound treatments
Received
28th March 2023
, Accepted 11th July 2023
First published on 25th July 2023
Abstract
Atrazine, the most commonly used herbicide, has been reported to pollute the water environment and do harm to human health. It is thus urgent to find an efficient way to degrade atrazine. Although various advanced oxidation processes including high voltage electrical discharge (HVED) have been applied to degrade atrazine, the formation kinetics of its metabolites are still incomplete, and the detoxification of the degradation process remains to be clarified. Here, the degradation of atrazine by HVED was investigated, in comparison with traditional Fenton oxidation and ultrasound treatment. Nineteen metabolites of atrazine degradation were identified and quantified by high performance liquid chromatography coupled with high resolution mass spectrometry (HPLC-HRMS) techniques. Results show that HVED is more advantageous because of its high degradation rate for atrazine (89%), short processing time (1000 s, corresponding to 10 ms effective time), and the presence of the less toxic main metabolite hydroxyatrazine. Hydroxyl radicals (˙OH) play an important role in atrazine degradation. Adding ferrous ions (Fe2+) during HVED and ultrasound processes is beneficial for the degradation of atrazine, because of the ˙OH radicals released from hydrogen peroxide (H2O2). Based on the formation kinetics of atrazine degradation metabolites, detailed mechanisms of atrazine degradation pathways were proposed.
Sustainability spotlight
The growing harvests have been increased by using pesticides extensively in response to the global food crisis. The health effects of excessive pesticide residues in drinking water may be severe. The widely used herbicide atrazine and its metabolites can remain in the environment for decades due to their stability and refractory degradation, becoming a major source of pollution. There is thus a strong need to efficiently degrade these persistent organic pollutants. Herein high voltage electrical discharges were applied to achieve rapid and deep degradation of recalcitrant pesticides. At the same time, we supplemented the data of pesticide degradation metabolites. Our work aligns with UN SDG 6 (water and sanitation) and SDG 12 (chemicals and waste management).
|
Introduction
As the production of agriculture has developed, pesticides have become increasingly important for controlling pests and weeds. However, the overuse of pesticides has been a source of concern for environmental pollution issues1 and inherent impacts on human health.2 Among these pesticides, atrazine is the most commonly used chlorotriazine herbicide to control weeds.3 Atrazine's low biodegradability and high soil mobility make it persistent in non-agricultural soils,4 as well as ground and surface water.5 Atrazine was reported to be an endocrine disrupting chemical (EDC) posing a threat to the reproductive system of mammals,6 amphibians,7 and fishes.8 Although the European Union announced a ban on atrazine in 2003,9 it is still extensively used in the United States,10 Brazil,11 and other countries.12 The degradation of residual atrazine is thus becoming an urgent issue for environmental protection, especially for water security which is listed as a priority by the “European Green Deal” proposed by the European Commission. The degradation of chemically stable atrazine is challenging, and common water treatment technologies are limited by trace organic concentrations13 and strict fouling control,14 so there have been increasing efforts to develop efficient advanced oxidation processes,3 such as Fenton/Fenton-like oxidation,15–17 ultrasound18–20 and so on. Among them, high voltage electrical discharge (HVED) has attracted more attention because of its advantages, high degradation efficiency and environmental friendliness.
During the HVED process, the electrical discharge plasma (a partially or fully ionized gas consisting of electrons, free radicals, ions and neutrals) is generated in a high voltage reactor.21 This process is simultaneously affected by physical and chemical effects, generating various oxidizing species. The generated oxidizing species, such as hydroxy radicals (˙OH), greatly promote the degradation of pollutants. Previous studies22,23 demonstrated the viability of plasma for waste water treatment. To date, the application of HVED technology for atrazine degradation is still under development. Based on the plasma-phase distribution, the existing examples of atrazine degradation by HVED can be divided into two cases: one is direct discharge in water (electrohydraulic discharge),24,25 and the other is discharge in the gas phase.26–32 However, these reported works on the formation kinetics of atrazine degradation metabolites are incomplete.
Here, the energy was directly injected into the atrazine aqueous solution through a plasma channel formed by HVED between two submersed electrodes. It was aimed at investigating the ability of the HVED system to degrade atrazine in aqueous solution; comparing the results with a chemical degradation technique (Fenton oxidation) and physical degradation technique (ultrasound); studying the effect of Fe2+ on atrazine degradation; identifying atrazine degradation metabolites by high performance liquid chromatography coupled with high resolution mass spectrometry (HPLC-HRMS) analysis;33 and proposing detailed mechanisms of atrazine degradation pathways based on the formation kinetics of atrazine degradation metabolites.
Experimental
Materials
LC-MS grade solvents and formic acid were bought from Biosolve Chimie (Dieuze, France). Atrazine and the internal standard Atrazine-D5 were bought from Sigma-Aldrich (St. Quentin Fallavier, France). In the preparation of the buffer solution, Milli-Q water purified with a Milli-Q system from Millipore (Millsheim, France) was used. Iron(II) sulfate heptahydrate (FeSO4·7H2O) was purchased from Acros Organics with a purity of 99.5%. Hydrogen peroxide (H2O2) was purchased from Alfa Aesar with a purity of 35%.
Methods
Fig. 1 shows the experimental setup. The initial atrazine aqueous solutions of 20 mg L−1 were treated by three degradation methods including HVED, ultrasound and Fenton oxidation. After degradation, the treated fluid containing a mixture of atrazine and its metabolites was analyzed by HPLC-HRMS. Qualitative and quantitative analyses were conducted using Agilent MassHunter Workstation software (version B.07.00, Agilent Technologies, Santa Clara, CA 95051, United States).
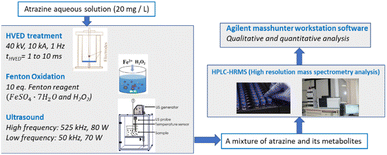 |
| | Fig. 1 Schema of the experimental procedures. | |
HVED treatment
Fig. 2 shows the schematic of the treatment chamber and pulse protocols for HVED. The high voltage electrical discharges were applied in a treatment chamber with a capacity of 1 L, using an electrical generator (Basis, Saint-Quentin, France) supplying a voltage of 40 kV, a current of 10 kA, and a frequency of 1 Hz. The generated pulses have a duration of approximately 10 μs. The average energy of an electric pulse supplied by the generator is W1 Pulse = 200 J per pulse. The atrazine solution was introduced between two stainless steel electrodes. The first point electrode is connected to the generator; the second, a plane electrode, is connected to the ground. The electrical treatment consisted in applying n pulses (or n electrical discharges) in liquid. The total processing time was 1000 s (the total effective time was 10 ms).
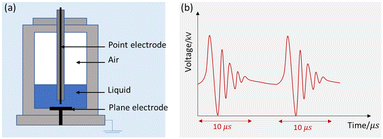 |
| | Fig. 2 Schematic representation of HVED: (a) treatment chamber and (b) pulsed protocols. | |
A volume (250 or 500 mL) of the initial atrazine aqueous solution (20 mg L−1, 0.093 mmol L−1) was added in the treatment chamber, which was then treated by HVED. The initial concentration of ferrous sulfate FeSO4·7H2O was 0.93 mmol L−1 in HVED experiments adding Fe2+. In addition, to study the effect of dissolved oxygen in the discharge system, the degradation of atrazine under an argon atmosphere was studied. A volume (500 mL) of the initial atrazine aqueous solution (20 mg L−1, 0.093 mmol L−1) was degassed and poured into the treatment chamber filled with an argon atmosphere, which was then treated by HVED. Samples were taken at 0, 100, 200, 400, 700 and 1000 s, and the corresponding effective time was 0, 1, 2, 4, 7, and 10 ms. With a frequency of 1 Hz, the corresponding number of pulses was 0, 100, 200, 400, 700 and 1000. The specific energy consumption of HVED, WHVED (J L−1), was calculated as follows:
| | | WHVED = (W1 Pulse × n)/V | (1) |
where
W1 Pulse is the average energy of one pulse (J per pulse);
n is the number of pulses; and
V is the treated volume (L).
Ultrasound treatment
For high frequency ultrasound, the atrazine solution (50 mL, 20 mg L−1, 0.093 mmol L−1) was poured into a 250 mL cup-shaped horn-type ultrasonic reactor purchased from SinapTec (Lezennes, France), and passed through a constant frequency of 525 kHz with 80 W power. The air flow was passed through the interlayer of the inner and outer walls to stabilize the temperature at 50 °C.
For low frequency ultrasound, an ultrasonic processor (Vibra-Cell 72434, Fisher Scientific, Illkirch, France) at 50 kHz frequency with 70 W power was applied. The atrazine solution (50 mL, 20 mg L−1, 0.093 mmol L−1) was poured into a 100 mL flat-bottom flask. The probe tip was placed at the center of the liquid. Temperature was kept at 50 °C using a water bath. The total treatment time was 8 h. Sampling was done at 0, 1, 2, 4 and 8 h. The initial concentration of ferrous sulfate FeSO4·7H2O was 0.93 mmol L−1 in ultrasound experiments adding Fe2+. The specific energy consumption of ultrasound, WUS (J L−1), was calculated as follows:
where
PUS is the power (
W);
t is the treatment time (s); and
V is the treatment volume of the liquid (L).
Fenton oxidation treatment
Three initial atrazine solutions (50 mL, 20 mg L−1, 0.093 mmol L−1) were poured into three 100 mL flat-bottom flasks with magnets, and 10 eq., 5 eq. and 2 eq. of Fenton reagents (the ratio of the initial FeSO4·7H2O or H2O2 molar concentration to initial atrazine molar concentration was 10, 5 and 2, where [FeSO4·7H2O]0 = [H2O2]0 = 0.93 mmol L−1, 0.465 mmol L−1 and 0.186 mmol L−1) were added, respectively. The reaction lasted for 8 h. Sampling was done at 0, 1, 2, 4 and 8 h.
Analysis by HPLC-HRMS
Atrazine and its metabolites were detected and quantified by HPLC-HRMS. A diode array detector (DAD) type HPLC system (Infinity 1290, Agilent Technologies, France) was connected with a micro-hybrid quadrupole time of flight (Q-TOF) and electrospray ionization (ESI) type mass spectrometer (Agilent 6538, Agilent Technologies, France). HLPC analyses were performed using a Thermo Hypersil Gold C18 (USP L1) column (100 × 2.1 mm, 1.9 μm, 175 A) at 40 °C. Eluents A and B consisted of 0.1% (v/v) formic acid in deionized water and 100% acetonitrile, respectively. The elution profile was 0–0.3 min 5% B, 0.3–1.7 min 5–30% B (linear gradient), 1.7–3.5 min 95% B (linear gradient), 3.5–4 min 95% B. The flow rate was 0.600 mL min−1. The responses of compounds were measured in positive ESI mode with external calibration. By using the electrospray scan mode with a frequency of 5 Hz in the mass range of 50 to 1200 m/z and an electrospray voltage of 3800 V and fragment voltage of 110 V, positive ion electrospray mass spectra were obtained. The atomizing nitrogen temperature was 350 °C, the pressure was 30 psi, and the flow rate was 10 L min−1.
Results and discussion
Atrazine and its detected metabolites
The abbreviations of atrazine and its detected metabolites are shown in Table 1.
Table 1 Atrazine and its detected metabolites
| Abbreviation |
Structure |
Formula |
Name |
m/z |
Retention time (min) |
Detected process |
| ATZ |

|
C8H14ClN5 |
Atrazine |
216.1010 |
2.558 |
All treatments (HFUS, LFUS, Fenton, HVED) |
| DEA |

|
C6H10ClN5 |
Deethylatrazine |
188.0698 |
1.910 |
| DIA |

|
C5H8ClN5 |
Deisopropylatrazine |
174.0541 |
1.620 |
| CVIT |

|
C8H12ClN5 |
6-Chloro-N2-ethenyl-N4-(propan-2-yl)-1,3,5-triazine-2,4-diamine |
214.0854 |
2.070 |
| CDIT |

|
C8H12ClN5O |
N-[4-Chloro-6-(isopropylamino)-1,3,5-triazin-2-yl]acetamide |
230.0804 |
2.091 |
| ODIT |

|
C8H13N5O2 |
N-[4-Hydroxy-6-(isopropylamino)-1,3,5-triazin-2-yl]acetamide |
212.1142 |
1.213 |
| CDET |

|
C7H10ClN5O |
N-[4-Chloro-6-(ethylamino)-1,3,5-triazin-2-yl]acetamide |
216.0647 |
1.820 |
| ODET |

|
C7H11N5O2 |
N-[6-(Ethylamino)-4-oxo-1,4-dihydro-1,3,5-triazin-2-yl]acetamide |
198.0986 |
1.082 |
| HA |

|
C8H15N5O |
Hydroxyatrazine |
198.1350 |
1.233 |
All treatments except Fenton |
| DEHA |

|
C6H11N5O |
Deethylhydroxyatrazine |
170.1037 |
0.810 |
| DIHA |

|
C5H9N5O |
Deisopropylhydroxyatrazine |
156.0880 |
0.560 |
| CDAT |

|
C5H6ClN5O |
N-(4-Amino-6-chloro-1,3,5-triazin-2-yl)acetamide |
188.0334 |
1.264 |
All treatments except HVED |
| OEAT |

|
C5H7N5O2 |
N-(4-Amino-6-hydroxy-1,3,5-triazin-2-yl)acetamide |
170.0673 |
0.727 |
| CDDT |

|
C7H8ClN5O2 |
N,N′-(6-Chloro-1,3,5-triazine-2,4-diyl)diacetamide |
230.0440 |
1.451 |
| ODDT |

|
C7H9N5O3 |
N,N′-(6-Hydroxy-1,3,5-triazine-2,4-diyl)diacetamide |
212.0778 |
1.141 |
|
| DDA |

|
C3H4ClN5 |
Didealkylatrazine |
146.0228 |
1.023 |
All treatments except LFUS |
| AM |

|
C3H5N5O |
Ammeline |
128.0567 |
0.490 |
| CBOI |

|
C3H5N3O4 |
1-Carboxybiuret |
148.0353 |
0.416 |
HVED (very trace amounts) |
| CNIT |

|
C8H14ClN5O |
1-({4-Chloro-6-[(propan-2-yl)amino]-1,3,5-triazin-2-yl}amino)ethan-1-ol |
232.0960 |
1.868 |
Fenton |
| HAHT |

|
C8H14ClN5O2 |
2-({4-Chloro-6-[(1-hydroxyethyl)amino]-1,3,5-triazin-2-yl}amino)propan-2-ol |
248.0909 |
2.212 |
Atrazine degradation by HVED
In Fig. 3, atrazine degradation rates by HVED as a function of the effective time are given for different experimental conditions. As the results show, for the atrazine solution of 500 mL, within 2 ms of discharge, the degradation rate of atrazine in an argon atmosphere was lower than that in an air atmosphere, indicating that dissolved oxygen might enhance the degradation of atrazine in the discharge process. According to ref. 34 and 35, dissolved oxygen can react with the high-energy electrons and produce superoxide radical anions O2˙− (eqn (3)) that can degrade atrazine. So, it would be better to conduct the discharge experiments directly under the air.
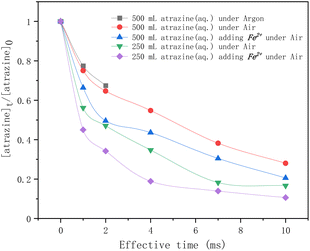 |
| | Fig. 3 Time profiles of atrazine degradation by HVED in different treatment volumes adding Fe2+ or not. | |
In addition, four comparative HVED experiments were conducted in different treatment volumes with or without Fe2+ addition. In the same treatment volume, adding Fe2+ enhanced the degradation rate of atrazine. This result is consistent with results from the literature;24 ferrous sulfate FeSO4·7H2O added to the pulsed electrical discharge reactor improved the degradation of atrazine due to the classical Fenton reaction. During the electrical discharge process, the electron impact of H2O molecules is the main way to produce hydroxy radicals ˙OH (eqn (4)).36 Reactions between radicals can produce hydrogen, hydrogen peroxide, or re-formed water (eqn (5)–(7)). These self-quenching reactions lead to the consumption of ˙OH radicals, which inhibit atrazine degradation. However, adding ferrous ions (Fe2+) reduced these ˙OH radicals' consumption via the Fenton reaction (eqn (8)). The results also show that a higher degradation rate of atrazine was observed for lower treatment volume. The specific energy consumption per unit pulse (J L−1 per pulse) is 400 J L−1 per pulse for 500 mL, and 800 J L−1 per pulse for 250 mL. At the same treatment time, the pulse number is the same; the specific energy consumption is higher for the lowest treated volume, thus enhancing the degradation rate of atrazine.
| | | H2O + e− → ˙OH + ˙H + e− | (4) |
| | | Fe2+ + H2O2 → Fe3+ + ˙OH + OH− | (8) |
Atrazine degradation by ultrasound
Fig. 4 shows the effect of frequency and Fe2+ on atrazine degradation by ultrasound. The degradation rates of atrazine by HFUS (525 kHz) were much higher than those with LFUS (50 kHz). The frequency and power of irradiation determine the physical characteristics of ultrasonication, such as bubble sizes and collapse temperatures. A higher frequency causes higher turbulence because the bubbles are more likely to implode, enhancing mass transfers. The results also showed that adding Fe2+ greatly improved atrazine degradation regardless of the frequency.
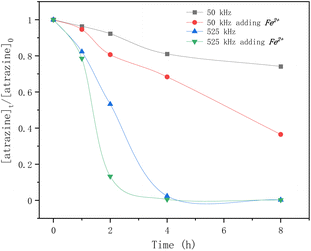 |
| | Fig. 4 Time profiles of atrazine degradation by ultrasound at different frequencies adding Fe2+ or not. | |
In atrazine aqueous solution, the main sono-chemical dissociation processes are homolytic cleavage of water to release ˙OH and ˙H radicals (eqn (9)).
| | | H2O + [US radiation] → ˙OH + ˙H | (9) |
But the self-combination of the produced ˙OH radicals (eqn (6)), with a second-order rate constant of 5 × 10⁹ M−1 s−1,37 is faster than the degradation of atrazine with a rate constant of 2.4 × 10⁹ M−1 s−1.24 The addition of Fe2+ is beneficial for the degradation of atrazine by releasing the ˙OH radical from its self-combination product hydrogen peroxide by the classical Fenton reaction (eqn (8)).
Atrazine degradation by Fenton oxidation
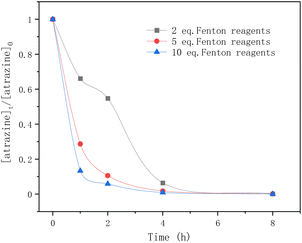
In Fig. 5, the equivalents of the Fenton reagents were studied in the degradation of atrazine by Fenton oxidation. Within the first 5 hours, atrazine was degraded more rapidly by adding 5 eq. and 10 eq. of Fenton reagents. After 5 h, atrazine was nearly completely degraded regardless of the number of equivalents of Fe2+. For 5 eq. and 10 eq. of Fenton reagents, the elimination of atrazine was rapid within the first hour, and tended to slow down until reaching equilibrium. For 2 eq. of Fenton reagents, the degradation rate of atrazine was rapid in the first hour, but flattened in the second hour, and later it became rapid again until it reached equilibrium. The reason may be due to the consumption of Fe2+ and the generation of ˙OH radicals.
 |
| | Fig. 5 Time profiles of atrazine degradation for different Fenton reagent equivalents. | |
As mentioned above, in the classical Fenton reaction, ferrous ions (Fe2+) react with hydrogen peroxide to form ˙OH radicals which are the reactive oxygen species for atrazine degradation. When most of the ferrous ions (Fe2+) are converted to ferric ions (Fe3+), the generated ferric ions (Fe3+) tend to react with hydrogen peroxides to release ferrous ions (Fe2+) (eqn (10)). According to ref. 38, the reaction rate constants of eqn (8) and (10) are 76 M−1 s−1 and 0.01 M−1 s−1 respectively. The reaction between ˙OH radicals and atrazine is instantaneous (eqn (11)), and its reaction rate constant is 2.4 × 10⁹ M−1 s−1.24 Therefore, for 2 eq. of Fe2+, at the beginning, the ˙OH radicals formed by the Fenton reaction quickly degraded atrazine.
As Fe2+ was consumed, the formation of the ˙OH radicals was inhibited and the degradation rate of atrazine was flattened. Then the release of Fe2+ from Fe3+ restarted the Fenton reaction and again provided ˙OH radicals for atrazine degradation. For 5 eq. and 10 eq. of Fe2+, sufficient Fe2+ ensured the continuous generation of ˙OH radicals from hydrogen peroxides, so the degradation rate of atrazine was very fast until it reached equilibrium. In this study, having a large number of equivalents of Fe2+ was found to favor atrazine degradation.
| | | Fe3+ + H2O2 → Fe2+ + HO2˙ + H+ | (10) |
| | | ˙OH + atrazine → products | (11) |
Formation kinetics of metabolites
Fig. 6 shows the formation kinetics of metabolites during atrazine degradation by different treatments. The chemical structures of these metabolites represented by abbreviations are shown in Table 1. In 525 kHz ultrasound treatment (Fig. 6(a) and (b)), dealkylation and carbonylation products such as DIA, CDIT and CDAT are the major metabolites while the dechlorination products are less present, and adding Fe2+ improved the production of dealkylation products DEA and DIA. In low frequency ultrasound treatment (Fig. 6(c)), dealkylation and carbonylation products CDIT and CDET as well as the dechlorination product ODIT are the main metabolites. In Fenton oxidation (Fig. 6(d)), the formation kinetics of metabolites were more variable over time, and it produced the final main product ammeline (AM).
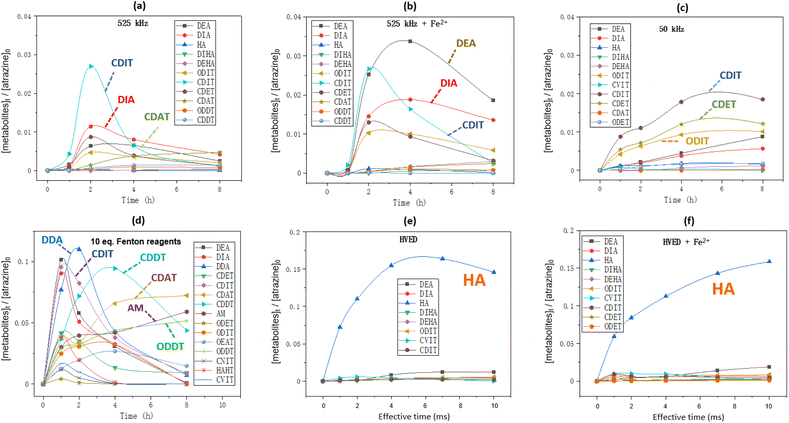 |
| | Fig. 6 Formation kinetics of metabolites during atrazine degradation: (a and b) 50 mL of atrazine solution was treated by ultrasound at 525 kHz with or without addition of 10 eq. of FeSO4·7H2O; (c) 50 mL of atrazine solution was treated by ultrasound at 50 kHz with or without addition of 10 eq. of FeSO4·7H2O; (d) 50 mL of atrazine solution was added by 10 eq. of H2O2 and 10 eq. of FeSO4·7H2O; (e and f) 250 mL of atrazine solution was treated by HVED with or without addition of 10 eq. of FeSO4·7H2O. Initial atrazine concentration is always 0.093 mmol L−1. | |
In HVED treatment (Fig. 6(e) and (f)), the dechlorination product hydroxyatrazine (HA) was the main product no matter whether Fe2+ was added or not. Notably, the ring cleavage product carboxybiuret (CBOI) was detected in the HVED treatment, which is not shown below (Fig. 6(e) and (f)) due to its trace amounts. This implies that HVED treatment is a potential degradation pathway for s-triazine ring-cleavage. In the future, we will make more effort to promote this s-triazine ring-cleavage so as to pursue mineralization.
Proposed mechanism
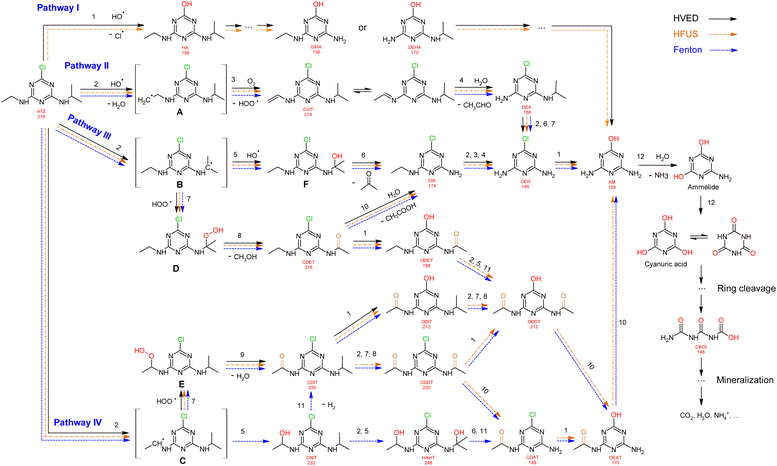
Based on the formation kinetics of metabolites, the mechanism of atrazine degradation is proposed in Fig. 7. ˙OH radicals may attack atrazine molecules in different positions, including attacking the alkylamino side chains,39 or attacking the ipso-position of the chlorine substituent.40 So, we propose four pathways I, II, III and IV for atrazine degradation according to different positions of ˙OH attack.
 |
| | Fig. 7 Proposed degradation pathways of atrazine. | |
Pathway I.
An attack of the ˙OH radical at the ipso-position of the chlorine substituent might lead to a geminal chlorohydrine, yielding an HO-adduct by elimination of an HCl molecule.39,41 The dechlorination-hydroxylated product HA was detected in HVED and HFUS processes, and it could be further degraded into DEHA and DIHA, followed by the generation of deeper oxidation products. It is noteworthy that hydroxylated atrazine degradation products were found to be less toxic.42 So, the HVED process appears to be more desirable for atrazine detoxification, since it mainly produced the hydroxylated product HA (Fig. 6(e) and (f)).
Pathway II.
Radical ˙OH attacks the β-C adjacent to the N atom on the ethylamino side chain, generating carbon-center radical A through H-atom abstraction. The carbon-centered radical A could be attacked by dissolved O2 to form a per-hydroxyl radical (HOO˙) and olefination product CVIT. Further oxidation of CVIT might lead to the formation of acetaldehyde and dealkylated product DEA.43 CVIT and DEA were both detected in HVED, HFUS and Fenton processes.
Pathway III.
Radical ˙OH attacks the α-C adjacent to the N atom on the isopropylamino side chain, generating carbon-center radical B through H-atom abstraction. The carbon-center radical B could be further attacked by BOH to form alkylic-hydroxylation intermediate F, leading to the generation of acetone and dealkylated product DIA. Another way, the per-hydroxyl radical (HOO˙) might attack the carbon-center radical B, inducing the generation of atrazine-peroxide intermediate D which might produce methanol and alkylic-oxidation product CDET.40 CDET might produce dechlorination-hydroxylated product ODET or dealkylated product DIA through the hydrolysis of the amide group.41 Both DIA and DEA mentioned in pathway II could be further oxidized to the fully dealkylated DDA and its dechlorination-hydroxylated product ammeline (AM). CDET, ODET, DIA, DDA and AM were detected in HVED, HFUS and Fenton processes. But DDA and AM were not found in the LFUS process, indicating that low frequency ultrasound is not conducive to deeper oxidation.
Pathway IV.
Radical ˙OH attacks the α-C adjacent to the N atom on the ethylamino side chain, generating carbon-center radical C through H-atom abstraction. The carbon-center radical C could be attacked by ˙OH to form alkylic-hydroxylation intermediate CNIT. Then, intermediate CNIT might produce alkylic-oxidation product CDIT through H-abstraction,44 or produce another alkylic-hydroxylation intermediate HAHT.18 CNIT and HAHT were detected in the Fenton process. HAHT might be further oxidized to the dealkylated product CDAT and its dechlorination-hydroxylated product OEAT. Another way, the carbon-center radical C could be attacked by HOO˙ and form atrazine-peroxide intermediate E, followed by the generation of CDIT. CDIT could produce its dechlorination-hydroxylated product ODIT, or be further oxidized to CDDT, followed by the generation of ODDT and CDAT. Previous studies45,46 have shown that carboxybiuret (CBOI) formed from ring cleavage of cyanuric acid might undergo spontaneous decarboxylation to biuret, which could be further mineralized into small molecules such as CO2, H2O, NH3, etc. However, the specific mechanism of ring cleavage is still uncertain, which will be the content of future research. In the HVED process, CDDT, ODDT, CDAT and OEAT were not detected, but AM and the ring cleavage product CBOI were detected, indicating that HVED treatment is more favorable for mineralization.
In the final degradation stage of these four pathways, the dechlorination-hydroxylated product AM is generated, and its deeper oxidations may lead to the formation of the ring cleavage product CBOI, which could be further mineralized into small molecules such as CO2, H2O, NH3, etc. However, the specific mechanism of ring cleavage is still unclear and needs further study.
Comparison of different degradation techniques
In Table 2, high frequency ultrasound, Fenton oxidation and HVED treatments are compared in terms of degradation rate of atrazine, main formed metabolites and specific energy consumption. The toxicity ranking of atrazine and its metabolites is ATZ > DEA > DIA > AM > DDA > HA.3 For high frequency ultrasound treatment, after 2 h, the atrazine degradation rate was unfavorable at only 47%, and adding ferrous ions doubled the degradation rate to 87%, but the disadvantages still exist with the presence of toxic main metabolites and a high energy consumption. For Fenton oxidation, although it reached the highest atrazine degradation rate of 95%, it produced toxic main metabolite AM. For HVED, adding ferrous ions enhanced the degradation rate of atrazine from 83% to 89%, due to the Fenton reaction, in which ferrous ions reacted with the hydrogen peroxide produced by the discharge.24 By comparison, HVED is more advantageous because of the high degradation efficiency in short treatment time, the presence of less toxic main metabolite HA and the lower energy consumption.
Table 2 Comparison of high frequency ultrasound, Fenton oxidation and HVED treatments
| Technologies |
Degradation rate of atrazine |
Main formed metabolites |
Specific energy consumption (kJ L−1) |
| Ultrasound (525 kHz) |
47% (treatment time 2 h) |
DIA |
11![[thin space (1/6-em)]](https://www.rsc.org/images/entities/char_2009.gif) 520 kJ L−1 520 kJ L−1 |
| Ultrasound (525 kHz) + Fe2+ |
87% (treatment time 2 h) |
DEA |
| Fenton oxidation (10 eq. of Fenton reagents) |
>95% (treatment time 2 h) |
AM |
|
| HVED (250 mL ATZ solution) |
83% (effective time 10 ms) |
HA |
800 kJ L−1 |
| HVED + Fe2+ (250 mL atrazine solution) |
89% (effective time 10 ms) |
Conclusions
An innovative atrazine degradation method was reported using high voltage electrical discharge (HVED). The HVED method was compared with the traditional atrazine degradation method, Fenton oxidation and ultrasound treatment at high or low frequency. HVED treatment was more advantageous, since atrazine can be mostly degraded (89%) with the addition of ferrous ions, in short effective time (10 ms), while the treatment time of the Fenton oxidation and ultrasound process lasted for 2 h. Besides, the main generated metabolite hydroxyatrazine (HA) in the HVED process was less toxic than the deethylatrazine (DEA) and deisopropylatrazine (DIA) generated in the ultrasound process, and ammeline (AM) generated in the Fenton process. Also, when the degradation rates of atrazine were around 87%, the specific energy requirement of HVED (800 kJ L−1) was much lower than that of ultrasound at high frequency (11![[thin space (1/6-em)]](https://www.rsc.org/images/entities/char_2009.gif) 520 kJ L−1). In addition, ferrous ions (Fe2+) promoted the degradation of atrazine in those three treatments via the Fenton reaction with hydrogen peroxide (H2O2), releasing the important reactive oxygen species, hydroxyl radicals ˙OH. Finally, the formation kinetics of metabolites and the proposed pathways may provide a reference for future research on atrazine degradation.
520 kJ L−1). In addition, ferrous ions (Fe2+) promoted the degradation of atrazine in those three treatments via the Fenton reaction with hydrogen peroxide (H2O2), releasing the important reactive oxygen species, hydroxyl radicals ˙OH. Finally, the formation kinetics of metabolites and the proposed pathways may provide a reference for future research on atrazine degradation.
Author contributions
Junting Hong: conceptualization, methodology, data analysis, writing – original draft preparation. Nadia Boussetta: methodology, writing – reviewing & editing. Gérald Enderlin: writing – reviewing & editing. Franck Merlier: conceptualization, data analysis, writing – reviewing & editing and supervision. Nabil Grimi: conceptualization, writing – reviewing & editing and supervision.
Conflicts of interest
There are no conflicts to declare.
Acknowledgements
The authors are grateful for the Investments for the Future of the French Government (grant number ANR-001) and equipment supported by the Regional Council of Picardie and European Union (grant number CPER 2007–2020). The first author wishes to thank the China Scholarship Council (CSC) for financial support (grant number 202006010115).
References
- D. Munaron, B. Mérigot, V. Derolez, N. Tapie, H. Budzinski and A. Fiandrino, Sci. Total Environ., 2022, 867, 161303 CrossRef PubMed.
- B. G. Silva Pinto, T. K. Marques Soares, M. Azevedo Linhares and N. Castilhos Ghisi, Sci. Total Environ., 2020, 748, 141382 CrossRef CAS PubMed.
- J. Hong, N. Boussetta, G. Enderlin, F. Merlier and N. Grimi, Foods, 2022, 11, 2416 CrossRef CAS PubMed.
- F. Giannini-Kurina, J. Borello, I. Cañas, S. Hang and M. Balzarini, Soil Tillage Res., 2022, 219, 105320 CrossRef.
- T. Bohn, E. Cocco, L. Gourdol, C. Guignard and L. Hoffmann, Food Addit. Contam.: Part A, 2011, 28, 1041–1054 CrossRef CAS PubMed.
- Y. Yun, S. Lee, C. So, R. Manhas, C. Kim, T. Wibowo, M. Hori and N. Hunter, Environ. Health Perspect., 2022, 130, 117007 CrossRef CAS PubMed.
- T. B. Hayes, V. Khoury, A. Narayan, M. Nazir, A. Park, T. Brown, L. Adame, E. Chan, D. Buchholz, T. Stueve and S. Gallipeau, Proc. Natl. Acad. Sci. U. S. A., 2010, 107, 4612–4617 CrossRef CAS PubMed.
- S. E. Wirbisky and J. L. Freeman, Toxics, 2015, 3, 414–450 CrossRef CAS.
- J. Bethsass and A. Colangelo, Int. J. Occup. Environ. Health, 2006, 12, 260–267 CrossRef.
- J. A. Rusiecki, A. De Roos, W. J. Lee, M. Dosemeci, J. H. Lubin, J. A. Hoppin, A. Blair and M. C. R. Alavanja, JNCI, J. Natl. Cancer Inst., 2004, 96, 1375–1382 CrossRef CAS.
- E. M. Brovini, B. C. T. de Deus, J. A. Vilas-Boas, G. R. Quadra, L. Carvalho, R. F. Mendonça, R. d. O. Pereira and S. J. Cardoso, Sci. Total Environ., 2021, 771, 144754 CrossRef CAS PubMed.
- J. T. Sun, L. L. Pan, Y. Zhan, D. C. W. Tsang, L. Z. Zhu and X. D. Li, Environ. Geochem. Health, 2017, 39, 369–378 CrossRef CAS.
- X. Cheng, H. Liang, A. Ding, X. Tang, B. Liu, X. Zhu, Z. Gan, D. Wu and G. Li, Water Res., 2017, 113, 32–41 CrossRef CAS PubMed.
- P. Wang, Y. Yin, Y. Guo and C. Wang, RSC Adv., 2016, 6, 10615–10624 RSC.
- Y. Liu and J. Wang, Chem. Eng. J., 2023, 466, 143147 CrossRef CAS.
- S. Wang and J. Wang, ACS ES&T Water, 2022, 2, 852–862 Search PubMed.
- S. Wang, G. Yu and J. Wang, Chemosphere, 2023, 317, 137889 CrossRef CAS PubMed.
- L. J. Xu, W. Chu and N. Graham, J. Hazard. Mater., 2014, 275, 166–174 CrossRef CAS PubMed.
- X. Lu, W. Qiu, J. Peng, H. Xu, D. Wang, Y. Cao, W. Zhang and J. Ma, J. Hazard. Mater., 2021, 403, 123915 CrossRef CAS PubMed.
- S. M. R. Azam, H. Ma, B. Xu, S. Devi, M. A. B. Siddique, S. L. Stanley, B. Bhandari and J. Zhu, Trends Food Sci. Technol., 2020, 97, 417–432 CrossRef CAS.
- B. Jiang, J. Zheng, S. Qiu, M. Wu, Q. Zhang, Z. Yan and Q. Xue, Chem. Eng. J., 2014, 236, 348–368 CrossRef CAS.
- M. R. Ghezzar, F. Abdelmalek, M. Belhadj, N. Benderdouche and A. Addou, J. Hazard. Mater., 2009, 164, 1266–1274 CrossRef CAS PubMed.
- V. I. Grinevich, E. Y. Kvitkova, N. A. Plastinina and V. V. Rybkin, Plasma Chem. Plasma Process., 2011, 31, 573–583 CrossRef CAS.
- S. Mededovic and B. R. Locke, Ind. Eng. Chem. Res., 2007, 46, 2702–2709 CrossRef CAS.
- Y. Shang, N. Jiang, Z. Liu, C. Li, H. Sun, H. Guo, B. Peng and J. Li, Chem. Eng. J., 2023, 452, 139342 CrossRef CAS.
- J. Feng, L. Jiang, D. Zhu, K. Su, D. Zhao, J. Zhang and Z. Zheng, Environ. Sci. Pollut. Res., 2016, 23, 9204–9214 CrossRef CAS PubMed.
- M. Hijosa-Valsero, R. Molina, H. Schikora, M. Müller and J. M. Bayona, J. Hazard. Mater., 2013, 262, 664–673 CrossRef CAS PubMed.
- T. Shen, X. Wang, P. Xu, C. Yang, J. Li, P. Wang and G. Zhang, Environ. Res., 2022, 212, 113287 CrossRef CAS PubMed.
- P. Vanraes, G. Willems, A. Nikiforov, P. Surmont, F. Lynen, J. Vandamme, J. Van Durme, Y. P. Verheust, S. W. H. Van Hulle, A. Dumoulin and C. Leys, J. Hazard. Mater., 2015, 299, 647–655 CrossRef CAS PubMed.
- Q. Wang, A. Zhang, P. Li, P. Héroux, H. Zhang, X. Yu and Y. Liu, J. Hazard. Mater., 2021, 403, 124087 CrossRef CAS PubMed.
- N. Wardenier, Z. Liu, A. Nikiforov, S. W. H. Van Hulle and C. Leys, Chemosphere, 2019, 234, 715–724 CrossRef CAS.
- D. Zhu, L. Jiang, R.-l. Liu, P. Chen, L. Lang, J.-w. Feng, S.-j. Yuan and D.-y. Zhao, Chemosphere, 2014, 117, 506–514 CrossRef CAS PubMed.
- J. Hong, N. Boussetta, G. Enderlin, N. Grimi and F. Merlier, Molecules, 2022, 27, 9021 CrossRef CAS.
- G. Nie, L. Xiao, J. Bi, S. Wang and X. Duan, Appl. Catal., B, 2022, 315, 121584 CrossRef CAS.
- X. Wang, Y. Wang, N. Chen, Y. Shi and L. Zhang, Chemosphere, 2020, 244, 125568 CrossRef CAS PubMed.
- P. Lukes and B. R. Locke, J. Phys. D: Appl. Phys., 2005, 38, 4074 CrossRef CAS.
- Y. Hu, Z. Zhang and C. Yang, Ultrason. Sonochem., 2008, 15, 665–672 CrossRef CAS PubMed.
- D. R. Grymonpré, A. K. Sharma, W. C. Finney and B. R. Locke, Chem. Eng. J., 2001, 82, 189–207 CrossRef.
- A. Tauber and C. von Sonntag, Acta Hydrochim. Hydrobiol., 2000, 28, 15–23 CrossRef CAS.
- C. A. Aggelopoulos, D. Tataraki and G. Rassias, Chem. Eng. J., 2018, 347, 682–694 CrossRef CAS.
- Y. Ji, C. Dong, D. Kong, J. Lu and Q. Zhou, Chem. Eng. J., 2015, 263, 45–54 CrossRef CAS.
- R. N. Lerch, W. W. Donald, Y.-X. Li and E. E. Alberts, Environ. Sci. Technol., 1995, 29, 2759–2768 CrossRef CAS PubMed.
- J. A. Khan, X. He, N. S. Shah, H. M. Khan, E. Hapeshi, D. Fatta-Kassinos and D. D. Dionysiou, Chem. Eng. J., 2014, 252, 393–403 CrossRef CAS.
- X. Kong, L. Wang, Z. Wu, F. Zeng, H. Sun, K. Guo, Z. Hua and J. Fang, Water Res., 2020, 177, 115784 CrossRef CAS.
- A. K. Bera, K. G. Aukema, M. Elias and L. P. Wackett, Sci. Rep., 2017, 7, 45277 CrossRef CAS PubMed.
- J. L. Murphy, M. J. Arrowood, X. Lu, M. C. Hlavsa, M. J. Beach and V. R. Hill, Environ. Sci. Technol., 2015, 49, 7348–7355 CrossRef CAS PubMed.
|
| This journal is © The Royal Society of Chemistry 2023 |
Click here to see how this site uses Cookies. View our privacy policy here.  Open Access Article
 ab,
Nadia
Boussetta
a,
Gérald
Enderlin
 a,
Franck
Merlier
b and
Nabil
Grimi
*a


![[thin space (1/6-em)]](https://www.rsc.org/images/entities/char_2009.gif) 520 kJ L−1
520 kJ L−1![[thin space (1/6-em)]](https://www.rsc.org/images/entities/char_2009.gif) 520 kJ L−1). In addition, ferrous ions (Fe2+) promoted the degradation of atrazine in those three treatments via the Fenton reaction with hydrogen peroxide (H2O2), releasing the important reactive oxygen species, hydroxyl radicals ˙OH. Finally, the formation kinetics of metabolites and the proposed pathways may provide a reference for future research on atrazine degradation.
520 kJ L−1). In addition, ferrous ions (Fe2+) promoted the degradation of atrazine in those three treatments via the Fenton reaction with hydrogen peroxide (H2O2), releasing the important reactive oxygen species, hydroxyl radicals ˙OH. Finally, the formation kinetics of metabolites and the proposed pathways may provide a reference for future research on atrazine degradation.


