 Open Access Article
Creative Commons Attribution 3.0 Unported Licence
Cooperative CO2 adsorption mechanism in a perfluorinated CeIV-based metal organic framework†
Margherita
Cavallo
a,
Cesare
Atzori
 ab,
Matteo
Signorile
 a,
Ferdinando
Costantino
 c,
Diletta Morelli
Venturi
c,
Athanasios
Koutsianos‡
d,
Kirill A.
Lomachenko
c,
Diletta Morelli
Venturi
c,
Athanasios
Koutsianos‡
d,
Kirill A.
Lomachenko
 b,
Lucia
Calucci
 ef,
Francesca
Martini
 fg,
Andrea
Giovanelli
 g,
Marco
Geppi
 fg,
Valentina
Crocellà
 *a and
Marco
Taddei
 *fgh
*fgh
aDipartimento di Chimica, Centro di Riferimento NIS e INSTM, Università di Torino,
Via G. Quarello 15, I-10135 and Via P. Giuria 7, I-10125 Torino, Italy. E-mail: valentina.crocella@unito.it
bEuropean Synchrotron Radiation Facility, 71 Avenue des Martyrs, CS 40220, 38043 Grenoble Cedex 9, France
cDipartimento di Chimica, Biologia e Biotecnologie, Unità di Ricerca INSTM, Università di Perugia, Via Elce di Sotto 8, 06123 Perugia, Italy
dCentre for Research & Technology Hellas/Chemical Process and Energy Resources Institute, 6th km. Charilaou-Thermis, 57001, Greece
eIstituto di Chimica dei Composti Organo Metallici, Unità di Ricerca INSTM, Consiglio Nazionale delle Ricerche, Via Giuseppe Moruzzi 1, 56124 Pisa, Italy
fCentro per l’Integrazione della Strumentazione Scientifica dell’Università di Pisa (CISUP), 56126, Pisa, Italy
gDipartimento di Chimica e Chimica Industriale, Unità di Ricerca INSTM, Università di Pisa, Via Giuseppe Moruzzi 13, 56124 Pisa, Italy. E-mail: marco.taddei@unipi.it
hEnergy Safety Research Institute, Swansea University, Fabian Way, Swansea, SA1 8EN, UK
First published on 14th February 2023
Abstract
Adsorbents able to uptake large amounts of gases within a narrow range of pressure, i.e., phase-change adsorbents, are emerging as highly interesting systems to achieve excellent gas separation performances with little energy input for regeneration. A recently discovered phase-change metal–organic framework (MOF) adsorbent is F4_MIL-140A(Ce), based on CeIV and tetrafluoroterephthalate. This MOF displays a non-hysteretic step-shaped CO2 adsorption isotherm, reaching saturation in conditions of temperature and pressure compatible with real life application in post-combustion carbon capture, biogas upgrading and acetylene purification. Such peculiar behaviour is responsible for the exceptional CO2/N2 selectivity and reverse CO2/C2H2 selectivity of F4_MIL-140A(Ce). Here, we combine data obtained from a wide pool of characterisation techniques – namely gas sorption analysis, in situ infrared spectroscopy, in situ powder X-ray diffraction, in situ X-ray absorption spectroscopy, multinuclear solid state nuclear magnetic resonance spectroscopy and adsorption microcalorimetry – with periodic density functional theory simulations to provide evidence for the existence of a unique cooperative CO2 adsorption mechanism in F4_MIL-140A(Ce). Such mechanism involves the concerted rotation of perfluorinated aromatic rings when a threshold partial pressure of CO2 is reached, opening the gate towards an adsorption site where CO2 interacts with both open metal sites and the fluorine atoms of the linker.
Introduction
Solid adsorbents for gas separations are the object of intensive research, due to their potential advantages, in terms of energy intensity and recyclability, over state-of-the-art technologies based on either cryogenic distillation or absorption/scrubbing.1–5 Metal–organic frameworks (MOFs) are among the candidates investigated to this end, alongside zeolites, activated carbons and amine-functionalised porous silicas.3,4,6,7 If compared to the other classes of adsorbents, MOFs offer superior structural control at the atomic level and virtually unlimited possibilities for functionalisation and tuning of the physicochemical properties.1 One of the most intriguing aspects of MOF adsorbents is that they can display unique adsorption phenomena, associated with either highly specific interaction of the adsorbate with the surface, structural flexibility, or combinations thereof.8–16So-called “phase-change” MOFs are of particular interest for gas separations because they display steep gas uptake when a threshold partial pressure of a given adsorbate is reached, with potential benefits in terms of achievable working capacity, selectivity and energy efficiency.17,18 This behaviour is determined by an adsorption-induced structural rearrangement, which can be either (i) a breathing/swelling effect, due to the flexible nature of the framework, which leads to significant variations in the volume of the unit cell;9,19–22 (ii) a cooperative adsorption mechanism, such as the CO2 insertion occurring in so-called amine-appended MOFs, which involves changes in the coordination environment of the metal and highly specific hydrogen bonding interactions;18,23,24 or (iii) the concerted rotation of organic rings within the framework, which results in a ring configuration that maximises the host–guest interaction.25–27
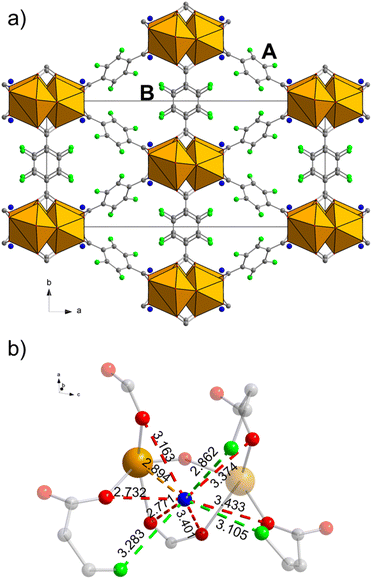
Some of us recently reported the discovery of F4_MIL-140A(Ce), an ultramicroporous MOF based on CeIV and tetrafluoroterephthalate (Fig. 1).28 F4_MIL-140A(Ce) is built from the connection of one-dimensional inorganic building units, made up of octacoordinated CeIV ions, carboxylate groups belonging to the linker and μ3-O species, via the perfluorinated aromatic rings of the linker. This structure features narrow triangular channel-like pores lined with the fluorine atoms belonging to the linkers (Fig. 1a). Different from its ZrIV-based MIL-140 analogues,29 F4_MIL-140A(Ce) contains one water molecule per Ce atom, located in the proximity of the metal atom and at distances compatible with a number of non-covalent interactions with the organic linker (Fig. 1b).
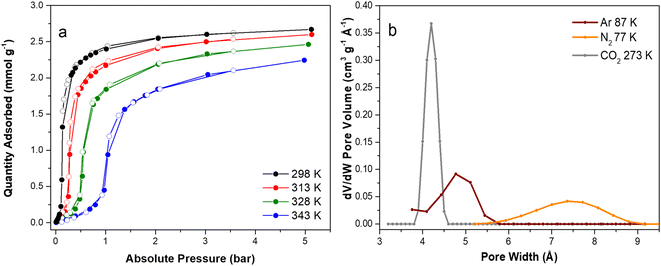
F4_MIL-140A(Ce) displays a non-hysteretic step-shaped CO2 adsorption isotherm, with steep uptake increase at pressure <0.2 bar at 298 K, leading to reach saturation within a narrow range of pressure.28 Such behaviour is not observed when the MOF is exposed to other gases, e.g., N2 or C2H2, endowing this material with high CO2/N2 selectivity and with reverse CO2/C2H2 selectivity, a highly sought-after feature.30 Furthermore, this MOF can be synthesised from commercially available reagents in mild conditions and in aqueous medium, an attractive method for prospective bulk production.31 Considering such a unique combination of features, we believe that understanding the adsorption mechanism in F4_MIL-140A(Ce) becomes an issue of primary concern. Besides the fundamental interest in describing a potentially novel phenomenon, the knowledge deriving from such an endeavour might help to engineer new materials with the same working principle and improved separation performance.
A mechanism was in fact recently proposed based on powder X-ray diffraction (PXRD) data, infrared (IR) spectroscopy data, and density functional theory (DFT) simulations, claiming that CO2 adsorbs in a site located among three fluorinated rings, where the Lewis acidic C atom interacts with four electron-rich F atoms,30 akin to what observed in SIFSIX-3 materials32,33 and in fluorinated bis(pyrazolyl)-based MOFs.34 In the present work, we propose an alternative mechanism, deduced from the combination of data obtained from a wide pool of characterisation techniques, including gas sorption analysis, in situ IR spectroscopy, in situ PXRD, in situ X-ray absorption spectroscopy (XAS) at the Ce K-edge, 1H, 13C and 19F solid state nuclear magnetic resonance (SSNMR) spectroscopy and adsorption microcalorimetry, with periodic DFT simulations.
Results and discussion
Adsorption properties
![[thin space (1/6-em)]](https://www.rsc.org/images/entities/char_2009.gif) Pmaxversus temperature, a linear trend emerges between 298 and 343 K, in principle allowing to predict which pressure the step will take place at within the investigated temperature range (Fig. S5†). The isosteric heat of adsorption (Qst), extracted from the fitted isotherms using the linear version of the Clausius–Clapeyron equation (Fig. S6†), ranges between 35 and 45 kJ mol−1.
Pmaxversus temperature, a linear trend emerges between 298 and 343 K, in principle allowing to predict which pressure the step will take place at within the investigated temperature range (Fig. S5†). The isosteric heat of adsorption (Qst), extracted from the fitted isotherms using the linear version of the Clausius–Clapeyron equation (Fig. S6†), ranges between 35 and 45 kJ mol−1.
The sharp uptake of gas (i.e. the isotherm step) moves to higher pressures by increasing the temperature. This peculiar adsorption feature allows easily adapting the phase transition mechanism of this MOF to the partial pressure of common post-combustion streams. Additionally, this characteristic isotherm is known to be particularly suitable for adsorption processes thanks to the large working capacity that can be achieved upon small swings in temperature and/or pressure. Such step-shaped isotherms have previously been observed in other MOFs exhibiting higher CO2 adsorption capacities at saturation, as in the amine-appended Mg2(dobpdc)18 (3.4 mmol g−1 at 298 K and 5 bar) and in ELM-11 (ref. 9) (3.6 mmol g−1 at 273 K and 0.3 bar). However, in the former case, the material displays a much higher isosteric heat of CO2 adsorption (around −70 kJ mol−1), whereas in the latter the phase transition occurs in a higher pressure range (300 mbar at 273 K). This leads, on the one hand, to stronger interaction energies and, consequently, to higher regeneration energies, on the other hand, to a low adsorption of CO2 at low pressures. To further investigate the peculiar adsorption mechanism of F4_MIL-140A(Ce), the textural properties were accurately studied by collecting low pressure adsorption/desorption volumetric isotherms using three different adsorptives: N2 at 77 K, Ar at 87 K and CO2 at 273 K (Fig. S7† in the ESI†). The isotherms were measured consecutively using the same MOF powder. Therefore, the differences observed with the selected probe molecules can be attributed to the nature of the probe molecule at the analysis temperature. Ar and N2 show the typical type I(a) isotherm characteristic of microporous materials, while CO2 exhibits the less common step-shaped isotherm specific of the so-called “phase change” adsorbents (Fig. S7a† in the 0 < p/p0 < 0.03 range and Fig. S7b† in the whole p/p0 range), in agreement with the previous results reported by D'Amato et al.28 The semi-logarithmic isotherms reported in the inset of Fig. S7a† show that the pore filling with Ar occurs at higher relative pressure regions compared to N2. The difference in relative pressures becomes more significant if the MOF possesses open metal sites, highlighting the advantage of using monoatomic inert Ar for the characterization of ultramicroporous MOFs. The BET area values (Table S2 and Fig. S8–S10†) display an incremental trend, suggesting a different interaction of the molecules with the material (Table S2†). The BET area obtained by Ar isotherm (213.8 m2 g−1) is lower compared to N2 (244.8 m2 g−1). The spherical Ar molecules display a more ideal packing on the surface compared to diatomic N2 molecules, whose orientation on the surface can be affected by the possible presence of open metal sites able to interact with N2 itself. As a consequence, an uncertainty in the evaluation of the cross-sectional area of nitrogen gas is very likely, resulting in an overestimation of the computed BET area with this probe.35,36 The highest BET area value is the one derived from the CO2 isotherm at 273 K (262 m2 g−1), suggesting that a structural rearrangement might occur when F4_MIL-140A(Ce) interacts with CO2, as highlighted by the peculiar step-shaped isotherm collected by using this molecule as adsorptive (Fig. S7†).
The pore size distribution (PSD) was also evaluated by applying the non-local density functional theory (NL-DFT) to the adsorption isotherms. It is well-known that the PSD computed by NL-DFT methods depends on the selected kernel of isotherms. However, despite the high number of MOF structures reported to date, proper DFT kernels to study the unique pore size and shapes of these microporous materials are still missing.36 For this reason, the PSD data for MOFs should be considered as merely indicative. Moreover, the goodness of the PSD obtained by DFT depends on the goodness of the fitting of the experimental isotherm (see Fig. S11, S12 and S13†). In all the investigated cases, the fit between the calculated and the experimental isotherms was imperfect (the best fit is the one obtained with the N2 isotherm). Again, this suggests that PSD data should be merely considered as a possible (and not unquestionable) description of the intrinsic porosity of the investigated MOF. The PSDs computed from the three molecular probes are compared in Fig. 2b and Table S1.† N2, a non-ideal molecule for the analysis of microporous materials, gives the highest value (∼7.4 Å), while Ar and CO2 PSDs show the presence of a family of ultramicropores of around 4.8 and 4.2 Å diameter, respectively, values in better agreement with that estimated on the basis of the crystal structure of as-synthesised F4_MIL-140A(Ce) (between 4.8 and 5.8 Å, measured from the atomic centres).28 The result obtained with N2 does not surprise, indeed it is known that this probe can significantly overestimate the PSD of MOFs with very small micropores, especially if the pore dimension is close to the kinetic diameter of the molecule (3.64 Å for N2).36 The micropore size obtained by both Ar and CO2 is more reliable and the PSD derived from CO2 at 273 K is very narrow. This could be a further proof of a possible structural rearrangement of the material in the presence of CO2, which allows the detection of the actual micropores size just with an adsorptive inducing a “phase change” adsorption. Still, it is worth noting that N2 and Ar show a compatible micropore volume (Fig. S14†) while CO2 displays a higher value, which might be seen as a further proof of a structural transition caused by this molecule.
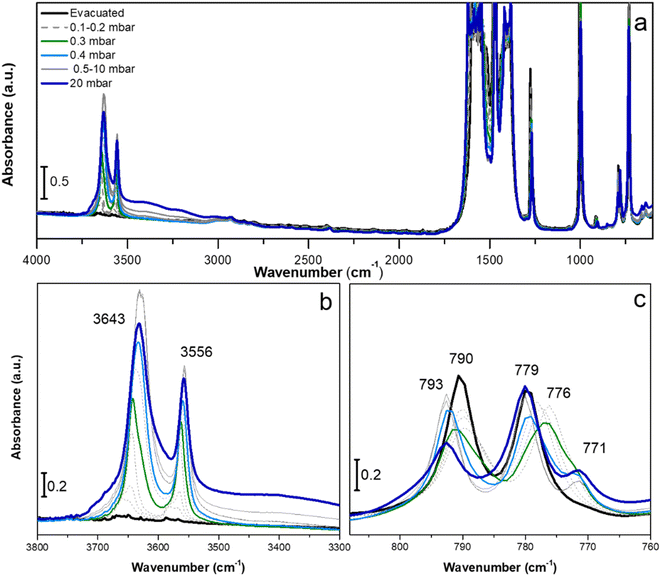 | ||
| Fig. 3 IR spectra of F4_MIL-140A(Ce) collected dosing 0.1–20 mbar of H2O on the evacuated sample, reported in the full spectral range (a), and in the 3800–3300 cm−1 (b) and 810–760 cm−1 (c) regions. | ||
In situ IR analysis using CO and N2 as molecular probes at liquid nitrogen temperature was performed to further study the presence of Lewis acidic adsorption sites in the evacuated MOF (Fig. S16†). Both the CO and N2 IR measurements highlight that, after H2O removal, F4_MIL-140A(Ce) features accessible CeIV sites available for interaction with Lewis bases, even as weak as N2. Detailed discussion of these results is available in Section S4 of the ESI.†
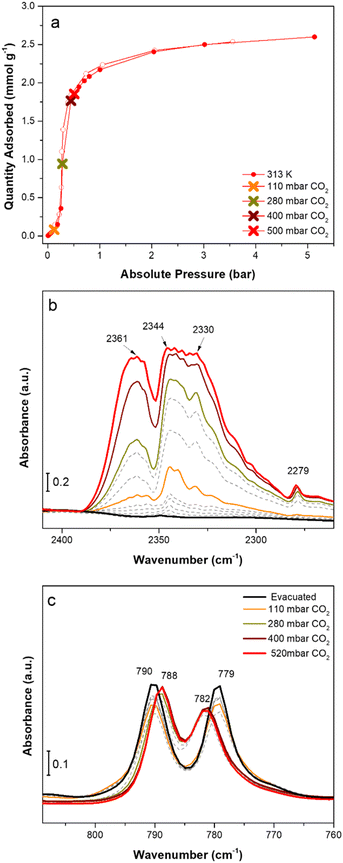
Next, we investigated the vibrational behaviour of evacuated F4_MIL-140A(Ce) when exposed to an increasing CO2 pressure in the range between 110 and 550 mbar, at beam temperature (i.e., around 313 K). The CO2 pressure range was accurately selected by considering the position of the step of the CO2 isotherm collected at 313 K (Fig. 4a). The incremental CO2 doses are responsible for significant changes in the CO2 asymmetric stretching region between 2400 and 2250 cm−1 (Fig. 4b) and in the 800–770 cm−1 spectral range (Fig. 4c). Upon sending CO2 doses below the isotherm step (i.e., until around 110 mbar), a new, quite broad band at 2344 cm−1 appears, slightly shifted to lower frequencies compared to the antisymmetric CO2 stretching vibrational mode (at 2349 cm−1). At the same time, no significant changes are detected in the low frequency region, showing only a slight decrease in intensity of the 790 and 779 cm−1 bands. These spectral modifications suggest that, below the isotherm step, CO2 weakly interacts with the sorbent, likely because access to the open metal sites is prevented by the structural arrangement within channels. By increasing the CO2 pressure and approaching the isotherm step, a new band at 2361 cm−1, probably due to the interaction of CO2 with CeIV, appears, while the 2344 cm−1 band increases giving rise to an intense band with apparent maxima at 2344 and 2330 cm−1. In general, the assignment of the above-mentioned bands is not straightforward because the rotovibrational profile of gaseous CO2, which falls in the same spectral region and prevails at high CO2 coverages, superimposes on those components. Concurrently, the bands at 790 and 779 cm−1 are shifted to 788 and 782 cm−1, respectively, suggesting that changes are occurring on the fluorinated aromatic rings. The CO2 doses corresponding to the final part of the adsorption step and the beginning of the isotherm plateau cause no further changes in the low frequency spectral range, while both the 2361 and the 2344 and 2330 cm−1 bands go out of scale. The predominance of the band at 2361 cm−1, possibly related to the direct interaction of CO2 with CeIV open metal sites, at CO2 pressures that correspond to the isotherm step could be a further proof of the occurrence of a phase-change adsorption process that enables the establishment of a strong adsorbate/surface interaction.
![[thin space (1/6-em)]](https://www.rsc.org/images/entities/char_2009.gif) :
:![[thin space (1/6-em)]](https://www.rsc.org/images/entities/char_2009.gif) 1 adsorbate/Ce ratio) was studied. For H2O, CO and N2, the molecule was positioned in direct interaction with the Ce open metal site through the O atom, the C atom and one of the N atoms, respectively. In the case of CO2, two possible adsorption sites were considered: (i) as for the other adsorbates, with an O atom in direct interaction with Ce (referred as “Ce” site); and (ii) positioned in the pore and interacting with the surrounding perfluorobenzene rings, as recently proposed by Zhao and coworkers30 (labelled here as “channel” site). The graphical representation of these adducts is presented Section 5 of the ESI,† whereas the main structural parameters are listed in Table S3.† The adsorption energetics for these adducts were also computed (details in Section 5 of the ESI†), as reported in Table 1.
1 adsorbate/Ce ratio) was studied. For H2O, CO and N2, the molecule was positioned in direct interaction with the Ce open metal site through the O atom, the C atom and one of the N atoms, respectively. In the case of CO2, two possible adsorption sites were considered: (i) as for the other adsorbates, with an O atom in direct interaction with Ce (referred as “Ce” site); and (ii) positioned in the pore and interacting with the surrounding perfluorobenzene rings, as recently proposed by Zhao and coworkers30 (labelled here as “channel” site). The graphical representation of these adducts is presented Section 5 of the ESI,† whereas the main structural parameters are listed in Table S3.† The adsorption energetics for these adducts were also computed (details in Section 5 of the ESI†), as reported in Table 1.
| Model | ΔE (kJ mol−1) | ΔH (kJ mol−1) | ΔG (kJ mol−1) |
|---|---|---|---|
| +H2O | −86.0 | −77.8 | −35.8 |
| +CO2 (Ce) | −55.2 | −46.1 | −7.5 |
| +CO2 (channel) | −35.2 | −26.1 | 10.5 |
| +CO | −40.5 | −36.1 | 1.0 |
| +N2 | −32.2 | −28.0 | 6.8 |
The energetic description of the adsorption phenomena suggests a strong preference of F4_MIL-140A(Ce) for H2O over the other investigated adsorbates. Interestingly, in the case of CO2, distinct interaction energies are computed depending on the adsorption site. In particular, the “channel” site, analogous to what previously proposed by Zhao and coworkers as the preferred one for CO2 adsorption, shows a lower interaction energy compared to that of CO2 in direct interaction with the open metal site. Furthermore, the ΔG values estimated for the adsorption occurring at the two sites point out that the interaction is thermodynamically favoured only for the “Ce” site, whereas the “channel” site is not providing a stable adduct at ambient conditions. In fact, the computed ΔG value for CO2 adsorption at the “channel” site is the highest observed in Table 1, suggesting that the involvement of the CeIV site is key for a favourable interaction with the adsorbates. A close inspection of the optimised crystal structures reveals that both H2O and CO2 are stabilised by interactions with both the metal centre (a Lewis acid), through their negatively polarised oxygen atoms, and the fluorine atoms belonging to the organic linker (Lewis bases), through the H atoms and C atom, respectively (Fig. S18–S24†). Thus, the ability of H2O and CO2 to behave as both Lewis acids and bases appears to be crucial to maximise their affinity for the adsorbent surface. We also simulated the interaction of CO2 with a fully hydrogenated MIL-140A(Ce) (Fig. S25†), observing a significant reduction in binding energy to the “Ce” site down to −39.4 kJ mol−1. This value is comparable to the strength of the interaction computed in the case of CO with F4_MIL-140A(Ce). Notably, the Gibbs free energy becomes positive in MIL-140A(Ce) (5.8 kJ mol−1), suggesting that the interactions with the linker also play a key role in stabilising the MOF-CO2 adduct.
Structural characterisation
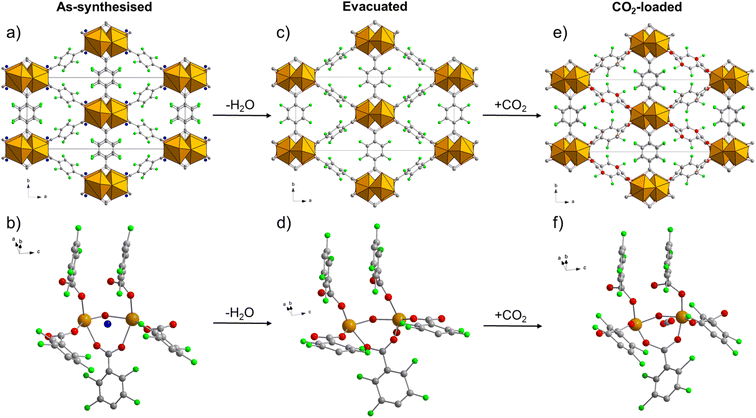
The evacuated F4_MIL-140A(Ce) was then held at a constant temperature of 328 K and exposed to increasing CO2 pressures in the 0.055–1.485 bar range. As displayed in Fig. S30,† a phase transition occurs between 0.367 and 0.745 bar, corresponding to the pressure range where the CO2 adsorption isotherm collected at the same temperature displays the step (Fig. S31†). Upon reduction of the pressure from 1.485 down to 0.322 bar, the reverse transition takes place, regenerating the evacuated form of the MOF (Fig. S32†). An analogous, reversible phase transition is observed between 0.222 and 0.527 bar at 313 K, and between 0.833 and 1.490 bar at 343 K, in both cases in excellent agreement with the step position in the corresponding CO2 adsorption isotherms (Fig. S33–S36†). The PXRD pattern of the CO2-loaded MOF is consistent at the three temperatures, suggesting that the equilibrium structure is the same in the investigated temperature range (Fig. S37†). We also performed an isobaric experiment exposing the MOF to a constant pressure of 0.498 bar and decreasing the temperature from 343 to 313 K in 5 K steps (Fig. S38†). The MOF switches from the evacuated to the CO2-loaded form between 328 and 323 K, again in excellent agreement with what expected from the adsorption isotherms measured at different temperatures (Fig. S39†). Again, the unit cell parameters are only slightly affected by the phase transition, with the β angle decreasing from 103.99(2)° in the evacuated MOF to 97.68(1)° in the CO2-loaded one (Table S4†). This trend is also in agreement with what suggested by DFT optimisation (Table S3†). For the sake of Rietveld refinement of the CO2-loaded MOF, a structural model with CO2 adsorbed at the “Ce” site was adopted as the most probable guess, based on the DFT results previously discussed. Rietveld refinement was carried out on the PXRD pattern for the CO2-loaded MOF at 313 K, finding that the insertion of CO2 triggers rotation of linker A to a position similar to that observed for the as-synthesised MOF (Table S5,†Fig. 5e–f and S41). The CO2 molecule displays coordination-like interaction with two Ce atoms, via one of its electron-rich O atoms, besides additional interactions with three F atoms (belonging to both linkers A and B) and with two coordinated carboxylic O atoms, via the electron-poor C atom (Fig. S42†). Thus, CO2 appears to be adsorbed in a pocket where it is stabilised by a wealth of non-covalent interactions, akin to what seen for H2O in the as-synthesised MOF. The step observed in the CO2 adsorption isotherm most likely arises from the concerted rotation of perfluorinated aromatic rings upon the insertion of CO2 in such an adsorption site, once the activation barrier for ring rotation is overcome and the site is made accessible. Further support to this interpretation is provided herein by means of other characterisation techniques.
Comparing the three forms of F4_MIL-140A(Ce), it is evident that the as-synthesised and the CO2-loaded ones have common features, ascribable to the presence of the adsorbate, which are not shared by the evacuated form. By examining the torsional angles between the carboxylate groups and the aromatic rings for each linker in the different forms of the MOF (Table S5†), it can be seen that O2–C1–C2–C3 (linker A) and O5–C10–C9–C8 (linker B) torsional angles significantly change when adsorbates are present, by bringing the aromatic rings more out-of-plane respect to the carboxylates, as a result of interactions with the adsorbate. The third torsional angle, O4–C5–C6–C7 belonging to linker B, is instead only slightly affected, because of the lack of interactions with the adsorbates on that side of the linker (Fig. S43†).
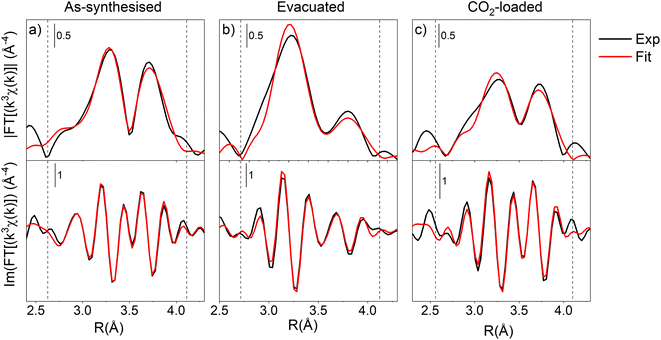
Ce–Ce paths, whose refinement was compulsory because their distances fall very close to the Ce-adsorbates ones, gave values in excellent agreement with the ones observed by PXRD. The Ce-adsorbate distance for the as-synthesised material (Ce–Ow) was refined at 3.368(3) Å, whereas the Ce–CCO2 distances for the CO2-loaded one were fitted respectively to 4.06(3) Å and 4.44(4) Å. Such values are in agreement with those refined from PXRD data through Rietveld method (2.89 and 3.62 for Ce–Ow; 4.04 and 4.44 for Ce–CCO2) and from DFT optimisation (2.63 and 3.13 for Ce–Ow; 3.93 and 4.20 for Ce–CCO2), thus strengthening their reliability and consistency.
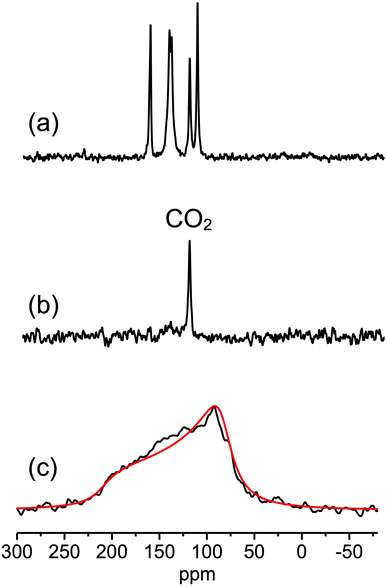
The 1H direct excitation (DE) static spectrum of as-synthesised F4_MIL-140A(Ce) indicates the presence of both weakly physisorbed and structural water, which is completely removed after heating under vacuum, as shown by the absence of any signal in the spectrum of evacuated F4_MIL-140A(Ce) (Fig. S47†). The 13C DE spectrum of CO2-loaded F4_MIL-140A(Ce) (Fig. 7a), recorded under magic angle spinning (MAS) at a rate of 15 kHz and with a recycle delay between subsequent scans (150 s) sufficient to quantitatively observe the signals of MOF and CO2 carbons, indicates that almost one CO2 molecule (signal at 124.7 ppm) per Ce atom was adsorbed in the MOF when loaded at a CO2 pressure of 1 bar. When the 13C DE-MAS spectrum is acquired with a short recycle delay of 2 s, the sole signal of CO2 is selectively observed (Fig. 7b), since the 13C longitudinal relaxation time of CO2 carbons is much shorter than those of the linker carbons, in agreement with ref. 43. The 13C DE static spectrum recorded with the short recycle delay shows a powder pattern with a line shape arising from the anisotropic 13C chemical shift (CS) interaction averaged by CO2 dynamics (Fig. 7c), as found in other MOFs.44 The observed residual chemical shift anisotropy (CSA) indicates that CO2 reorientation in F4_MIL-140A(Ce) is not isotropic, the CO2 mobility being restricted by the interactions with the MOF linkers and Ce atoms and/or by steric hindrance in the pores. Generally, the CS interaction can be described with a second rank tensor with three principal components δ11, δ22, and δ33, with δ11 ≥ δ22 ≥ δ33 (“Mehring notation”). Three parameters are sufficient to describe the tensor: following the “Maryland notation”, they are the isotropic chemical shift [δiso = (δ11 + δ22 + δ33)/3], the span (Ω = δ11 − δ33), and the skew [κ = 3(δ22 − δiso)/Ω].45 The span measures the breadth of the observed powder pattern and is used to indicate the extent of the CSA, while the skew, ranging from −1 to 1, gives an indication of the symmetry of the CS tensor, the two limit values of κ corresponding to an axial symmetry. For CO2 in the solid state, an axial CS tensor is reported in the literature, with Ω = 315−335 ppm and κ = 1.46,47 The signal observed for CO2 adsorbed on F4_MIL-140A(Ce) is instead characterised by Ω ≃ 127 ppm and κ = −0.98. The span reduction with respect to fully immobilised CO2 indicates that a motion with a rate higher than the spectral broadness in frequency units occurs for CO2 in F4_MIL-140A(Ce) at room temperature. Wobbling on an individual adsorption site and hopping among symmetry equivalent adsorption sites have been found for CO2 in other MOFs by 13C SSNMR spectroscopy.48–53 In our case, the negative value of κ suggests that a wobbling or hopping motion occurs with an angle (β) between the C∞ symmetry axis of CO2 and the motion axis larger than the magic angle (54.74°),53 while the axial line shape indicates a 3-fold or higher symmetry for the motion, which should occur in the fast regime. A satisfactory simulation of the spectral line shape (Fig. 7c) could indeed be obtained with a wobbling in a cone motion among 3 (or more) equivalent sites in the fast regime with β = 75°. It must be pointed out that this motion could be associated either to a reorientation of CO2 about a local axis or to the hopping of CO2 molecules among equivalent adsorption sites, also in combination with translation. The occurrence of both wobbling and hopping motions cannot be excluded. Further variable temperature 13C SSNMR static experiments on F4_MIL-140A(Ce) loaded with 13C isotopically enriched CO2 and line shape analyses are necessary to characterise CO2 dynamics in more detail.
19F DE and 19F–13C cross polarization (CP) experiments were also recorded under MAS on all samples to highlight possible effects of H2O or CO2 adsorption on linkers. The spectra, showing signals from the linker fluorine and carbon atoms, respectively, are reported in Fig. S48† and 8.
19F DE-MAS spectra show broad spinning sideband patterns (Fig. S48†) due to the large chemical shift anisotropy typical of 19F nuclei.54 The 19F isotropic signals (Fig. 8a) lie in the spectral region between −150 and −135 ppm. A spectral deconvolution of the whole spinning sideband profiles showed that inequivalent fluorine atoms are present in all samples: two in the as-synthesised MOF, with isotropic chemical shifts of −143.1 and −144.8 ppm and intensities in a 3![[thin space (1/6-em)]](https://www.rsc.org/images/entities/char_2009.gif) :
:![[thin space (1/6-em)]](https://www.rsc.org/images/entities/char_2009.gif) 1 ratio; three in the evacuated MOF, with chemical shifts of −141.0, −142.0, and −143.0 ppm and intensities in a 1
1 ratio; three in the evacuated MOF, with chemical shifts of −141.0, −142.0, and −143.0 ppm and intensities in a 1![[thin space (1/6-em)]](https://www.rsc.org/images/entities/char_2009.gif) :
:![[thin space (1/6-em)]](https://www.rsc.org/images/entities/char_2009.gif) 2
2![[thin space (1/6-em)]](https://www.rsc.org/images/entities/char_2009.gif) :
:![[thin space (1/6-em)]](https://www.rsc.org/images/entities/char_2009.gif) 1 proportion; two in the CO2-loaded MOF with isotropic chemical shifts of −138.9 and −142.1 ppm and 1
1 proportion; two in the CO2-loaded MOF with isotropic chemical shifts of −138.9 and −142.1 ppm and 1![[thin space (1/6-em)]](https://www.rsc.org/images/entities/char_2009.gif) :
:![[thin space (1/6-em)]](https://www.rsc.org/images/entities/char_2009.gif) 3 relative intensities. In the 19F–13C CP-MAS spectra (Fig. 8b), the signals of fluorinated (CF), quaternary (Cq), and carboxylic (COO−) carbons of the linkers can be recognised in three distinct spectral regions. For each kind of carbon, several peaks are observed, as better appreciated after spectral deconvolution (Fig. S49†). The observed 19F and 13C multiple signals are ascribable to the two crystallographically inequivalent linkers in the structure of F4_MIL140 (Ce), namely, linker A and linker B. Analogous results were reported for MIL-140A(Zr).55 To distinguish signals arising from linkers A and B, the correlations occurring in 2D 19F–13C HETCOR spectra (Fig. S50–S52†) between signals of 13C and 19F nuclei in spatial proximity were also used. Therefore, signal assignment was possible combining the analysis of 1D 19F and 19F–13C CP-MAS spectra (recorded at different contact time values) with that of 2D 19F–13C HETCOR spectra. The results, shown in Table 2 for as-synthesised, evacuated, and CO2-loaded F4_MIL-140A(Ce), clearly indicate the presence of two different linkers with symmetry compatible with that found by the PXRD structural analysis (see Section 8 in the ESI† for a detailed description of signal assignment).
3 relative intensities. In the 19F–13C CP-MAS spectra (Fig. 8b), the signals of fluorinated (CF), quaternary (Cq), and carboxylic (COO−) carbons of the linkers can be recognised in three distinct spectral regions. For each kind of carbon, several peaks are observed, as better appreciated after spectral deconvolution (Fig. S49†). The observed 19F and 13C multiple signals are ascribable to the two crystallographically inequivalent linkers in the structure of F4_MIL140 (Ce), namely, linker A and linker B. Analogous results were reported for MIL-140A(Zr).55 To distinguish signals arising from linkers A and B, the correlations occurring in 2D 19F–13C HETCOR spectra (Fig. S50–S52†) between signals of 13C and 19F nuclei in spatial proximity were also used. Therefore, signal assignment was possible combining the analysis of 1D 19F and 19F–13C CP-MAS spectra (recorded at different contact time values) with that of 2D 19F–13C HETCOR spectra. The results, shown in Table 2 for as-synthesised, evacuated, and CO2-loaded F4_MIL-140A(Ce), clearly indicate the presence of two different linkers with symmetry compatible with that found by the PXRD structural analysis (see Section 8 in the ESI† for a detailed description of signal assignment).
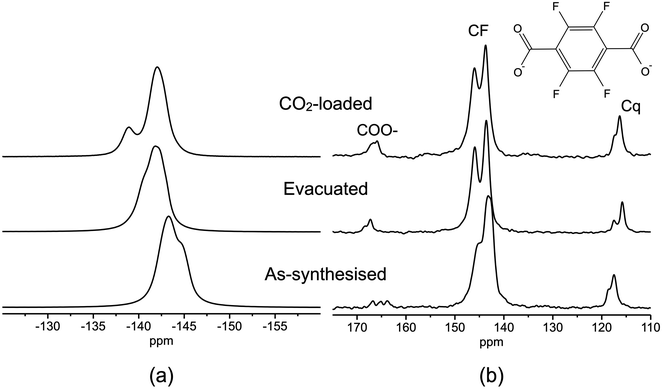 | ||
| Fig. 8 (a) 19F DE-MAS spectra and (b) 19F–13C CP-MAS spectra (ct = 1 ms) recorded on (from bottom to top) as-synthesised, evacuated, and CO2-loaded F4_MIL-140A(Ce). | ||
| Linker | Position | Atom | As-synthesised | Evacuated | CO2-loaded | |||
|---|---|---|---|---|---|---|---|---|
| δ(13C) (ppm) | δ(19F) (ppm) | δ(13C) (ppm) | δ(19F) (ppm) | δ(13C) (ppm) | δ(19F) (ppm) | |||
| A | CF | C4 | 145.3 | −143.1 | 146.0 | −142.0 | 143.6 | −142.1 |
| C3 | 145.3 | −143.1 | 146.0 | −142.0 | 145.7 | −142.1 | ||
| Cq | C2 | 117.6 | 115.8 | 116.3 | ||||
| COO− | C1 | 163.7 | 168.4 | 165.8 | ||||
| B | CF | C8 | 143.5 | −143.1 | 143.6 | −141.0 | 145.7 | −142.1 |
| C7 | 142.6 | −144.8 | 143.6 | −143.0 | 143.6 | −138.9 | ||
| Cq | C9 | 117.6 | 117.4 | 117.2 | ||||
| C6 | 118.7 | 115.8 | 116.3 | |||||
| COO− | C10 | 166.9 | 167.3 | 167.2 | ||||
| C5 | 165.2 | 167.3 | 166.5 | |||||
Interestingly, shifts of 13C and 19F signals are observed among the as-synthesised, evacuated, and CO2-loaded MOF (Fig. 8 and Table 2), ascribable to the change of local chemical environment caused by adsorption of water or CO2. For instance, the shielding of 19F nuclei could be related to the interaction between the linker fluorine atoms and the adsorbate molecules,56,57 although the rotation of the phenyl rings out of the plane of carboxylates could also play a role. For as-synthesised F4_MIL-140A(Ce), 13C signals from COO− and Cq carbons spatially close to water 1H nuclei are highlighted in the 1H–13C CP-MAS spectrum shown in Fig. S53,† since only for these carbons 1H–13C magnetisation transfer can effectively take place through dipolar coupling.
On the other hand, the signal of CO2 carbons was not observed in 19F–13C CP MAS spectra of CO2-loaded F4_MIL-140A(Ce) (Fig. 8b), even at contact time values as long as 10 ms. The distances between linker fluorines and CO2 in the Rietveld-refined structure of CO2-loaded F4_MIL-140A(Ce) (Fig. S42 and S43†) would allow sufficiently strong dipolar interactions to occur for an efficient magnetization transfer between 19F and 13C nuclei, as observed by other authors.58 The scarce CP efficiency found in our case should therefore be ascribed to a reduction of the dipolar interactions and/or of the residence time of CO2 in the adsorption site due to reorientational and translational motions.59–61
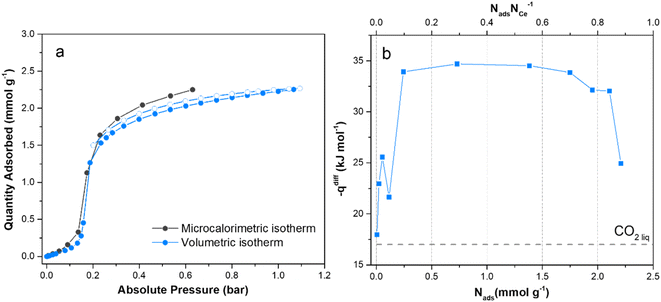
DFT also provides further insights in the description of the adsorption phenomena: the initial qdiff is closely approached by the ΔH value computed for CO2 adsorbed at the “channel” site (see Table 1). At plateau, the qdiff value is instead comparable to that computed for CO2 at the “Ce” site, though slightly lower. The peculiar energy profile revealed by adsorption microcalorimetry could be explained by a scarce initial affinity of CO2 for the surface of the adsorbent. As a matter of fact, even though the “channel” site is not the most favourable adsorption site for CO2, the adsorptive must necessarily pass through the porous system to reach the most favourable “Ce” site. Furthermore, the displacement of CO2 implies the rearrangement of the material, i.e., the concerted rotation of the perfluorobenzene rings, to enable access to the most energetic adsorption site. The occurrence of this endothermic phenomenon is clearly proved by the differential heat trend observed at the onset of the isotherm step.
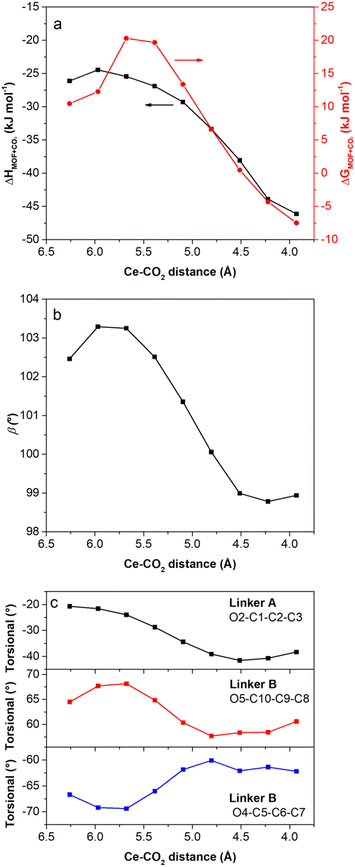
To give a quantitative description of the phenomenon, a relaxed potential energy surface scan was performed by DFT. In brief, CO2 initially modelled in the “channel” site, was stepwise approached to the “Ce” site. At each step, the whole structure was reoptimized, keeping the distance between the centre of mass of CO2 (i.e., its C atom) and Ce constant. The trends of the energetic (ΔH and ΔG) and selected structural (β cell angle, O2–C1–C2–C3 torsional angle in linker A, O5–C10–C9–C8 and O4–C5–C6–C7 torsional angles in linker B) descriptors are reported as a function of the Ce–CO2 distance in Fig. 10.
The energy trend clearly shows the existence of an activation barrier (ΔG barrier of ∼10 kJ mol−1) that the CO2 molecule must overcome to reach the most favourable “Ce” site. As the barrier is overtaken, a drastic modification in the structural features of the MOF takes place, accompanied by a progressive stabilisation of the MOF-CO2 adduct. This rearrangement implies the distortion of the unit cell through a decrease of the β cell angle, as well as the rotation of the perfluorobenzene rings, as testified by the concomitant variation of their torsional angles compared to the carboxylates. The trend from DFT simulation is in full agreement with that observed by PXRD. The key role played by the CeIV open metal site in F4_MIL-140A(Ce) also explains the lack of step observed in the CO2 isotherm of its Zr-based analogue, recently reported by Zhao and co-workers.30 Indeed, ZrIV is seven-coordinate in the MIL-140 topology, with no H2O coordinated in its as-synthesised form and, therefore, no available open metal sites for adsorbates to interact upon evacuation.
Conclusions
Through a combination of experimental and computational methods, we have produced a coherent set of evidence supporting the existence of a cooperative mechanism of CO2 adsorption in F4_MIL-140A(Ce), which involves the concerted rotation of perfluorinated aromatic rings. This phenomenon opens the gate for CO2 to reach a highly favourable adsorption site, where it is stabilised by interactions with both coordinatively unsaturated CeIV sites and the organic linkers. The step-shaped isotherm of F4_MIL-140A(Ce) resulting from this phase-change behaviour allows to reach saturation in a narrow range of partial pressure compatible with real-life post-combustion capture requirements. While several MOFs are known to display either adsorption at coordinatively unsaturated metal sites or concerted ring rotation, to the best of our knowledge the combination of these two features is observed in F4_MIL-140A(Ce) for the first time. Furthermore, the phase transition has a low activation barrier and does not involve major restructuring of the framework, resulting in a complete reversibility in desorption and leading to a non-hysteretic behaviour. Based on the knowledge acquired with this work, we expect that the CO2 adsorption behaviour of F4_MIL-140A(Ce) can be finely tuned by both varying the fluorination degree of the organic linker and preparing mixed Ce/Zr analogues, paving the way towards the development of a class of adsorbents based on the same working principle. In view of the practical application of F4_MIL-140A(Ce) in post-combustion CO2 capture, its high affinity for water could be detrimental to the capture performance, as water might preferentially adsorb over CO2. We are currently investigating this aspect using dynamic breakthrough analysis, testing both dry and humid gas mixtures.Experimental procedures
Gas adsorption volumetry
N2, Ar and CO2 isothermal physisorption measurements were performed on a Micromeritics ASAP 2020 analyser at 77 K, 87 K and 273 K, respectively. For CO2 adsorption the temperature was kept constant thanks to a home-made patented glass coating cell63 in which a coolant or heating fluid, connected to a thermostatic bath (JULABO F25), is recirculating. Prior to the measurement, the sample was heated overnight at 393 K under vacuum. Specific surface areas were determined by using the Brunauer–Emmett–Teller (BET) method, following the Rouquerol consistency criteria.64 Cumulative pore volume and pore size distribution were derived from adsorption isotherms by applying the NL-DFT method (see ESI,† Section 3, for further information).High pressure CO2 adsorption–desorption isotherms up to 5 bar were measured with a Quantachrome iSorb High Pressure Gas Analyser at 298, 313, 328 and 343 K. About 200 mg of sample was used for the adsorption studies. The sample was degassed at 393 K under dynamic vacuum for 12 h prior to analysis and at 393 K for 1 h in between subsequent measurements.
In situ IR spectroscopy
IR spectroscopy was performed on a Bruker Vertex 70 instrument equipped with a MCT (mercury cadmium tellurium) cryo-detector. All the spectra were recorded in the 4500–600 cm−1 spectral range with a resolution of 2 cm−1 and an average of 32 scans. Before the analysis, F4_MIL-140A(Ce), as self-supported pellet, was held in vacuum at 393 K for 12 h. Both CO and N2 interactions with the sample were studied by dosing a proper amount of gas (∼60 mbar) into the cell and cooling down to 77 K with liquid nitrogen. The spectra reported for both the experiments were collected in outgassing through subsequent expansions until complete desorption. H2O adsorption was carried out by sending incremental doses of H2O (from 0.1 to 20 mbar) on the evacuated F4_MIL-140A(Ce). The CO2 interaction with F4_MIL-140A(Ce) was studied by sending increasing CO2 doses on the sample after applying the same evacuation procedure previously described. The increasing doses of CO2 were chosen to be compatible with the equilibrium pressures involved in the adsorption/desorption isotherm at 313 K (40 °C) which is approximately the IR beam temperature.Periodic DFT simulations
Vibrational and energetic features of F4_MIL-140A(Ce), also in the presence of relevant adsorbates, were simulated at the DFT level of theory with the CRYSTAL17 code.65,66 In detail, the B3LYP hybrid GGA functional67,68 was exploited in conjunction with a double-ζ quality basis set (C and O from ref. 39; F from ref. 69; and Ce from ref. 70). A larger Ahlrichs TZV2p basis39 described atoms belonging to adsorbed molecules (H2O, CO2, CO and N2). Dispersive interactions were empirically included in the Hamiltonian according to the Becke-Johnson dumped version of the Grimme's D3 scheme.71,72 Such computational setup provided a satisfactory structural and electronic description of CeIV-MOFs.73In situ PXRD
The in situ PXRD study here described took place at Beamline P02.1 (PETRA III, DESY, Hamburg).74 PXRD patterns were collected using 60.0 keV (0.207124 Å) radiation. The sample was held in a 0.5 mm internal diameter glass capillary, which was mounted on a custom-built spinner device that allows for rotating a gas-filled capillary mounted on a commercial Huber goniometer head by 360° forth and back. The temperature of the sample was controlled between 298 and 413 K with an Oxford Hot-Air Blower. The beamline was equipped with a PerkinElmer XRD1621 CN3 – EHS detector (200 × 200 μm2 pixel size, 2048 × 2048 pixel area). The detector was positioned at 1000 mm from the sample stage. Each PXRD pattern was collected in the 0.0071–16.3041 °2θ range, with a 0.0067 °2θ step size and a total acquisition time of 30 s. The resulting 2D images were azimuthally integrated to 1D diffraction patterns using the software Fit2D.75In situ XAS
Ce K-edge XAS data were collected at the BM23 (ref. 76) beamline of the European Synchrotron Radiation Facility (ESRF) in Grenoble, France. The storage ring was operating in the 32-bunch mode with a target current of 150 mA. The measurements were conducted in transmission mode using a Si(311) double-crystal monochromator. The intensity of the X-ray beam was measured by means of three ion chambers (30 cm, 1 kV) placed before the sample (I0, filling 0.28 bar Kr + 1.72 bar He), after the sample (I1, filling 1.35 bar Kr + 0.65 bar He) and after the CeO2 reference sample (I2, filling 1.35 bar Kr + 0.65 bar He). This experimental setup allowed us to reference the energy to the edge of the reference sample and thus calibrate the energy for each spectrum.SSNMR spectroscopy
SSNMR spectroscopy measurements were carried out on a Bruker Avance Neo spectrometer working at Larmor frequencies of 500.13, 470.59, and 125.77 MHz for 1H, 19F, and 13C nuclei, respectively, equipped with a double-resonance cross polarization – magic angle spinning (CP-MAS) probe head accommodating rotors with an external diameter of 4 mm. MAS experiments were performed at a spinning frequency of 15 kHz. All spectra were acquired at room temperature using air as spinning gas. The chemical shift for all nuclei was referenced to the 13C signal of adamantane at 38.46 ppm. Further details on experimental settings for the acquisition of specific spectra are given in Section 8 of ESI.†Evacuated and CO2-loaded F4_MIL140A(Ce) samples for SSNMR measurements were prepared using a home-made cell provided with a mechanical lever operated from outside enabling the capping of the rotor without disturbing the cell atmosphere. For preparing the evacuated sample, the unsealed rotor containing the as-synthesised packed sample was heated overnight under vacuum (0.1 mbar) at the temperature of 423 K within the cell and then sealed under N2 atmosphere. For CO2 loading, the home-built cell containing the evacuated sample packed into the rotor was loaded with CO2 at 1 bar pressure and the rotor was sealed under the gas atmosphere.
Adsorption microcalorimetry
The molar differential heat of CO2 adsorption was evaluated on F4_MIL-140A(Ce) by means of a heat flow microcalorimeter (Calvet C80 by Setaram) connected to a high-vacuum (≈10−4 mbar) glass line equipped with a Varian Ceramicell 0–100 mbar gauge and a Leybold Ceramicell 0–1000 mbar gauge. The sample was held in vacuum at 393 K for 12 h before being placed into the calorimeter under isothermal conditions. The measurement was performed at 303 K by following a well-established step-by-step procedure described elsewhere.77Author contributions
M. C., V. C. and M. T. carried out the gas sorption experiments and data analysis. M. C., C. A. and V. C. carried out the IR and adsorption microcalorimetry experiments and data analysis. C. A., D. M. V., K. A. L. and M. T. carried out the EXAFS experiments. C. A. carried out EXAFS data analysis. M. S. performed the DFT calculations and data analysis. F. C., A. K. and M. T. carried out the PXRD experiments. M. T. carried out PXRD data analysis. L. C., F. M., A. G. and M. G. carried out the SSNMR experiments and data analysis. M. C., C. A., M. S., L. C., F. M., V. C. and M. T. drafted the manuscript. V. C. and M. T. coordinated the work. M. T. conceived the study.Conflicts of interest
There are no conflicts of interest to declare.Acknowledgements
The in situ PXRD experiments were carried out at P02.1/PETRAIII at DESY, a member of the Helmholtz Association (HGF) (Proposal I-20190224 EC). The research leading to this result has been supported by the project CALIPSOplus under the Grant Agreement 730872 from the EU Framework Programme for Research and Innovation HORIZON2020. The in situ XAS experiments were performed on beamline BM23 at the European Synchrotron Radiation Facility (ESRF), Grenoble, France. D. M. V and M. T. acknowledge the ESRF for covering the travel expenses for this beamtime. The authors acknowledge the European Union's Horizon 2020 research and innovation programme under the Marie Skłodowska-Curie grant agreement no 663830 (M.T.). The authors acknowledge the University of Pisa for funding through the Progetti di Ricerca di Ateneo scheme (PRA2020_39) (M.T.). The authors thank the Italian MUR through the Project PRIN 2020 doMino (ref. 2020P9KBKZ) (M. S., F. C., L. C., V. C, M. T.). The authors acknowledge the CINECA award under the ISCRA initiative, for the availability of high performance computing resources and support, through the IsC92 project “ULTRADS” (M.S., M. C., C. A., V. C., M. T.). The authors acknowledge Dr Alexander Schökel and Dr Sergej Wenz (Beamline P02.1 at PETRAIII, DESY) for technical assistance during the beamtime. The authors thank Prof. Silvia Bordiga (University of Torino) for facilitating this work in the early stages. The authors thank Dr Susanna Monti (ICCOM-CNR) and Dr Giovanni Barcaro (IPCF-CNR) for helpful discussion. Centro per l’Integrazione della Strumentazione Scientifica dell’Università di Pisa (CISUP) is acknowledged for the use of the Bruker Avance Neo 500 Solid State NMR Spectrometer.References
- M. Taddei and C. Petit, Mol. Syst. Des. Eng., 2021, 6, 841–875 RSC.
- P. Pullumbi, F. Brandani and S. Brandani, Curr. Opin. Chem. Eng., 2019, 24, 131–142 CrossRef.
- H. A. Patel, J. Byun and C. T. Yavuz, ChemSusChem, 2017, 10, 1303–1317 CrossRef CAS PubMed.
- M. Oschatz and M. Antonietti, Energy Environ. Sci., 2018, 11, 57–70 RSC.
- R.-B. Lin, S. Xiang, H. Xing, W. Zhou and B. Chen, Coord. Chem. Rev., 2019, 378, 87–103 CrossRef CAS.
- K. Sumida, D. L. Rogow, J. A. Mason, T. M. McDonald, E. D. Bloch, Z. R. Herm, T.-H. Bae and J. R. Long, Chem. Rev., 2012, 112, 724–781 CrossRef CAS PubMed.
- Z. Hu, Y. Wang, B. B. Shah and D. Zhao, Adv. Sustainable Syst., 2019, 3, 1800080 CrossRef.
- R. A. Maia, B. Louis, W. Gao and Q. Wang, React. Chem. Eng., 2021, 6, 1118–1133 RSC.
- H. Kajiro, A. Kondo, K. Kaneko and H. Kanoh, Int. J. Mol. Sci., 2010, 11, 3803–3845 CrossRef CAS PubMed.
- R. Vaidhyanathan, S. S. Iremonger, G. K. H. Shimizu, P. G. Boyd, S. Alavi and T. K. Woo, Science, 2010, 330, 650–653 CrossRef CAS PubMed.
- J.-B. Lin, T. T. T. Nguyen, R. Vaidhyanathan, J. Burner, J. M. Taylor, H. Durekova, F. Akhtar, R. K. Mah, O. Ghaffari-Nik, S. Marx, N. Fylstra, S. S. Iremonger, K. W. Dawson, P. Sarkar, P. Hovington, A. Rajendran, T. K. Woo and G. K. H. Shimizu, Science, 2021, 374, 1464–1469 CrossRef CAS PubMed.
- J. W. Yoon, H. Chang, S.-J. Lee, Y. K. Hwang, D.-Y. Hong, S.-K. Lee, J. S. Lee, S. Jang, T.-U. Yoon, K. Kwac, Y. Jung, R. S. Pillai, F. Faucher, A. Vimont, M. Daturi, G. Férey, C. Serre, G. Maurin, Y.-S. Bae and J.-S. Chang, Nat. Mater., 2017, 16, 526–531 CrossRef CAS PubMed.
- L. J. Murray, M. Dinca, J. Yano, S. Chavan, S. Bordiga, C. M. Brown and J. R. Long, J. Am. Chem. Soc., 2010, 132, 7856–7857 CrossRef CAS PubMed.
- E. D. Bloch, L. J. Murray, W. L. Queen, S. Chavan, S. N. Maximoff, J. P. Bigi, R. Krishna, V. K. Peterson, F. Grandjean, G. J. Long, B. Smit, S. Bordiga, C. M. Brown and J. R. Long, J. Am. Chem. Soc., 2011, 133, 14814–14822 CrossRef CAS PubMed.
- D. E. Jaramillo, D. A. Reed, H. Z. H. Jiang, J. Oktawiec, M. W. Mara, A. C. Forse, D. J. Lussier, R. A. Murphy, M. Cunningham, V. Colombo, D. K. Shuh, J. A. Reimer and J. R. Long, Nat. Mater., 2020, 19, 517–521 CrossRef CAS PubMed.
- B.-Q. Song, Q.-Y. Yang, S.-Q. Wang, M. Vandichel, A. Kumar, C. Crowley, N. Kumar, C.-H. Deng, V. GasconPerez, M. Lusi, H. Wu, W. Zhou and M. J. Zaworotko, J. Am. Chem. Soc., 2020, 142, 6896–6901 CrossRef CAS PubMed.
- M. Hefti, L. Joss, Z. Bjelobrk and M. Mazzotti, Faraday Discuss., 2016, 192, 153–179 RSC.
- T. M. McDonald, J. A. Mason, X. Kong, E. D. Bloch, D. Gygi, A. Dani, V. Crocellà, F. Giordanino, S. O. Odoh, W. S. Drisdell, B. Vlaisavljevich, A. L. Dzubak, R. Poloni, S. K. Schnell, N. Planas, K. Lee, T. Pascal, L. F. Wan, D. Prendergast, J. B. Neaton, B. Smit, J. B. Kortright, L. Gagliardi, S. Bordiga, J. A. Reimer and J. R. Long, Nature, 2015, 519, 303–308 CrossRef CAS PubMed.
- C. Serre, F. Millange, C. Thouvenot, M. Noguès, G. Marsolier, D. Louër and G. Férey, J. Am. Chem. Soc., 2002, 124, 13519–13526 CrossRef CAS PubMed.
- H. J. Choi, M. Dincă and J. R. Long, J. Am. Chem. Soc., 2008, 130, 7848–7850 CrossRef CAS PubMed.
- S. Henke, D. C. Florian Wieland, M. Meilikhov, M. Paulus, C. Sternemann, K. Yusenko and R. A. Fischer, CrystEngComm, 2011, 13, 6399–6404 RSC.
- D. A. Reed, B. K. Keitz, J. Oktawiec, J. A. Mason, T. Runčevski, D. J. Xiao, L. E. Darago, V. Crocellà, S. Bordiga and J. R. Long, Nature, 2017, 550, 96–100 CrossRef CAS PubMed.
- T. M. McDonald, W. R. Lee, J. A. Mason, B. M. Wiers, C. S. Hong and J. R. Long, J. Am. Chem. Soc., 2012, 134, 7056–7065 CrossRef CAS PubMed.
- R. L. Siegelman, T. M. McDonald, M. I. Gonzalez, J. D. Martell, P. J. Milner, J. A. Mason, A. H. Berger, A. S. Bhown and J. R. Long, J. Am. Chem. Soc., 2017, 139, 10526–10538 CrossRef CAS PubMed.
- P. L. Llewellyn, M. Garcia-Rates, L. Gaberová, S. R. Miller, T. Devic, J.-C. Lavalley, S. Bourrelly, E. Bloch, Y. Filinchuk, P. A. Wright, C. Serre, A. Vimont and G. Maurin, J. Phys. Chem. C, 2015, 119, 4208–4216 CrossRef CAS.
- D. Fairen-Jimenez, S. A. Moggach, M. T. Wharmby, P. A. Wright, S. Parsons and T. Düren, J. Am. Chem. Soc., 2011, 133, 8900–8902 CrossRef CAS PubMed.
- S. K. Elsaidi, M. H. Mohamed, C. M. Simon, E. Braun, T. Pham, K. A. Forrest, W. Xu, D. Banerjee, B. Space, M. J. Zaworotko and P. K. Thallapally, Chem. Sci., 2017, 8, 2373–2380 RSC.
- R. D'Amato, A. Donnadio, M. Carta, C. Sangregorio, D. Tiana, R. Vivani, M. Taddei and F. Costantino, ACS Sustainable Chem. Eng., 2019, 7, 394–402 CrossRef.
- V. Guillerm, F. Ragon, M. Dan-Hardi, T. Devic, M. Vishnuvarthan, B. Campo, A. Vimont, G. Clet, Q. Yang, G. Maurin, G. Férey, A. Vittadini, S. Gross and C. Serre, Angew. Chem., Int. Ed., 2012, 51, 9267–9271 CrossRef CAS PubMed.
- Z. Zhang, S. B. Peh, R. Krishna, C. Kang, K. Chai, Y. Wang, D. Shi and D. Zhao, Angew. Chem., Int. Ed., 2021, 60, 17198–17204 CrossRef CAS PubMed.
- S. J. I. Shearan, J. Jacobsen, F. Costantino, R. D'Amato, D. Novikov, N. Stock, E. Andreoli and M. Taddei, Chem. - Eur. J., 2021, 27, 6579–6592 CrossRef CAS PubMed.
- P. Nugent, Y. Belmabkhout, S. D. Burd, A. J. Cairns, R. Luebke, K. Forrest, T. Pham, S. Ma, B. Space, L. Wojtas, M. Eddaoudi and M. J. Zaworotko, Nature, 2013, 495, 80–84 CrossRef CAS PubMed.
- K. A. Forrest, T. Pham, S. K. Elsaidi, M. H. Mohamed, P. K. Thallapally, M. J. Zaworotko and B. Space, Cryst. Growth Des., 2019, 19, 3732–3743 CrossRef CAS.
- J. Perego, C. X. Bezuidenhout, A. Pedrini, S. Bracco, M. Negroni, A. Comotti and P. Sozzani, J. Mater. Chem. A, 2020, 8, 11406–11413 RSC.
- M. Thommes, K. Kaneko, A. V. Neimark, J. P. Olivier, F. Rodriguez-Reinoso, J. Rouquerol and K. S. W. Sing, Pure Appl. Chem., 2015, 87, 1051–1069 CrossRef CAS.
- T. Islamoglu, K. B. Idrees, F. A. Son, Z. Chen, S.-J. Lee, P. Li and O. K. Farha, J. Mater. Chem. A, 2022, 10, 157–173 RSC.
- C. Atzori, K. A. Lomachenko, J. Jacobsen, N. Stock, A. Damin, F. Bonino and S. Bordiga, Dalton Trans., 2020, 49, 5794–5797 RSC.
- J. Ethiraj, F. Bonino, J. G. Vitillo, K. A. Lomachenko, C. Lamberti, H. Reinsch, K. P. Lillerud and S. Bordiga, ChemSusChem, 2016, 9, 713–719 CrossRef CAS PubMed.
- L. Valenzano, B. Civalleri, S. Chavan, S. Bordiga, M. H. Nilsen, S. Jakobsen, K. P. Lillerud and C. Lamberti, Chem. Mater., 2011, 23, 1700–1718 CrossRef CAS.
- N. Masciocchi, S. Galli, V. Colombo, A. Maspero, G. Palmisano, B. Seyyedi, C. Lamberti and S. Bordiga, J. Am. Chem. Soc., 2010, 132, 7902–7904 CrossRef CAS PubMed.
- K. A. Lomachenko, J. Jacobsen, A. L. Bugaev, C. Atzori, F. Bonino, S. Bordiga, N. Stock and C. Lamberti, J. Am. Chem. Soc., 2018, 140, 17379–17383 CrossRef CAS PubMed.
- C. Atzori, K. A. Lomachenko, S. Øien-ØDegaard, C. Lamberti, N. Stock, C. Barolo and F. Bonino, Cryst. Growth Des., 2019, 19, 787–796 CrossRef CAS.
- X. Kong, E. Scott, W. Ding, J. A. Mason, J. R. Long and J. A. Reimer, J. Am. Chem. Soc., 2012, 134, 14341–14344 CrossRef CAS PubMed.
- V. J. Witherspoon, J. Xu and J. A. Reimer, Chem. Rev., 2018, 118, 10033–10048 CrossRef CAS PubMed.
- R. K. Harris, E. D. Becker, S. M. Cabral de Menezes, P. Granger, R. E. Hoffman and K. W. Zilm, Magn. Reson. Chem., 2008, 80, 59–84 CAS.
- A. J. Beeler, A. M. Orendt, D. M. Grant, P. W. Cutts, J. Michl, K. W. Zilm, J. W. Downing, J. C. Facelli, M. S. Schindler and W. Kutzelnigg, J. Am. Chem. Soc., 1984, 106, 7672–7676 CrossRef CAS.
- C. R. Bowers, H. W. Long, T. Pietrass, H. C. Gaede and A. Pines, Chem. Phys. Lett., 1993, 205, 168–170 CrossRef CAS.
- W. D. Wang, B. E. G. Lucier, V. V. Terskikh, W. Wang and Y. Huang, J. Phys. Chem. Lett., 2014, 5, 3360–3365 CrossRef CAS PubMed.
- S. Chen, B. E. G. Lucier, P. D. Boyle and Y. Huang, Chem. Mater., 2016, 28, 5829–5846 CrossRef CAS.
- Y. Zhang, B. E. G. Lucier and Y. Huang, Phys. Chem. Chem. Phys., 2016, 18, 8327–8341 RSC.
- R. M. Marti, J. D. Howe, C. R. Morelock, M. S. Conradi, K. S. Walton, D. S. Sholl and S. E. Hayes, J. Phys. Chem. C, 2017, 121, 25778–25787 CrossRef CAS.
- B. Wu, Y. T. A. Wong, B. E. G. Lucier, P. D. Boyle and Y. Huang, ACS Omega, 2019, 4, 4000–4011 CrossRef CAS PubMed.
- M. Inukai, T. Kurihara, Y. Noda, W. Jiang, K. Takegoshi, N. Ogiwara, H. Kitagawa and K. Nakamura, Phys. Chem. Chem. Phys., 2020, 22, 14465–14470 RSC.
- F. Martini, H. K. Miah, D. Iuga, M. Geppi and J. J. Titman, J. Magn. Reson., 2015, 259, 102–107 CrossRef CAS PubMed.
- C. Vieira Soares, D. Damasceno Borges, A. Wiersum, C. Martineau, F. Nouar, P. L. Llewellyn, N. A. Ramsahye, C. Serre, G. Maurin and A. A. Leitão, J. Phys. Chem. C, 2016, 120, 7192–7200 CrossRef CAS.
- C. Dalvit and A. Vulpetti, ChemMedChem, 2012, 7, 262–272 CrossRef CAS PubMed.
- C. Dalvit, C. Invernizzi and A. Vulpetti, Chem. – Eur. J., 2014, 20, 11058–11068 CrossRef CAS PubMed.
- B. E. Desveaux, Y. T. A. Wong, B. E. G. Lucier, V. V. Terskikh, P. D. Boyle, S. Jiang and Y. Huang, J. Phys. Chem. C, 2019, 123, 17798–17807 CrossRef CAS.
- S. Bracco, T. Miyano, M. Negroni, I. Bassanetti, L. Marchio’, P. Sozzani, N. Tohnai and A. Comotti, Chem. Commun., 2017, 53, 7776–7779 RSC.
- G. Xing, I. Bassanetti, S. Bracco, M. Negroni, C. Bezuidenhout, T. Ben, P. Sozzani and A. Comotti, Chem. Sci., 2019, 10, 730–736 RSC.
- T. Kurihara, M. Inukai and M. Mizuno, J. Phys. Chem. Lett., 2022, 13, 7023–7028 CrossRef CAS PubMed.
- P. L. Llewellyn and G. Maurin, C. R. Chim., 2005, 8, 283–302 CrossRef CAS.
- V. Crocellà, C. Atzori, G. Latini and M. Signorile, A Kit for Volumetric Measurements of Gas Adsorption, WO Pat., 2021181211A1, 2021 Search PubMed.
- J. Rouquerol, P. Llewellyn and F. Rouquerol, in Studies in Surface Science and Catalysis, ed. P. L. Llewellyn, F. Rodriquez-Reinoso, J. Rouqerol and N. Seaton, Elsevier, 2007, vol. 160, pp. 49–56 Search PubMed.
- A. Erba, J. Baima, I. Bush, R. Orlando and R. Dovesi, J. Chem. Theory Comput., 2017, 13, 5019–5027 CrossRef CAS PubMed.
- CRYSTAL17 manual, https://www.crystal.unito.it/Manuals/crystal17.pdf, (accessed September 2021).
- A. D. Becke, J. Chem. Phys., 1993, 98, 1372–1377 CrossRef CAS.
- C. Lee, W. Yang and R. G. Parr, Phys. Rev. B: Condens. Matter Mater. Phys., 1988, 37, 785–789 CrossRef CAS PubMed.
- R. Nada, C. R. A. Catlow, C. Pisani and R. Orlando, Modell. Simul. Mater. Sci. Eng., 1993, 1, 165–187 CrossRef CAS.
- J. Graciani, A. M. Márquez, J. J. Plata, Y. Ortega, N. C. Hernández, A. Meyer, C. M. Zicovich-Wilson and J. F. Sanz, J. Chem. Theory Comput., 2011, 7, 56–65 CrossRef CAS PubMed.
- S. Grimme, J. Antony, S. Ehrlich and H. Krieg, J. Chem. Phys., 2010, 132, 154104 CrossRef PubMed.
- S. Grimme, S. Ehrlich and L. Goerigk, J. Comput. Chem., 2011, 32, 1456–1465 CrossRef CAS PubMed.
- A. Airi, C. Atzori, F. Bonino, A. Damin, S. Øien-Ødegaard, E. Aunan and S. Bordiga, Dalton Trans., 2020, 49, 12–16 RSC.
- A.-C. Dippel, H.-P. Liermann, J. T. Delitz, P. Walter, H. Schulte-Schrepping, O. H. Seeck and H. Franz, J. Synchrotron Radiat., 2015, 22, 675–687 CrossRef CAS PubMed.
- A. P. Hammersley, J. Appl. Crystallogr., 2016, 49, 646–652 CrossRef CAS.
- O. Mathon, A. Beteva, J. Borrel, D. Bugnazet, S. Gatla, R. Hino, I. Kantor, T. Mairs, M. Munoz, S. Pasternak, F. Perrin and S. Pascarelli, J. Synchrotron Radiat., 2015, 22, 1548–1554 CrossRef CAS PubMed.
- C. Atzori, N. G. Porcaro, V. Crocellà, F. Bonino, M. Signorile, P. Antico, C. Daniel, V. Venditto, C. A. Grande and S. Bordiga, Microporous Mesoporous Mater., 2022, 341, 112106 CrossRef CAS.
Footnotes |
| † Electronic supplementary information (ESI) available. CCDC 2212834 and 2212835. For ESI and crystallographic data in CIF or other electronic format see DOI: https://doi.org/10.1039/d2ta09746j |
| ‡ Present address: Anorganische Materialchemie, Fakultät für Chemie & Chemische Biologie, Technische Universität Dortmund, Otto-Hahn-Straße 6, 44227 Dortmund, Germany. |
| This journal is © The Royal Society of Chemistry 2023 |

