 Open Access Article
Creative Commons Attribution 3.0 Unported Licence
High oxygen-vacancy diffusivity predicted for perovskite oxide Ca0.5Sr0.5Co0.8Fe0.2O2.5†
Alexander
Bonkowski
 ,
Caitlin
Perkampus
 and
Roger A.
De Souza
 *
*
Institute for Physical Chemistry, RWTH Aachen University, 52074 Aachen, Germany. E-mail: desouza@pc.rwth-aachen.de; Fax: +49 241 80 92128; Tel: +49 241 80 94739
First published on 11th May 2023
Abstract
The perovskite-type oxide Ba0.5Sr0.5Co0.8Fe0.2O3−δ is a superlative mixed ionic–electronic conductor but has low chemical stability that severely limits its use. Using molecular dynamics simulations, we predict that substituting Ba with Ca yields a material, Ca0.5Sr0.5Co0.8Fe0.2O3−δ, that in its cubic form exhibits similarly high oxygen-vacancy diffusivity.
In various senses, the perovskite-type oxide Ba0.5Sr0.5Co0.8Fe0.2O3−δ (BSCF5582) is a material at the limits. On the one hand, it shows exceptionally high rates of oxygen diffusion and oxygen surface exchange, and thus outstanding performance as an oxygen permeation membrane1,2 and as a solid oxide fuel cell cathode.3,4 It also exhibits the highest oxygen nonstoichiometry δ observed to date within the family of cubic ABO3−δ perovskite-type oxides (δ < 0.8);5,6 and in contrast to the related material SrCo0.8Fe0.2O3−δ, it does this without forming (at δ = 0.5) an A2B2O5 brownmillerite-type phase.7 On the other hand, BSCF5582 displays very limited thermodynamic stability,8–11 decomposing at temperatures below 1173 K into a 2H hexagonal (Ba,Sr)CoO3−δ perovskite phase (with face-sharing octahedra) and a Ba- and Co-deficient cubic perovskite phase (with corner-sharing octahedra).9 Although the kinetics of the decomposition become sluggish on the timescale of hours at temperatures below 800 K,6 a preferable approach, especially for material stability in operational devices on the timescale of years, would be to find an acceptable alternative. BSCF5582 also deteriorates rapidly in the presence of even small amounts of CO2, and a higher chemical stability in this respect would also be welcome.12–14
The relative stability of ABO3 perovskite structures can be interpreted in a simple manner in terms of the Goldschmidt tolerance factor,15
In a recent simulation study,19 we discovered that oxygen-vacancy diffusion in orthorhombic CaTiO3 (tG = 0.964) is faster than in cubic SrTiO3 (tG = 1). This result suggests that, contrary to common expectations, the Ca analogue of BSCF5582, i.e. Ca0.5Sr0.5Co0.8Fe0.2O3−δ (CSCF5582), may display high rates of oxygen-vacancy diffusion, even in a distorted perovskite symmetry. In this study we employed MD simulations with empirical pair potentials to obtain the oxygen-vacancy diffusivity in CSCF5582 (and for comparison, also that in BSCF5582). We used robust, well-established pair potentials (see ESI†) that were previously used to study oxygen diffusion in BSCF5582 (ref. 20 and 21) and CaTiO3.22,23 Our results indicate that CSCF5582 is a suitable substitute for BSCF5582 in terms of oxygen-vacancy transport and thus it is worthy of experimental investigation.
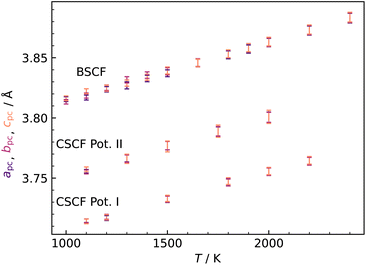
In investigating CSCF5582, the first major question is the lattice symmetry. We started off in orthorhombic symmetry (space group Pnma) and found that, according to simulations in the isobaric–isothermal ensemble (NpT), the cell is cubic above T = 1100 K for the two different Ca2+–O2− empirical pair potentials22,23 (Fig. 1). The predicted transition temperature should be regarded with caution for two reasons. First, simulation cells did not appear to reach equilibrium at lower temperatures; and second, MD simulations on other low-symmetry perovskite systems19,24 considerably overestimate phase transition temperatures to the cubic form. If the temperature is also overestimated for CSCF5582, the material may well show cubic symmetry at much lower temperatures, i.e. those of interest for application as an SOFC cathode or as an oxygen permeation membrane. It is not inconceivable, though, that the transition temperature is underestimated in our simulations. Regardless of whether over- or underestimated, this result is advantageous because it allows us to examine oxygen tracer diffusion in cubic CSCF5582, and to compare its behaviour with that of cubic BSCF5582.
To study the oxygen transport properties of the materials, simulation cells containing 40![[thin space (1/6-em)]](https://www.rsc.org/images/entities/char_2009.gif) 000 ions with random distributions of cations and oxygen vacancies were first subjected to an equilibration period teq,1 ≥ 1.0 ns (longer runs were necessary for low temperatures) in the isobaric–isothermal ensemble (NpT), until the cell parameters converged to constant values. Thereafter, a further equilibration in the isochoric–isothermal (NVT) ensemble was carried out (teq,2 ≥ 3.0 ns), until the energy converged to a constant value. In the production runs (NVT ensemble), the mean-squared-displacement of the oxide ions 〈ro2〉, was monitored for a period of trun ≥ 1.0 ns. The standard Einstein relation was applied to 〈ro2〉(t) in order to obtain the tracer diffusion coefficient of oxygen,
000 ions with random distributions of cations and oxygen vacancies were first subjected to an equilibration period teq,1 ≥ 1.0 ns (longer runs were necessary for low temperatures) in the isobaric–isothermal ensemble (NpT), until the cell parameters converged to constant values. Thereafter, a further equilibration in the isochoric–isothermal (NVT) ensemble was carried out (teq,2 ≥ 3.0 ns), until the energy converged to a constant value. In the production runs (NVT ensemble), the mean-squared-displacement of the oxide ions 〈ro2〉, was monitored for a period of trun ≥ 1.0 ns. The standard Einstein relation was applied to 〈ro2〉(t) in order to obtain the tracer diffusion coefficient of oxygen,
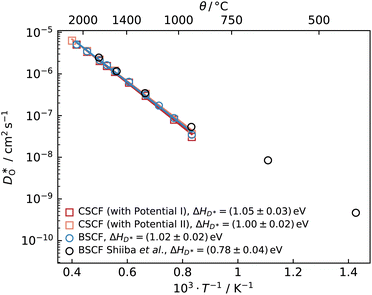
 values were calculated with the formula of Usler et al.;25 only those values with a relative error of 1% or lower are plotted in Fig. 2. We start by examining our results for the known system BSCF5582, comparing our
  values with data from Shiiba et al.21 For the temperature range for which we obtained diffusion data, we find good agreement between the two datasets, but this is not surprising, since the same set of potentials was used in both cases. Extrapolating our data to lower temperatures, we discern that the diffusion coefficients determined by Shiiba et al. at the three lowest temperatures appear to be overestimated. We attribute this overestimation to the simulation cells at these temperatures not having reached equilibrium. Shiiba et al. used equilibration times of only teq ≤ 100 ps, whereas we observed slow changes in cell energy and volume, even at T = 1173 K, on a nanosecond timescale.
 | ||
| Fig. 2 Oxygen tracer diffusion coefficients versus inverse temperature for cubic Ba0.5Sr0.5Co0.8Fe0.2O2.5 (circles) and cubic Ca0.5Sr0.5Co0.8Fe0.2O2.5 (squares), obtained from MD simulations. Also plotted are literature data from MD simulations reported by Shiiba et al.21 | ||
Since the equilibration of the oxygen sublattice is evidently the problem — oxygen ions being the only species whose distribution could change during equilibration —, we performed Metropolis Monte Carlo (MMC) simulations on the initial simulation cells, swapping oxygen ions and oxygen vacancies for each temperature of interest. Subsequent MD simulations at the respective temperatures yielded tracer diffusion coefficients similar those obtained at the end of a long equilibration run (see Fig. S1†), with comparable activation enthalpies of diffusion.
An analogous set of MD simulations was performed for CSCF5582 with both empirical pair potentials22,23 for Ca2+–O2−. Surprisingly, both sets of potentials yield similar oxygen diffusivities for cubic CSCF5582, as can be seen in Fig. 2. No data is shown for orthorhombic CSCF, since the temperatures were too low to allow reliable tracer diffusion coefficients to be obtained in accessible simulation times. Even more surprising (Fig. 2) is that there is little difference between the  values obtained for CSCF5582 and for BSCF5582.
In the remainder of the paper we consider three questions that the results of Fig. 2 raise: Are our predictions reasonable? Why is the difference in oxygen diffusion rates in BSCF5582 and CSCF5582 so small? And why does the equilibration take so much time, considering the fast oxygen diffusion rates?
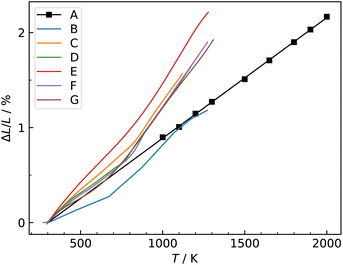
To examine the first question, we compare finite-temperature data that we obtained for BSCF5582 with experimental data. Fig. 3 is a comparison of the thermal expansion behaviour. It is important to note that our data from the MD simulations were obtained at constant non-stoichiometry δ. The experimental data can be divided into two regimes, with only the data at lower temperatures referring to constant δ. Above T ≈ 770 K, the thermal expansion is accompanied by chemical expansion, caused by an increase in δ with increasing temperature. To make a strict comparison, therefore, we need to extrapolate our data down to lower temperatures. And we find, as seen in Fig. 3, good agreement on a qualitative level.
On a quantitative level, we examine the thermal expansion coefficient
 | (1) |
From our data, we obtain 106 × (α/K−1) = 12.7 ± 0.1, which compares very well with experimental values obtained from a linear fit for the temperature range of 473 ≤ T/K ≤ 773 (where no chemical expansion is observed) of 14.9 ± 0.2,27 12.5 ± 0.1,28 17.6 ± 0.2,29 12.7 ± 0.2,30 12.0 ± 0.4,31 and 10 ± 4.32 That is, with one exception,29 there is very good agreement between simulation and experiment, providing some support for the reasonableness of our MD results.
As a further test of our MD results, we compare our data for BSCF5582 with experimental data.30,33–37 To do this, we first need to correct for the different oxygen nonstoichiometries. As noted above, we used a constant value of δ = 0.5 in the simulations, whereas experiments are generally performed at constant oxygen partial pressure, which means that the nonstoichiometry varies with temperature (and oxygen partial pressure). We used the δ(T) values obtained by Mueller et al.6 for BSCF5582 (at pO2 = 0.2 bar) to correct our  data according to:
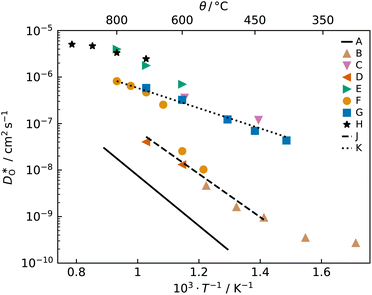
The resulting values of  , extrapolated to the experimental temperature range of 773 ≤ T/K ≤ 1123, are compared with experimental data in Fig. 4. Dataset D34 was obtained from DO data and converted according to
  , with f* = 0.69.38 Datasets E35 and H30 were obtained from Dchem data and converted according to Dchem = γODO, with γO taken from Mueller et al.6 for each temperature.
 | ||
| Fig. 4 Comparison of oxygen tracer diffusion coefficients obtained for Ba0.5Sr0.5Co0.8Fe0.2O3−δ. MD data obtained in this study were corrected for experimental nonstoichiometry (see text†). A (MD, this study), B and C,33 D,34 E,35 F,36 G,37 H.30 Line J [ΔHmig = (0.92 ± 0.11) eV] and line K (ΔHmig = (0.43 ± 0.04) eV) are fits to the two groups of data (see text†). | ||
The data appear to fall into two groups. Data from the first group (datasets B,33 D34 and F36 at lower temperatures) agree well in terms of activation enthalpy with our value, corrected for oxygen nonstoichiometry [ΔHJmig = (0.92 ± 0.11) eV] vs. [ΔHAmig = (1.07 ± 0.02) eV], while the absolute magnitude is underestimated by one order of magnitude. Given that this set of potentials was not fitted to diffusion data, the degree of agreement, and in particular, the agreement regarding the activation enthalpy, is more than satisfactory. The second group (datasets C,33 E,35 G37 and F36 at higher temperatures) agree well with one another, but are substantially higher than our results in absolute magnitude, with a much lower activation enthalpy [of ΔHKmig = (0.43 ± 0.04) eV]. Datasets E35 and H30 were excluded from the fit, in order to obtain a good description of as many data points as possible.
In their oxygen tracer diffusion studies, Berenov et al.33 obtained datasets B and C, and they concluded (i) that dataset B is the more reliable, and (ii) that dataset C was affected, possibly, by faster diffusion along pores or grain boundaries. Our MD data (dataset A) is certainly consistent with this interpretation. Nevertheless, it is unclear why dataset F36 exhibits a jump from the lower to the upper group, and why the data for the upper group fall so closely together, although the density of pores and/or grain boundaries was likely to have varied substantially between the various studies (C, E, F, G).
A previous DFT study39 yielded migration barriers of ≈0.5 eV, depending on the exact B-site environment, values that are in better agreement with dataset K. However, the calculations were carried out with rather small supercells (2 × 2 × 2 ABO3 perovskite unit cells) and with strictly alternating A-site Ba/Sr occupation, severely limiting the transferability to experimental structures.
Having established that our MD diffusion data for BSCF5582 are consistent with certain experimental studies (i.e. the  values are not physically unreasonable), we have to conclude that the predictions for CSCF5582 shown in Fig. 2 are reasonable, too, at least according to our simulations. Consequently, it is rather surprising (i) that the two sets of diffusion data for CSCF5582 are so similar and (ii) that they are so similar to those for BSCF5582. We contend that these similarities are not an artefact. The lattice parameters of the two systems are different (see Fig. 1). Ion migration is a complex many-body process, and many factors play a role in determining the rate at which it occurs. In the present case, it appears, therefore, that the various factors are combining in different ways to produce roughly the same oxygen-vacancy diffusion coefficients.
Coming to the third question—why the equilibration takes so long—we find that during the MMC calculation, both the O–O and the  coordination numbers decrease. The initial random distribution of oxygen vacancies is characterised by an average coordination number of 6.67 for O coordinated by O and 1.33 for a vacancy coordinated by a vacancy. These values decrease to 6.54 and 0.70, respectively, in MMC calculations performed at T = 1500 K. In other words, the initial random distribution leads to regions in the supercell with too many oxygen ions and regions with too many vacancies, relative to the thermodynamic equilibrium distribution. The need to get vacancies into the oxygen-rich regions, and the oxygen ions into the vacancy-rich regions is evidently what causes the long equilibration times.
In conclusion, we predict that oxygen-vacancy diffusion in cubic CSCF5582 occurs at the same rate as in cubic BSCF5582. The respective rates of oxide-ion diffusion [∝ Dvδ/(3 − δ)] are expected to be different, since the oxygen nonstoichiometry δ(T, pO2) will certainly differ between the two compounds. It does remain to be seen whether CSCF5582 adopts cubic symmetry at the temperatures of interest for fuel cells and permeation membranes, but even if this is not the case, oxygen-vacancy diffusion in orthorhombic CSCF5582 will probably19 only be slightly slower than in the cubic form with a slightly higher activation enthalpy of diffusion. The expected increased chemical stability of CSCF5582 over BSCF5582, on account of its lower Goldschmidt factor, also remains to be confirmed. Furthermore, it needs to be determined whether the increased stability is sufficient for applications.
Lastly we consider our study as drawing attention not only to a new promising mixed ionic–electronic conductor, CSCF5582, but also more generally, to other Ca-containing perovskites that may have been overlooked as possible mixed ionic-electronic conductors on account of their lower symmetry.
Author contributions
Alexander Bonkowski: methodology, formal analysis, investigation, data curation, writing – original draft preparation, writing – review and editing, visualisation. Caitlin Perkampus: formal analysis, investigation, writing – review and editing. Roger A. De Souza: conceptualisation, writing – original draft preparation, writing – review and editing, supervision, project administration, funding acquisition.Conflicts of interest
There are no conflicts to declare.Acknowledgements
Simulations were performed with computing resources granted by RWTH Aachen University under project rwth0854. This project has received funding from the European Union's Horizon 2020 research and innovation program under grant agreement no 101017709 (“Epistore”).Notes and references
- Z. Shao, W. Yang, Y. Cong, H. Dong, J. Tong and G. Xiong, J. Membr. Sci., 2000, 172, 177–188 CrossRef CAS.
- S. Baumann, J. Serra, M. Lobera, S. Escolástico, F. Schulze-Küppers and W. Meulenberg, J. Membr. Sci., 2011, 377, 198–205 CrossRef CAS.
- Z. Shao and S. M. Haile, Nature, 2004, 431, 170–173 CrossRef CAS PubMed.
- J. Zhang, S. Ricote, P. V. Hendriksen and Y. Chen, Adv. Funct. Mater., 2022, 32, 2111205 CrossRef CAS.
- S. McIntosh, J. F. Vente, W. G. Haije, D. H. A. Blank and H. J. M. Bouwmeester, Chem. Mater., 2006, 18, 2187–2193 CrossRef CAS.
- D. N. Mueller, R. A. De Souza, H.-I. Yoo and M. Martin, Chem. Mater., 2012, 24, 269–274 CrossRef CAS.
- H. Kruidhof, H. J. M. Bouwmeester, R. H. E. van Doorn and A. J. Burggraaf, Solid State Ionics, 1993, 63–65, 816–822 CrossRef CAS.
- S. Švarcová, K. Wiik, J. Tolchard, H. J. M. Bouwmeester and T. Grande, Solid State Ionics, 2008, 178, 1787–1791 CrossRef.
- D. N. Mueller, R. A. De Souza, T. E. Weirich, D. Roehrens, J. Mayer and M. Martin, Phys. Chem. Chem. Phys., 2010, 12, 10320 RSC.
- M. Kuklja, Y. Mastrikov, B. Jansang and E. Kotomin, Solid State Ionics, 2013, 230, 21–26 CrossRef CAS.
- F. Wang, T. Nakamura, K. Yashiro, J. Mizusaki and K. Amezawa, Phys. Chem. Chem. Phys., 2014, 16, 7307 RSC.
- A. Yan, V. Maragou, A. Arico, M. Cheng and P. Tsiakaras, Appl. Catal., B, 2007, 76, 320–327 CrossRef CAS.
- E. Bucher, A. Egger, G. B. Caraman and W. Sitte, J. Electrochem. Soc., 2008, 155, B1218 CrossRef CAS.
- M. Schulz, R. Kriegel and A. Kämpfer, J. Membr. Sci., 2011, 378, 10–17 CrossRef CAS.
- V. M. Goldschmidt, Naturwissenschaften, 1926, 14, 477–485 CrossRef CAS.
- R. Søndenå, S. Stølen, P. Ravindran, T. Grande and N. L. Allan, Phys. Rev. B: Condens. Matter Mater. Phys., 2007, 75, 184105 CrossRef.
- J. F. Vente, S. McIntosh, W. G. Haije and H. J. M. Bouwmeester, J. Solid State Electrochem., 2006, 10, 581–588 CrossRef CAS.
- W. Zhou, R. Ran and Z. Shao, J. Power Sources, 2009, 192, 231–246 CrossRef CAS.
- E. Robens, R. Rauschen, J. Kaub, J. P. Parras, D. Kemp, C. L. Freeman and R. A. De Souza, J. Mater. Chem. A, 2022, 10, 2388–2397 RSC.
- C. Fisher, M. Yoshiya, Y. Iwamoto, J. Ishii, M. Asanuma and K. Yabuta, Solid State Ionics, 2007, 177, 3425–3431 CrossRef CAS.
- H. Shiiba, C. L. Bishop, M. J. D. Rushton, M. Nakayama, M. Nogami, J. A. Kilner and R. W. Grimes, J. Mater. Chem. A, 2013, 1, 10345 RSC.
- G. V. Lewis and C. Catlow, J. Phys. C: Solid State Phys., 1985, 18, 1149 CrossRef CAS.
- G. Mather, M. Islam and F. Figueiredo, Adv. Funct. Mater., 2007, 17, 905–912 CrossRef CAS.
- J. M. Börgers and R. A. De Souza, Phys. Chem. Chem. Phys., 2020, 22, 14329–14339 RSC.
- A. L. Usler, D. Kemp, A. Bonkowski and R. A. De Souza, J. Comput. Chem., 2023 DOI:10.1002/jcc.27090.
- H. Wang, C. Tablet, A. Feldhoff and J. Caro, J. Membr. Sci., 2005, 262, 20–26 CrossRef CAS.
- Q. Zhu, T. Jin and Y. Wang, Solid State Ion., 2006, 177, 1199–1204 CrossRef CAS.
- B. Huang, J. Malzbender, R. Steinbrech and L. Singheiser, J. Membr. Sci., 2010, 359, 80–85 CrossRef CAS.
- R. Kriegel, R. Kircheisen and J. Töpfer, Solid State Ion., 2010, 181, 64–70 CrossRef CAS.
- M.-B. Choi, S.-Y. Jeon, H.-N. Im, E. Wachsman and S.-J. Song, J. Electrochem. Soc., 2011, 159, P23–P28 CrossRef.
- U. Pippardt, J. Böer, C. Bollert, A. Hoffmann, M. Heidenreich, R. Kriegel, M. Schulz and A. Simon, J. Ceram. Sci. Technol., 2014, 5, 309–316 Search PubMed.
- T. Itoh, S. Shirasaki, Y. Fujie, N. Kitamura, Y. Idemoto, K. Osaka, H. Ofuchi, S. Hirayama, T. Honma and I. Hirosawa, J. Alloys Compd., 2010, 491, 527–535 CrossRef CAS.
- A. Berenov, A. Atkinson, J. Kilner, M. Ananyev, V. Eremin, N. Porotnikova, A. Farlenkov, E. Kurumchin, H. Bouwmeester, E. Bucher and W. Sitte, Solid State Ionics, 2014, 268, 102–109 CrossRef CAS.
- E. Bucher, A. Egger, P. Ried, W. Sitte and P. Holtappels, Solid State Ionics, 2008, 179, 1032–1035 CrossRef CAS.
- D. Chen and Z. Shao, Int. J. Hydrogen Energy, 2011, 36, 6948–6956 CrossRef CAS.
- V. A. Eremin, M. V. Ananyev, H. J. M. Bouwmeester, E. K. Kurumchin and C.-Y. Yoo, Phys. Chem. Chem. Phys., 2020, 22, 10158–10169 RSC.
- L. Wang, R. Merkle, J. Maier, T. Acartürk and U. Starke, Appl. Phys. Lett., 2009, 94, 071908 CrossRef.
- T. Ishigaki, S. Yamauchi, K. Kishio, J. Mizusaki and K. Fueki, J. Solid State Chem., 1988, 73, 179–187 CrossRef CAS.
- E. Kotomin, Y. A. Mastrikov, M. Kuklja, R. Merkle, A. Roytburd and J. Maier, Solid State Ion., 2011, 188, 1–5 CrossRef CAS.
Footnote |
| † Electronic supplementary information (ESI) available. See DOI: https://doi.org/10.1039/d2ta09897k |
| This journal is © The Royal Society of Chemistry 2023 |


