 Open Access Article
Creative Commons Attribution 3.0 Unported Licence
Thermodynamic calculation of the ionic conductivity of LiPON glasses and solid electrolytes†
Alberto
López-Grande
,
Glenn C.
Mather
 and
Francisco
Muñoz
 *
*
Institute of Ceramics and Glass (CSIC), Kelsen 5, 28049 Madrid, Spain. E-mail: fmunoz@icv.csic.es
First published on 31st May 2023
Abstract
LiPON films are one of the most relevant solid electrolytes in Li-ion micro-batteries for low power applications, and the relationships between composition, processing parameters and ionic conductivity have challenged the materials community for the last three decades. Although films have almost exclusively been processed by deposition of Li3PO4 polycrystalline pellets, the amorphous nature of LiPON has permitted the study of compositions with glass-forming ability where the effect of improving the conductivity by nitrogen doping is similar. The aim of this work is to form a general model that allows us to calculate the ionic conductivity of LiPON solid electrolytes for whichever composition. The modelling is based on the application of the fundamental laws of chemical equilibrium to elucidate the different chemical species present for each given system composition. For this purpose, a program in the Matlab software was written, capable of solving simultaneous and competitive chemical equilibria. The method, known as the associated solutions model, was applied to the study of the Li2O–P2O5 system, which is the starting point of the present work. The model assumes that the properties of a given glass or amorphous solid, such as the simulated LiPON films, can be obtained as a function of the weighted contributions from each stable compound in the respective composition diagram. Here, Li2PO2N oxynitride is used as the main phase and, to validate the computed chemical equilibria, nitridation of crystalline Li4P2O7 has been performed by thermal ammonolysis. The combination of the calculations of chemical equilibria together with the structural characterization by XRD and NMR of the products of nitridation from Li4P2O7 allowed us to predict both the formation of Li2PO2N and the existence of a second oxynitride stoichiometric compound with formula LiPO1.5N that would be obtained by nitridation of LiPO3. The solution of the system of equilibria was made possible on development of the Gibbs free energy functions of formation of both oxynitride phases, and the calculation of the activation energy and ionic conductivity in either LiPON thin films or oxynitride glasses, offering comparable values to those found in the literature.
1. Introduction
The development of solid-state lithium-ion electrolytes has been an issue of the utmost relevance in the field of energy-storage technologies during recent decades due to the possibility of solving the safety problems related to liquid electrolytes, such as thermal and electrochemical stability, packaging (liquid leakage) and flammability.1 Among solid electrolytes in use nowadays, amorphous lithium phosphorus oxynitride (LiPON) thin films have been proven as competitive electrolyte materials for micro-power applications due to their chemical stability against the Li metallic anode and the wide electrochemical window versus Li/Li+ (0–5.5 V).2 Amorphous LiPON was firstly produced at Oak Ridge National Laboratory by radio-frequency magnetron sputtering deposition from a Li3PO4 target in a N2 atmosphere.3 The resulting compound, Li3.3PO3.9N0.17, showed an ionic conductivity (σ) of 2.2 × 10⁻⁶ S cm−1, a factor of 30 greater than that of polycrystalline Li3PO4.3 Numerous subsequent studies by other authors have corroborated the increase in conductivity and the decrease in the activation energy (Ea) of Li diffusion in LiPON thin films under variable conditions of deposition.4 However, this observed increase in conductivity on introducing nitrogen in LiPON electrolytes still remains controversial and several hypotheses have been debated.Based on previous results of oxynitride silicate glasses, Wang et al. concluded that the decrease of the electrostatic energy after substitution of P–O for P–N bonds in the amorphous phosphate network results in a decrease in the activation energy of conduction, thus increasing the ionic conductivity.5 It was postulated that since N increases the cross-linking density of the network through new –N≡ bonds with neighbouring P atoms, this may favor the formation of (unspecified) conduction pathways for Li diffusion.6–8 Actually, both types of nitrogen-to-phosphorus bonds, –N![[double bond, length as m-dash]](https://www.rsc.org/images/entities/char_e001.gif) and –N≡, are generally found in LiPON thin films, regardless of the method of deposition, and it has been proposed that conductivity is enhanced when the relative content of –N≡ is higher.9 However, recent simulations of LiPON films by Lacivita et al. indicated that films with very high lithium contents would present two types of nitrogen atoms, di-coordinated nitrogen Nd (–N
and –N≡, are generally found in LiPON thin films, regardless of the method of deposition, and it has been proposed that conductivity is enhanced when the relative content of –N≡ is higher.9 However, recent simulations of LiPON films by Lacivita et al. indicated that films with very high lithium contents would present two types of nitrogen atoms, di-coordinated nitrogen Nd (–N![[double bond, length as m-dash]](https://www.rsc.org/images/entities/char_e001.gif) ) bonded to two phosphorus, and apical nitrogen atoms or Na (–N) bonded to a single phosphorus atom,10,11 with the former Nd nitrogen originating the increase of conductivity by nitrogen in LiPON films.
) bonded to two phosphorus, and apical nitrogen atoms or Na (–N) bonded to a single phosphorus atom,10,11 with the former Nd nitrogen originating the increase of conductivity by nitrogen in LiPON films.
Due to the amorphous character of LiPON electrolytes, another approach that has been used to find a correlation between structure and conduction is through the characterization of lithium phosphorus oxynitride bulk glasses. Lithium-phosphate glasses have a glass-forming range up to nearly 60 mol% Li2O in the Li2O–P2O5 system, corresponding to a LiPON composition of Li1.5PO3.25, which is beyond the typical LiPON electrolyte compositions obtained by physical-deposition methods. Nitrogen is instead incorporated into the phosphate glasses by reacting the phosphate melt under a NH3 flow, giving rise to glasses of general composition LiaPOb−3x/2Nx, according to the substitution of 3O2− by 2N3−.12 A number of studies have been performed in recent years on the structural modification of the glass network that accompanies nitrogen incorporation and how this influences the increase of ionic conductivity.4,5,12–16 One such study indicated that the substitution of oxygen for nitrogen is intimately related to the increase of the relative content of non-bridging oxygens in the glasses. Therein, Mascaraque et al. found that the net increase attained in the conductivity for a fixed nitrogen content was lower with increasing lithium content, indicating that the original structure of the given glass composition limits the maximum effect on conductivity.15
We have recently used a new methodology for modelling the structure and conductivity of Li2O–P2O5 glasses,17 in which the thermodynamic model of associated solutions18 and the Anderson and Stuart model of ionic conductivity have been employed.19
The main objective of the present work is to extend such modelling to the study of LiPON compositions, either in the form of glasses or amorphous films. Our starting point is the Li2O–P2O5–P3N5 system, for which it is necessary to know the stable oxynitride compositions. To date, only one oxynitride with a stoichiometric composition is known, Li2PO2N, first predicted and then synthesised and characterised by Senevirathne et al.20 This oxynitride phase derives from lithium pyrophosphate Li4P2O7 and it was proposed that its structure is built up of [PO2N2] tetrahedra, grouped in the form of chains through P–N![[double bond, length as m-dash]](https://www.rsc.org/images/entities/char_e001.gif) P bonds in which all nitrogen atoms are of the Nd type.
P bonds in which all nitrogen atoms are of the Nd type.
We have thus conducted nitridation reactions by ammonolysis in Li4P2O7 and Li3PO4 to explore the stability domain of Li2PO2N and to determine whether another oxynitride phase can be obtained. Subsequently, since the model of associated solution requires the use of the Gibbs free-energy function of every compound within the composition system of interest, a theoretical derivation of the G(T) of the oxynitride compounds is presented. The work is concluded with modelling of the ionic conductivity for all compositions as a function of both the lithium and nitrogen contents, from which the value for any given oxynitride composition may be predicted.
2. Experimental and methods
2.1. Synthesis and characterization of nitrided phosphates
Lithium pyrophosphate, Li4P2O7, and orthophosphate, Li3PO4, were obtained by crystallization of their melts from batches prepared mixing reagent-grade materials Li2CO3 (99% ACS. Reagent, Aldrich) and NH4H2PO4 (99% ACS. Reagent, Merck) in stoichiometric amounts. The batches were calcined in porcelain crucibles up to 400 °C for 24 h, then melted during 2 h at 950 °C; polycrystalline pyro- and orthophosphate were obtained upon freely cooling the melts. Lithium pyrophosphate was subsequently recrystallized at 550 °C for 24 h to increase its crystallinity.Nitridation was performed by thermal ammonolysis using a constant NH3 flow of 0.5 mL min−1 on ca. 200 mg of powdered crystalline phosphates. Some samples were sieved under 63 μm to study the influence of the particle size on the reaction. The ammonolysis temperatures varied between 700 °C and 800 °C for Li4P2O7 and from 800 °C to 1100 °C for Li3PO4. Steps of heating to the reaction temperature and cooling back to room temperature were performed under a N2 flow.
Nitrogen content in the samples was determined in a nitrogen/oxygen LECO CHNS-932 elemental instrument by the inert gas fusion method.
X-ray diffraction (XRD) patterns were obtained in Bragg–Brentano geometry using a Bruker D8 Advance diffractometer (Bruker, Germany) equipped with a lynx-eye detector and a germanium monochromator providing monochromatic Cu Kα1 radiation (λ = 1.5406 Å). Diffraction data of powders were collected in the range 10 ≤ 2θ ≤ 70° using a step width of 0.02° and a step counting time of 1 s.
31P magic-angle spinning nuclear magnetic resonance (MAS-NMR) was performed in a Bruker ASX 400 spectrometer at a frequency of 161.96 MHz, using a spinning frequency of 10 kHz in 4 mm rotors. Spectra were acquired with 4 μs pulse length, and a radio-frequency (rf) strength of 60 kHz using recycle delays of up to 3000 s. Chemical-shift values were referred to (NH4)2HPO4 at 0.82 ppm with respect to H3PO4 (85%).
2.2. Estimation of Gibbs free-energy functions of oxynitride compounds
In the thermodynamic model of associated solutions, a glass can be considered as a solution formed from the glass-oxide components plus the products of their interaction. These products are the so-called salt-like groupings and it is assumed that both their stoichiometry and structure are similar to those of the crystalline compounds that exist in the given system. Thus, a glass of any composition can be represented by a superposition of various chemical groupings provided the system guarantees the minimum Gibbs energy.18 The equilibrium molar amount, n, of each salt-like product (j) and unreacted oxide (k) is obtained by solving a set of nonlinear equations composed of the mass balance and mass-action laws of each reaction (j) that takes place in the system: | (1) |
The stoichiometric coefficients are denoted by the Greek letter ν and the equilibrium constants by the letter K. The superscript 0 denotes the initial molar amount of each unreacted oxide. There are many numerical algorithms capable of efficiently approximating the solution of this system. In this work, the Matlab internal function fsolve, which computes a numerical solution of a general nonlinear system of equations, has been used. Some mathematical manipulations of equation system (1) have been performed to facilitate its solution, which are related to the difference of several orders of magnitude between the equilibrium molar amounts of each product. These manipulations have been detailed in a previous work.17
In the case of LiPON compositions, in either glass or amorphous thin-film form, Li2O, P2O5 and P3N5 were chosen as the reactants to simulate the system in chemical equilibrium. Thus, the system of reactions to be solved is composed of the reactions of formation of the three lithium phosphates, LiPO3, Li4P2O7 and Li3PO4, plus those of formation of the lithium oxynitride phosphates to be identified below.
The value of the Gibbs free-energy function of each compound is required to calculate the equilibrium constant of the corresponding formation reaction, K = exp(−G/RT). The Gibbs functions of meta, pyro and orthophosphate compounds to be used herein are the same as those employed in the solution of the system published in ref. 17; however, the G functions of the oxynitride compounds are unknown, so a method of estimation is required. Any derivation of G must involve calculation of enthalpy and entropy contributions.
The core of the present approach is the Gibbs–Helmholtz equation from which, if H(T) is known, it is possible to find the G(T) function as given below:
 | (2) |
The procedure for integration of G(T) is the following: for a small interval of T, H can be considered as a constant. Thus, by integration of eqn (2) from T1 to T2 (any two temperatures close enough to consider H as constant) the following relation is obtained:
 | (3) |
If we work with small steps of temperature, G(Ti+1) can be obtained from the previous value G(Ti), and the initial value (i = 1) corresponding to T = 298 K:
 | (4a) |
| {G(T1) = G0f = H0f − T0S0f | (4b) |
To use this procedure, the H(T) function and the S0f value of the oxynitride compounds should be estimated.
Tessier et al. studied the enthalpy of formation of oxynitride phosphate glasses and obtained a general expression for the standard formation enthalpy against the nitrogen content in oxynitride glasses by comparing the difference in bond energy with the oxidation reaction.21 The known H(T) of the corresponding phosphate composition is employed, assuming that H(T) for the oxynitride is the value of H(T) of the phosphate phase coupled with the change in the bond energies on substituting oxygen for nitrogen. Thus, herein the values of the bond energies of O–O, N–N, P–N and P–O are used, as well as the value of the enthalpies of formation of the lithium phosphate compounds from which the oxynitrides are to be obtained.
Considering the oxidation reaction of the Li2PO2N oxynitride to form Li4P2O7:
| Li2PO2N + 0.75O2 ⇒ Li2PO3.5 + 0.5N2 | (5) |
| E0ox = 0.5E0N–N + (3.5 − 2)E0P–O − E0P–N − 0.75E0O–O | (6) |
The enthalpy of formation of pyrophosphate must then be added to this enthalpy of reaction to obtain the enthalpy of formation of the oxynitride:
| H0f(LiPON) = H0f(LiPO) + (E0ox) | (7) |
This method can be generalised for any lithium and nitrogen contents through the following general oxidation reaction:
 | (8) |
 | (9) |
As seen from eqn (9), the change in H(T) does not depend on the amount of lithium present in the compound. The reaction described in eqn (8) can be generalised to any nitridation reaction from a given phosphate composition, irrespective of the type of cation X of charge n or the central atom of the oxide anion M of charge m:
 | (10) |
 | (11) |
Finally, the difference in bond energy can be calculated using the following approximation:22
Hence, the function of enthalpy against temperature can be obtained for the given oxynitride.
The standard entropy of formation employed in eqn (6) is derived using Latimer's method,23 which establishes that the entropy of a crystalline solid can be calculated by adding the contributions of the cation and the anion from which it is formed. As stated in the aforementioned article, the entropy of a solid compound is a function of the masses of the constituent atoms and of the forces acting between these atoms: the greater the mass and the lower the force, the greater the entropy.
In accordance with the above, the entropy of an ionic solid depends on the magnitude of the ionic charges. To illustrate this, Latimer calculated the contribution of the chloride ion in combination with +1, +2 and +3 ions by subtracting the entropy of the cations from the experimental salt entropy value, assuming the entropy of the cations equal to that of their corresponding elements, estimated previously.24 The agreement in entropy values of Cl− calculated for the three types of salt (Cl− plus cation +1, Cl− plus cation +2 and Cl− plus cation +3) was remarkable. A close examination of the data for a large number of anions showed that a similar loading effect existed in all cases.
Consequently, Latimer proposed to arbitrarily assign all the variation of the entropy with the charge to the negative ion and to tabulate said entropy as a function of the charge of the cation from the experimental values. The entropy of the salt is then calculated as the sum of the entropy of the monatomic cation and that of the corresponding anion.
For example, for the compound Ag2SO4 = 2Ag + SO42−, the entropies tabulated by Latimer are 12.8 cal per mol per °C for the element Ag and 22.0, 17.2, 13.7 and 12 cal per mol·per °C for SO42−, depending on whether it is attached to a cation with a +1, +2, +3 or +4 charge, respectively. In this case, the Ag+ ion has a +1 charge, thus the value of the entropy of SO42− for the calculation is 22.0 cal per mol per °C. The entropy of Ag2SO4 will therefore be S0f = (2 × 12.8 + 22.0) cal per mol per °C = 47.6 cal per mol per °C. The experimental value is 47.8 cal per mol per °C.
The problem with this method is that several measurements are needed for each type of anion to be able to tabulate the average entropy as a function of the charge of the cation. Hence, for compounds in which the entropy of their anion has not been measured, it is not possible to use this method, as is the case for the PO3− anion.
To solve this problem, it is necessary to return to the initial statement made in Latimer's article:23 “the entropy of a solid compound is a function of the masses of the constituent atoms and of the forces acting between these atoms: the greater the mass and the smaller the force, the greater the entropy”. Therefore, to estimate the entropy of the unknown anions, an attempt has been made to establish a relationship of the type S0f ∝ mass × 1/(interaction forces) from the data of known anions,23,25 which are tabulated in Table S1.† Using Latimer's method, the unknown entropy of other anions has also been calculated from entropy data of different salts.26 These entropies are tabulated in Table S2.†
To quantify the effect of mass, the molecular mass of the anion will be taken as a variable. To quantify the interaction forces, the binding energy central atom – secondary atom (P–O for PO43−, Si–F for SiF63−…) will be used. This correlation has been established in the present work for oxide anions, and it can be extrapolated to LiPON (POxNy anions) for two reasons: first, the amount of nitrogen in these compounds is very low in comparison with the amount of oxygen; second, only a rough estimate of entropy is needed to start the procedure, as will be seen in the results section. The bond energy in POxNy anions to use the entropy correlation of oxides can be estimated as
 | (12) |
The correlation between entropy, molecular weight and binding energy can be seen in Fig. S1 of the ESI† file, where experimental data for the entropy of anions have also been plotted.
The binding energy shows the highest correlation with the entropy, and the most precise expression found so far to estimate the entropy through the molecular weight (Mm) and the binding energy (Be) is the following:
 | (13) |
From the estimation of the standard entropy (eqn (13)) and the enthalpy (eqn (7) and (8)), G(T) has been calculated for the oxynitride compounds, LiPO1.5N and Li2PO2N as will be seen below, by using eqn (4). Fig. S3 to S5 of ESI† show a comparison of the calculated Gibbs free energy functions using the above method and the experimental ones, as obtained from the FactSage database, where a very good agreement can be seen. On the other hand, Fig. S6† expresses the calculated G functions for the two oxynitride phases that will be used in the calculations below.
2.3. Calculation of ionic conductivity
The ionic conductivity (σ) is calculated as a function of temperature (T) from the following Arrhenius equation, which assumes that a glass is a weak electrolyte:27 | (14) |
 . Hopping frequency has been taken from far-infrared studies of Exharhos et al. as reported earlier.17
The activation energy can be calculated through the Anderson & Stuart model as described in ref. 17. One can approximate the electrostatic contribution (binding energy) by using Coulomb's law for one ion pair with the addition of a covalence parameter γ. Anderson and Stuart justified the introduction of this parameter by claiming that, in the materials that they studied, the direct use of Coulomb's law led to excessive activation-energy values due to the fact that the electron cloud of O2− anions is rather easily deformed by the cation, lowering the binding energy.19 Coulomb's law must, therefore, be modified to take this into account as follows:
 | (15) |
Nevertheless, for a dielectric material such as glass, εr has to be considered, and eqn (15) becomes:
 | (16) |
For lithium phosphate glasses, a value of εr = 10 can be taken as an approximation.28,29 Hence, to evaluate the influence of N on the dielectric behavior of the material, a 10% increase of the dielectric constant for each 10% wt. of N added into the composition can be considered as a first approximation, considering data of dielectric constants in alkali- and alkaline-earth-containing oxynitride silicate glasses.30 The dielectric constant for Li2PO2N would thus reach a value of 11.5. It should be remarked that even if 10 is only an approximation of the dielectric constant for Li4P2O7, this may not be that relevant since what we seek is the effect on Ea and σ due to the increase of the dielectric constant while introducing N with respect to the value of the oxide composition. However, taking a value of 10 for the dielectric constant has worked well in the previous work on the calculation of ionic conductivity in lithium phosphate glasses.17 The strain-energy contribution to the activation energy can be neglected due to the small size of the Li+ cation.11
Finally, to determine n and λ for eqn (14), the molar volume (Vm) of the material is required, and can be calculated from the equation of state of the SVTD model:19
G = nigi + RTΣni![[thin space (1/6-em)]](https://www.rsc.org/images/entities/char_2009.gif) log(xi) log(xi) | (17) |
 | (18) |
 | (19) |
The filling factor typically drops in the range 0.4–0.6 for inorganic compounds, so a value of 0.5 is usually taken as an average. However, lithium phosphorus oxynitride compounds have two elements in their structure (Li and N) which contract the network, so this number is expected to be higher than usual and may be estimated from volume experimental data of the oxynitride Li2PO2N, 229.47 Å3 according to Senevirathne et al.20 Knowing Vm (ref. 20) and Mm, we can use eqn (19) to calculate the filling factor, which gives k = 0.66. Using this value as a first estimate for lithium phosphorus oxynitride compounds and eqn (19) again, we obtain Vm (LiPO1.5N) = 28.46 cm3 mol−1, which is, as expected, below the value of 34.62 cm3 mol−1 of LiPO3, the phosphate from which LiPO1.5N is formed.
3. Results and discussion
3.1. Nitrogen incorporation in lithium phosphates, Li4P2O7 and Li3PO4
Fig. 1 shows the results of the ammonolysis reactions on lithium pyrophosphate plotted as wt% N against temperature for samples without and with sieving below 63 μm (1a), reaction time (1b) and the number of consecutive reactions for temperatures between 700 °C and 800 °C, each for a reaction time of 3 h (1c).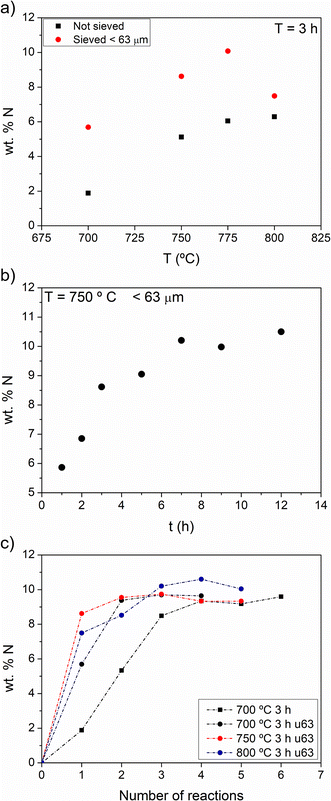 | ||
| Fig. 1 Nitrogen introduced in Li4P2O7 by thermal ammonolysis as a function of (a) temperature, (b) time of reaction and (c) number of consecutive reactions. | ||
Fig. 1a shows that particle size has a marked influence on the amount of N that can be introduced after a single treatment of 3 h, particularly below 800 °C. This strong dependence on particle size results from the solid–gas reaction, in which the available surface area of the solid reactant is a crucial variable. Furthermore, higher temperatures give rise to a higher content of nitrogen for the first 3 h of ammonolysis, while at 800 °C the effect is reversed, likely due to the faster sintering of the powdered solid that reduces the surface area in contact with NH3.
The plateau for reaction times up to 12 h at 750 °C (Fig. 1b) indicates that there is a limit to the content of nitrogen that can be reached. As in Fig. 1a, the maximum content that can be reached in these conditions is ca. 10 wt%. Fig. 1c shows the content of N analyzed in samples submitted to consecutive reactions of 3 h at 750 °C; samples were re-ground after each reaction to study the newly introduced nitrogen into de-agglomerated samples. Even if the temperature is increased to 800 °C or the number of reaction steps increases, the maximum N content in the samples lies between 10 and 11 wt%.
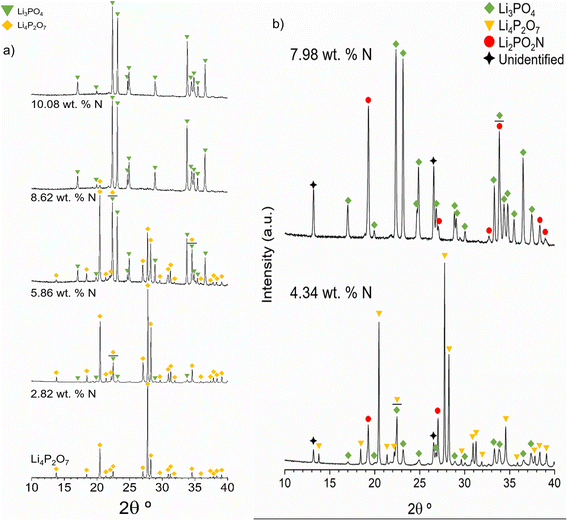
Fig. 2a shows the XRD patterns of Li4P2O7 and some of the nitrided products for increasing nitrogen contents, from bottom to top: 0 wt% N (Li4P2O7), 2.82 wt% (700 °C, 2 h), 5.86 wt% (750 °C, 3 h), 8.62 wt% (750 °C, 3 h) and 10.08 wt% (775 °C, 3 h), all submitted to a single reaction step.
The samples with 2.82 and 5.86 wt% N are mainly composed of Li4P2O7 (ICSD59243) and minor amounts of γ-Li3PO4 (ICSD79427). The presence of γ-Li3PO4 reflections increases for higher nitrogen contents while the intensities of Li4P2O7 reflections decrease. Either very minor or no presence of Li4P2O7 is observed for 8.62 and 10.08 wt% N samples, in accordance with the computational results of the chemical equilibria to be discussed later in this section. From the XRD patterns in Fig. 2a, it is concluded that only crystalline phases of Li4P2O7 and Li3PO4 are present and that nitrogen should enter into an amorphous phase.
Fig. 2b, however, exhibits the XRD patterns of the nitrided products obtained for two nitrogen contents, 4.34 and 7.98 wt%, that were submitted to ammonolysis reactions at 675 °C for 6.5 h and at 750 °C for 3 h after 3 consecutive reactions, respectively, and which reveal the crystallisation of additional phases, particularly that of Li2PO2N (ICSD188493). Some additional reflections are observed at 13.2° and 26.5°, which could not be identified with known phases in the ICSD and NIST databases. For Li2PO2N, we note that although the d-spacings of its principal peaks match those of the XRD pattern published by Senevirathne et al.20 the intensities do not match to the same extent, which may indicate some compositional variation or preferred orientation.
According to the computational results of Li2O–P2O5–P3N5 equilibria, there should not be any reflections of Li2PO2N below ∼7.3 wt% N. The Li2PO2N peaks observed in the pattern with 4.34 wt% N may arise from nitridation of the γ-Li3PO4 phase that forms on nitriding Li4P2O7, in accordance with computational results that predict the decomposition of γ-Li3PO4 into Li2PO2N and Li2O with increasing N content. We speculate that the additional unidentified reflections may be attributable to a LiPO1.5N phase predicted to form by computational results of chemical equilibria, as shown below.
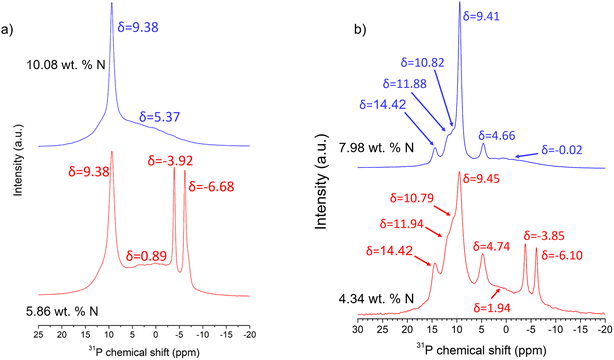
Fig. 3a shows the 31P MAS NMR spectra of two samples with nitrogen contents of 5.86 and 10.08 wt% N, as obtained by nitridation at 750 °C for 1 h and 775 °C for 3 h, respectively. The sample with 5.86 wt% N shows two very intense and narrow resonances at −3.9 and −6.2 ppm with Lorentzian profiles, which are attributable to the two crystallographic sites of phosphorus in Li4P2O7. The spectrum also shows an even more intense peak at 9.45 ppm, attributed to Li3PO4 phase detected in the XRD patterns (Fig. 2), together with a very broad resonance resembling an amorphous background that may be ascribed to the presence of phosphorus in an amorphous phase. For the second sample with ca. 10 wt% N, the broad resonance with a large chemical-shift distribution and the peak attributed to Li3PO4 again appears, but the peaks typical of Li4P2O7 are absent.
Fig. 3b shows the 31P NMR spectra of the samples with 4.34 and 7.98 wt% of nitrogen prepared with longer ammonolysis treatment in a single reaction at 675 °C for 6.5 h and for the sample after three consecutive reactions at 750 °C for 3 h each, respectively. The sample of lowest nitrogen content clearly shows the two resonances of Li4P2O7 (−3.9 and −6.1 ppm) and that of Li3PO4 (9.45 ppm); however, four more signals with Lorentzian profile are also present at 4.74, 10.79, 11.94 and 14.42 ppm, indicating the presence of further phosphorus atoms in one or more crystalline environments. The sample of nitrogen content 7.98 wt% shows the same resonances as those of the 4.34 wt% N sample, except for those of Li4P2O7. Both simulations include a broad Gaussian resonance at ca. 0 and 2 ppm arising from phosphorus in an amorphous phase that had not yet crystallised after the given reactions. Marple et al. have very recently performed ab initio calculations of the chemical-shift tensor of 31P for a number of oxynitride and nitride compounds and reported a value of 14.949 ppm for the isotropic chemical shift of 31P in Li2PO2N,34 which has a single phosphorus crystallographic site.20 Given that the calculated value of chemical shift would not be precisely the experimental one of 31P in Li2PO2N, it is reasonable to suppose that the resonance at 14.4 ppm in the NMR spectra of Fig. 3b is attributable to Li2PO2N, in agreement with the presence of reflections of Li2PO2N in the XRD pattern of the same sample (Fig. 3a). The three other resonances at ca. 4, 10 and 11 ppm may thus correspond to the unidentified crystalline phase appearing in both XRD patterns.
The crystalline phases identified by XRD and NMR for the different N contents suggest that the first reaction to consider during nitridation is the simultaneous decomposition of pyrophosphate into ortho- and metaphosphate phases, with the latter undergoing the partial substitution of oxygen for nitrogen:
| Li4P2O7 + NH3 → Li3PO4 + LiPO1.5N + 3/2H2O |
The maximum incorporation of nitrogen into the LiPO3 structure would be obtained for the stoichiometry LiPO1.5N, in which every phosphorus atom is bonded to two nitrogen atoms via P–N![[double bond, length as m-dash]](https://www.rsc.org/images/entities/char_e001.gif) P bonds, as in the structure of its homologous phase for Li/P = 2 (Li2PO2N),20 and where all tetrahedral building units are of the type [PO2N2]. This would correspond to the stoichiometry of a metaphosphate glass where the maximum nitrogen content of 18.4 wt% is attained. However, considering the decomposition of the pyrophosphate into Li3PO4 and the nitrided metaphosphate amorphous phase, the nitrogen content where the reaction stops corresponds to only 7.3 wt%. Above this, the XRD patterns do not show evidence of Li4P2O7; therefore, as the reaction still proceeds up to the maximum observed N content of ca. 10% (Fig. 1), the formation of a second oxynitride phase should be considered. This phase appears to be closely related to Li2PO2N, which is the nitrided product of Li4P2O7 for 15.4 wt% nitrogen content. In fact, if the known oxynitride Li2PO2N is considered as a new reaction product, the calculated nitrogen content that corresponds to an equimolar system composed of the sum of Li3PO4, LiPO1.5N and Li2PO2N is 9.9 wt%. This value closely approximates the maximum obtained in the nitridation experiments (Fig. 1).
P bonds, as in the structure of its homologous phase for Li/P = 2 (Li2PO2N),20 and where all tetrahedral building units are of the type [PO2N2]. This would correspond to the stoichiometry of a metaphosphate glass where the maximum nitrogen content of 18.4 wt% is attained. However, considering the decomposition of the pyrophosphate into Li3PO4 and the nitrided metaphosphate amorphous phase, the nitrogen content where the reaction stops corresponds to only 7.3 wt%. Above this, the XRD patterns do not show evidence of Li4P2O7; therefore, as the reaction still proceeds up to the maximum observed N content of ca. 10% (Fig. 1), the formation of a second oxynitride phase should be considered. This phase appears to be closely related to Li2PO2N, which is the nitrided product of Li4P2O7 for 15.4 wt% nitrogen content. In fact, if the known oxynitride Li2PO2N is considered as a new reaction product, the calculated nitrogen content that corresponds to an equimolar system composed of the sum of Li3PO4, LiPO1.5N and Li2PO2N is 9.9 wt%. This value closely approximates the maximum obtained in the nitridation experiments (Fig. 1).
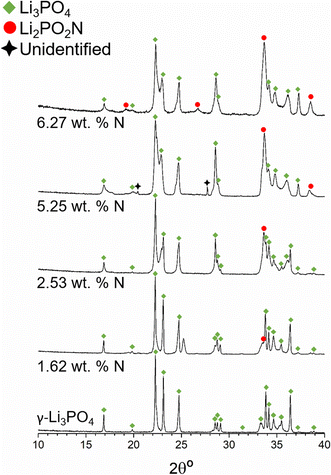
Nitridation of Li3PO4 has also been carried out to examine the formation of Li2PO2N. Fig. 4 shows the XRD patterns of a set of nitrided samples for increasing nitrogen contents, all of which exhibit reflections of Li3PO4.
For the highest nitrogen contents, reflections attributable to Li2PO2N phase are clearly visible. This suggests that Li3PO4 decomposes to Li2O and a nitrided amorphous phase from which crystallization of Li2PO2N takes place. As will be shown below from thermodynamic calculations, this oxynitride phase is consistent with the presence of Li2PO2N.
| Li3PO4 + NH3 → Li2PO2N + 1/2Li2O + 3/2H2O |
Li2O is not observed in the XRD patterns, which could be due to the very small amount formed and because Li2O can simultaneously react with water forming Li(OH) of high volatility.
3.2. Thermodynamic modelling of oxynitride systems
As discussed above, the system of compositions under consideration is Li2O–P2O5–P3N5. The reactions of formation to be considered are those that give rise to the three lithium-phosphate phases, LiPO3, Li4P2O7 and Li3PO4, which were considered in the modelling of the Li2O–P2O5 glass system,17 and the reactions that form the two oxynitride phases derived from the proposed nitridation reactions above, LiPO1.5N and Li2PO2N: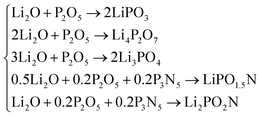 | (20) |
The system of nonlinear equations is given by the constants of equilibrium of each reaction of formation and the mass balances of each of the reacting compounds:
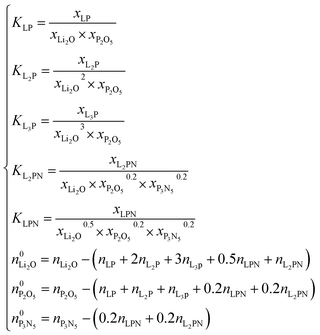 | (21) |
The system consists of 8 equations and 8 variables, each ni, given that each xi may be written as xi = ni/∑n.
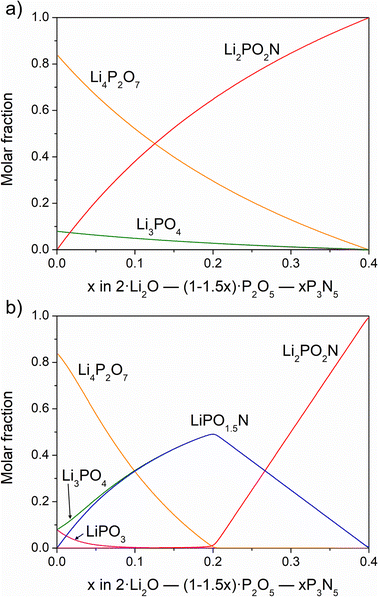
Fig. 5 shows the solution of the chemical equilibria for the reaction of nitridation of Li4P2O7 in two possible situations: (i) nitridation only produces the Li2PO2N oxynitride (Fig. 5a); (ii) nitridation results in the formation of both LiPO1.5N and Li2PO2N oxynitrides (Fig. 5b).
In the first case, a very minor amount of Li3PO4 would appear, which tends to disappear concomitantly with increasing oxynitride content during the course of the reaction; this scenario is not observed experimentally. In the second situation, the LiPO1.5N oxynitride and Li3PO4 are both formed in similar amounts up to x = 0.2, corresponding to ∼7.3 wt% N, above which point no Li4P2O7 remains. With greater N content, the concentrations of both LiPO1.5N and Li3PO4 decrease and Li2PO2N instead forms. When the nitrogen content reaches ca. 10 wt%, x = 0.27, there are, in fact, equimolar amounts of Li3PO4 and the two oxynitrides, as proposed above. Therefore, after the formation of 1 mol of Li3PO4 and LiPO1.5N from Li4P2O7, the reaction for the formation of Li2PO2N above x = 0.2 is as follows:
| 1/3Li3PO4 + 1/3LiPO1.5N + 2/3NH3 → 2/3Li2PO2N + H2O |
This reaction proceeds until x = 0.27 where Li3PO4, LiPO1.5N and Li2PO2N are in equal proportions:
| Li3PO4 + LiPO1.5N + NH3 → 2/3Li3PO4 + 2/3LiPO1.5N + 2/3Li2PO2N + 3/2H2O |
The solution of chemical equilibria confirms, therefore, that the equimolar sum of Li3PO4 and the two oxynitrides accounts for a 9.9 wt% of N, as observed in the nitridation from pyrophosphate. When the number of mols of Li3PO4 and LiPO1.5N are smaller than that of Li2PO2N formed at 9.9 wt% N, the reaction between Li3PO4 and LiPO1.5N becomes increasingly slower and the formation of further Li2PO2N much more difficult. This explains why it is not possible to increase the nitrogen content further than ∼10 to 11 wt%.
The simulations of the 31P NMR spectra of the samples with 5.86 and 10.08 wt% N in Fig. 3 were performed with the Dmfit analysis software.35 The quantification of NMR spectra of Fig. 3a gives orthophosphate and amorphous phase, corresponding to LiPO1.5N and Li2PO2N, with very similar values to those obtained in the estimated contents of the calculated proportions in Fig. 5b. The value of wt% N calculated from x in the system, according to the quantification of the different phases, gives 5.4% (x = 0.15) and 10.4% N (x = 0.28), in reasonable agreement with the analysed nitrogen contents of these samples, thereby confirming the validity of the proposed reaction scheme. On the other hand, the NMR spectra shown in Fig. 3b confirm the two scenarios resulting from calculations: (i) for the 4.34 wt% N sample, Li4P2O7 is still present together with Li3PO4, in addition to the four resonances attributed to Li2PO2N and another crystallised phase; (ii) the sample with 7.98 wt% N only shows the resonance of Li3PO4 and those of crystallised oxynitrides as observed in the corresponding XRD pattern. The presence of Li4P2O7 or Li3PO4 phases for the nitrogen contents 4.34 and 7.98 wt% (Fig. 3b) is thus supported by the calculated equilibria. The only point of difference between calculated and experimental results is that for 4.34% N (Fig. 5b) there is crystallisation of Li2PO2N seen by XRD (Fig. 2b) and NMR (Fig. 3b). This may be explained if part of the Li3PO4 that originates from decomposition of Li4P2O7 simultaneously reacts with NH3 to produce Li2PO2N. As discussed below, modelling of the nitridation reaction of Li3PO4 indeed produces the Li2PO2N oxynitride.
Fig. 6a shows the solution of the chemical equilibria at the Li2O content of the metaphosphate line against the nitrogen content. The results clearly indicate the formation of the LiPO1.5N oxynitride phase in parallel with a decrease in the content of LiPO3.
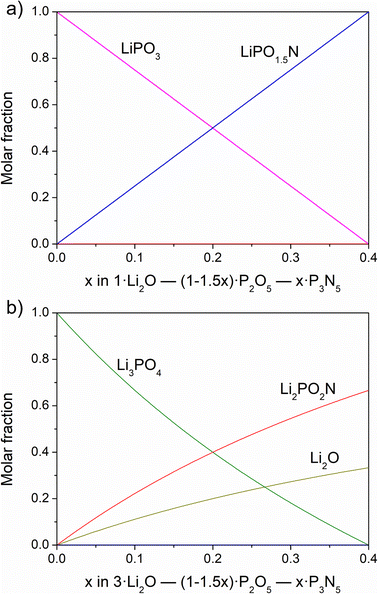 | ||
| Fig. 6 Results of solved chemical equilibria for (a) Li/P = 1 and (b) Li/P = 3 as a function of nitrogen content. | ||
The nitridation reaction that takes place in this case would be:
| LiPO3 + NH3 → LiPO1.5N + 3/2H2O |
We note that the above reaction is exactly that which should proceed from the nitridation of a lithium metaphosphate melt and which would continue until all the LiPO3 is converted into the respective oxynitride, LiPO1.5N, corresponding to a N content of 18.4 wt%. To conclude, we postulate that the formation of an oxynitride of formula LiPO1.5N is coherent both experimentally and theoretically with the above proposed nitridation reactions. Nevertheless, a phase of a stoichiometry with Li/P and N/P = 1 is predicted to exist in the equilibrium phase diagram of the Li2O–P2O5–P3N5 system. Further work is underway with the aim of synthesising the pure LiPO1.5N phase, which is expected to form from the nitridation of LiPO3. We have not been able to provide experimental details on the formation of LiPO1.5N as a pure phase, as we were not able to isolate it from the nitridation products of Li4P2O7, nor did we obtain conclusive results from the direct nitridation of LiPO3. We attempted to nitride the LiPO3 metaphosphate in different ways to synthesise phase-pure LiPO1.5N; however, at this point, we have not observed conclusive proof of its synthesis. The nitridation of lithium metaphosphate via a similar route as that employed for the pyrophosphate Li4P2O7 presents the inconvenience that its melting temperature is much lower, only 656 °C, and the formation of only a small amount of liquid phase during the reaction considerably limits nitrogen incorporation because the surface area is very much reduced, giving rise to products of very low nitrogen content.
The solution of the system if nitridation proceeds from Li3PO4 is represented in Fig. 6b. In this case, nitridation involves reaction of Li3PO4 and NH3 with simultaneous formation of the Li2PO2N phase and Li2O:
| Li3PO4 + NH3 → Li2PO2N + 1/2Li2O + 3/2H2O |
Therefore, we have no need to consider any other oxynitride phase apart from LiPO1.5N and Li2PO2N, and we believe that, due to structural reasons, the formation of a similar oxynitride to these two phases from Li3PO4 would not be plausible. A stable structure made up of [PO2N2] tetrahedra linked through P–N![[double bond, length as m-dash]](https://www.rsc.org/images/entities/char_e001.gif) P bonds, as in the two former oxynitrides, would have an excess of oxygens per phosphorus and an unbalanced charge. It appears, therefore, that Li3PO4 decomposes into Li2O and the stable Li2PO2N phase on the substitution of oxygen for nitrogen.
P bonds, as in the two former oxynitrides, would have an excess of oxygens per phosphorus and an unbalanced charge. It appears, therefore, that Li3PO4 decomposes into Li2O and the stable Li2PO2N phase on the substitution of oxygen for nitrogen.
3.3. Ionic conductivity of LiPON glasses and amorphous films
Fig. 7a displays log10 of electrical conductivity (σ) calculated at 298 K vs. the nitrogen content, as represented by x in the system nLi2O–(1–1.5x)–P2O5–xP3N5, for the lines of composition of n = 1, 2, 3, representing LiPO3, Li4P2O7 and Li3PO4, respectively; Fig. 7b shows the corresponding activation energy of conduction in eV as a function of x.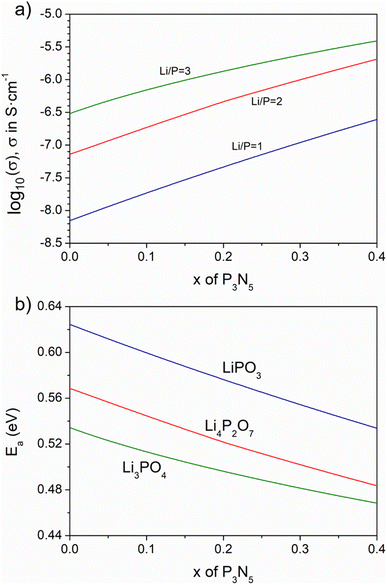 | ||
| Fig. 7 Calculated ionic conductivity (a) and activation energy (b) at 25 °C for Li/P = 1, 2 and 3 nitrided compositions as a function of nitrogen content. | ||
The first point to note is that, whereas the conductivity calculated for the non-nitrided compositions (x = 0) increases from LiPO3 to Li4P2O7 and Li3PO4, in agreement with the expected variation of conductivity in Li2O–P2O5 glasses as a function of Li2O,17 the degree of increase from metaphosphate to pyrophosphate is notably higher than that from pyrophosphate to orthophosphate. This indicates that the mobility of Li+ in the orthophosphate is smaller with respect to that in the other phases.
Previous studies of lithium-ion conductivity in single crystals and polycrystalline lithium pyro- and orthophosphates documented conductivity values that are, in general, much lower for Li3PO4 than for Li4P2O7. Voronin et al. reported conductivity values of the order of 10−3 S cm−1 at 720 K (447 °C),36 and Ivanov-Shitz et al. have reported conductivity values in single crystals of γ-Li3PO4 in the range 2–4 × 10⁻⁵ S cm−1 at 450 °C, while Hu et al.37 and Huggins et al.38 also presented a conductivity of 3 × 10⁻⁵ S cm−1, significantly lower than the conductivity of Li4P2O7 at a similar temperature. The calculated conductivities of the Li4P2O7 and Li3PO4 compositions presented here, Fig. 7a, correspond to the amorphous solids so the most valid comparison is with the corresponding amorphous thin films; nevertheless, the relationship with the conductivity observed in crystalline ceramics is indicative that the orthophosphate composition presents a somewhat lower conductivity than that expected. The great majority of research on LiPON thin films involves processing by deposition of Li3PO4 targets, so it is not readily possible to make a direct comparison with values of the films made up of Li4P2O7 specifically.
The conductivity for the metaphosphate compositions, in which LiPO1.5N forms by nitridation of LiPO3, exhibit a linear increase with increasing nitrogen content. This is consistent with an enhanced mobility of Li+ ions in LiPO1.5N, such that a linear increase of the conductivity of the system occurs proportional to the linear increase of the molar fraction of LiPO1.5N, as observed in Fig. 7a. On the other hand, the conductivity of the nitrided systems obtained from Li4P2O7 (n = 2) and Li3PO4 (n = 3) show slightly different behavior, with some deviation from linearity to a smaller slope occurring at the highest nitrogen contents. This change of trend is more marked for Li3PO4 than for Li4P2O7, where the conductivity difference of the former between x = 0.4 and x = 0 is of about an order of magnitude, 30% less than the increment calculated in the metaphosphate line. The curves of activation energy against nitrogen content (Fig. 7b) decrease their slope with increasing x, in agreement with experimental results in both glasses and LiPON thin films.
Literature results, notably those by Mascaraque et al. for oxynitride lithium phosphate glasses within a range of Li2O/P2O5 ratios,15 showed a regular increase of conductivity with increasing nitrogen content, although with some dispersion in the data. This scattering may be because of heterogeneities in the bulk glass samples, which result in different behavior from that predicted in the present calculations. The values of log10![[thin space (1/6-em)]](https://www.rsc.org/images/entities/char_2009.gif) σ at 298 K are also in good agreement with experimental results for the compositions for which bulk glasses can be prepared:14–16 both experimental and calculated values are in the range log10
σ at 298 K are also in good agreement with experimental results for the compositions for which bulk glasses can be prepared:14–16 both experimental and calculated values are in the range log10![[thin space (1/6-em)]](https://www.rsc.org/images/entities/char_2009.gif) σ = −8.5 to −6.5 in S cm−1, the conductivity increasing with higher lithium and nitrogen contents. Furthermore, some representative experimental values of the ionic conductivity in LiPON thin films obtained by deposition of Li3PO4 have been compared with the values calculated in the present work in Table 1. It can be seen that calculated and experimental values are in good agreement.
σ = −8.5 to −6.5 in S cm−1, the conductivity increasing with higher lithium and nitrogen contents. Furthermore, some representative experimental values of the ionic conductivity in LiPON thin films obtained by deposition of Li3PO4 have been compared with the values calculated in the present work in Table 1. It can be seen that calculated and experimental values are in good agreement.
| Li/P ratio (ref.) | x | log10![[thin space (1/6-em)]](https://www.rsc.org/images/entities/char_2009.gif) σ at 298 K, exp σ at 298 K, exp |
E a exp. (eV) | log10![[thin space (1/6-em)]](https://www.rsc.org/images/entities/char_2009.gif) σ at 298 K, calc. σ at 298 K, calc. |
E a calc. (eV) |
|---|---|---|---|---|---|
| a x in nLi2O–(1–1.5x)–P2O5–xP3N5. | |||||
| 2.900 (ref. 13) | 0.18 | −5.48 | 0.540 | −6.21 | 0.515 |
| 2.410 (ref. 20) | 0.37 | −6.21 | 0.499 | −5.65 | 0.482 |
| 2.795 (ref. 20) | 0.30 | −6.12 | 0.551 | −5.77 | 0.489 |
| 2.708 (ref. 20) | 0.17 | −6.54 | 0.551 | −6.38 | 0.525 |
| 2.854 (ref. 20) | 0.16 | −6.68 | 0.594 | −6.34 | 0.522 |
| 2.637 (ref. 22) | 0.13 | −6.05 | N/A | −6.68 | 0.541 |
| 2.140 (ref. 23) | 0.36 | −6.00 | 0.530 | −5.79 | 0.489 |
Fig. 8a shows the electrical conductivity against the Li/P ratio for nitrogen contents in the range x = 0–0.40. All conductivity curves in Fig. 8a exhibit an increase with both lithium and nitrogen; however, besides the smaller value of conductivity for Li3PO4 as a function of lithium than that expected from a linear increase, the observed difference in the conductivity between x = 0.10 and 0.40 is clearly smaller at the n = 3 line than at n = 1. This difference has been plotted for each nitrogen content as a function of the Li/P ratio in Fig. 8b. For the lowest nitrogen content (x = 0.1), Δlog10 is almost constant at 0.4 for all Li/P values. With higher nitrogen content, Δlog10 becomes more significant but decreases as the lithium content increases. At the highest nitrogen content of x = 0.4, the conductivity difference between the nitrided compositions is clearly higher at the metaphosphate line, with formation of LiPO1.5N, than for the orthophosphate one (Li2PO2N + Li2O). This means that the improvement of conductivity that can be attained through formation of the LiPO1.5N oxynitride phase can be as high as that obtained at any other lithium content.
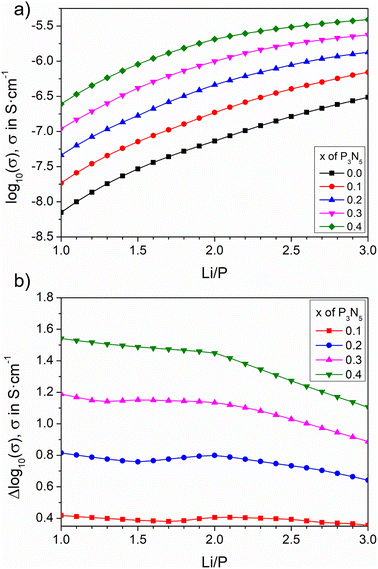 | ||
| Fig. 8 Calculated ionic conductivity and its increment as a function of Li/P ratio for selected nitrogen contents. | ||
One of the key observations in the work by Mascaraque et al. was that, in LiPON glasses,15 the higher the lithium content, the smaller the augmentation of conductivity for a constant nitrogen. The authors pointed out that the ratio between the bridging oxygen atoms (BO) to non-bridging oxygens (NBO) in the network influences the degree of augmentation of the conductivity after nitrogen incorporation. In oxynitride glasses, the BO/NBO ratio decreases for increasing nitrogen contents as –N![[quadruple bond, length as m-dash]](https://www.rsc.org/images/entities/char_e003.gif) and –N
and –N![[double bond, length as m-dash]](https://www.rsc.org/images/entities/char_e001.gif) bonds are formed and substitute for both BOs and NBOs. According to the substitution rules first established by Marchand,39 more BOs will be substituted than NBOs and so the BO/NBO decreases upon nitridation. Part of the NBOs are also substituted, but considering that there are two types of NBOs, P
bonds are formed and substitute for both BOs and NBOs. According to the substitution rules first established by Marchand,39 more BOs will be substituted than NBOs and so the BO/NBO decreases upon nitridation. Part of the NBOs are also substituted, but considering that there are two types of NBOs, P![[double bond, length as m-dash]](https://www.rsc.org/images/entities/char_e001.gif) O and P–O–Li, the number of NBOs of the P–O–Li type would be constant and the P
O and P–O–Li, the number of NBOs of the P–O–Li type would be constant and the P![[double bond, length as m-dash]](https://www.rsc.org/images/entities/char_e001.gif) O type mainly substituted so that charge neutrality is maintained. Lithium ions are coordinated by several non-bridging oxygens of [PO4] tetrahedral units with a typical coordination number between 4 and 5 in lithium-phosphate glasses,40 so if the relative number of negatively charged non-bridging oxygens increases, the mobility of lithium ions would be enhanced, increasing conductivity. The authors demonstrated that the smallest increments in conductivity were found for the smallest changes in the BO/NBO ratio,15 which is corroborated in the present calculations.
O type mainly substituted so that charge neutrality is maintained. Lithium ions are coordinated by several non-bridging oxygens of [PO4] tetrahedral units with a typical coordination number between 4 and 5 in lithium-phosphate glasses,40 so if the relative number of negatively charged non-bridging oxygens increases, the mobility of lithium ions would be enhanced, increasing conductivity. The authors demonstrated that the smallest increments in conductivity were found for the smallest changes in the BO/NBO ratio,15 which is corroborated in the present calculations.
The number density of Li+ ions (nLi+) is plotted in Fig. 9 as a function of the Li/P ratio and nitrogen contents in the range x = 0.00–0.40.
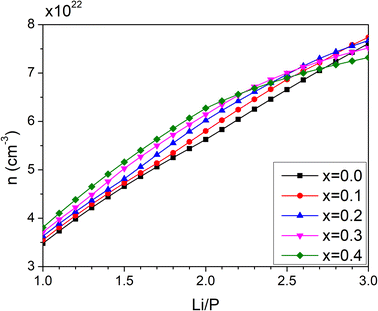 | ||
| Fig. 9 Calculated concentration of total charge carriers as a function of Li/P ratio for nitrogen contents between x = 0.1 and 0.4. | ||
The curve for the density of lithium ions in the oxide compositions (x = 0) shows a near-linear behaviour, although it exhibits a slight curvature with a smaller slope near the orthophosphate line (n = 3). However, the non-linearity of the curves increases with greater nitrogen content. For compositions with Li/P ratios below 2, the increase of nLi+ becomes steeper with nitrogen content with the greatest difference observed for the nLi+ of the respective non-nitrided composition at Li/P = 2. When Li/P approaches 3, the number density of lithium even decreases with respect to the non-nitrided compositions.
Below 0.2 of Li/P, nitridation of any composition in the LiPO3–Li4P2O7 region will mainly produce LiPO1.5N, and only Li2PO2N from Li4P2O7 (Li/P = 2) at the highest nitrogen contents. On the other hand, nitridation above Li/P = 2, in the system Li4P2O7–Li3PO4, will give rise to Li2PO2N only. There is, therefore, a notable difference in the increase in number density depending on the oxynitride that is formed and thus, its contribution to the improvement of the ionic conductivity becomes remarkably different. The calculated values of n(Li+) in LiPO1.5N and Li2PO2N are 3.81 × 10²² and 6.27 × 1022 cm−3, respectively.
A direct influence of lithium number density is seen in the plots of conductivity of Fig. 9. The conductivity increases with both Li/P ratio and nitrogen content; however, the degree of the increase from the non-nitrided composition varies significantly with the lithium content. If only LiPO1.5N is formed, the much greater nLi+ increases the conductivity most at the highest nitrogen content, but the dielectric constant of the nitride network also contributes to this improvement. On the other hand, the difference between the number density of ions of Li2PO2N and Li3PO4 is less significant, which, added to the fact that nitridation of the orthophosphate does not result in pure Li2PO2N but also some Li2O, contributes to a much smaller increase of conductivity with respect to that obtained on nitridation of LiPO3. Nevertheless, the stronger influence of the higher dielectric constant in Li2PO2N still contributes to some positive change in conductivity with respect to Li3PO4.
3.4. Structural considerations of the modelled materials
Regarding the manner in which the oxynitride amorphous network could influence ionic conduction, some further structural aspects must be considered. In view of the calculated ionic conductivity along with the Li/P ratio and incorporated nitrogen, we have demonstrated that the mobility of Li+ ions will be inherently dependent on their density, as well as on the increased dielectric constant of the resultant oxynitride amorphous network, whether in the form of a glass or an amorphous film. The network structure can thus be represented in terms of the different tetrahedra representing phosphate and nitrided phosphate units of the chemical groupings, on which the thermodynamic model of associated solutions is based. These building units are the three types of [PO4] tetrahedra under different degrees of bonding with their neighbours, PO3−, P2O74− and PO43−, and the [PO2N2] tetrahedra that constitute the backbone of the oxynitride phases, Li2PO2N and the new phase, herein proposed as LiPO1.5N. This last phase is expected for oxynitrides near the LiPO3 composition, as shown above, so the glass network of oxynitride compositions from a lithium metaphosphate glass are composed of the combination of [PO4] and [PO2N2] tetrahedra. This hypothesis is very much supported by previous reports of lithium oxynitride phosphate glasses. Their structure has been shown to strongly depend on the type of glass-modifier elements in their composition. Muñoz showed that the types of tetrahedral units of the oxynitride network, [PO3N] and [PO2N2] groups that are obtained by the oxygen-for-nitrogen substitution are present in different proportions when comparing NaPON and LiPON metaphosphate glasses.12 In the former, there is a preponderance of [PO3N] over [PO2N2] units, which do not appear in significant proportions until high nitrogen contents, while in the latter, [PO2N2] units represent the great majority at both low and high nitrogen contents. The reaction of nitridation in a lithium metaphosphate glass can then be represented by the set of reactions of formation of LiPO3, from Li2O and P2O5, and LiPO1.5N, as indicated by the thermodynamic modelling presented earlier and from which a structure composed of [PO4] and [PO2N2] units arises. If a small amount of [PO3N] groups appear in the oxynitride glasses obtained by ammonolysis, it is only because, in the course of nitridation, metastable groupings may form that are frozen in once the reaction is stopped and which ultimately form the structural units of the system in equilibrium. It is proposed here that oxynitride glasses derived from NaPO3 would be composed of the sum of [PO4] and [PO3N] tetrahedral units that would originate a new sodium oxynitride phosphate, which to date has not been obtained. In fact, the oxynitride Na2Mg2P3O9N is a known crystalline oxynitride whose structure is based on [PO3N] tetrahedra linked by triply coordinated nitrogen atoms.413.5. Further implications of the thermodynamic approach to calculate ionic conductivity
Because of the experimental inconveniences to normalise the chemical composition of amorphous electrolytes, most particularly of those obtained via deposition by magnetron sputtering, neither the relevant experimental parameters to be considered in exploring a standardised conduction mechanism nor, more importantly, a way to predict the ionic conductivity for designing new electrolyte compositions can be easily found in the literature. Regardless of the method of synthesis of the LiPON electrolytes, the procedure presented here is a general means for the prediction of conductivity in terms of the chemical composition. Since the methodology can be of general application, it may also be extrapolated to the prediction of material properties of other chemistries. In fact, if the system of composition under study is based on oxides, and no oxynitride phases are to be considered, the solution to the problem can be even simpler, since, if all oxide components of the equilibrium phase diagram of the system are known, then, there is no need for estimation of new Gibbs energy functions. The method that we have developed here for the LiPON electrolytes may thus predict the ionic conductivity of any type of amorphous solid electrolyte material. Furthermore, because no adjustable parameters are considered, the method allows us to obtain a model of the ionic conductivity for any range of composition of interest. In turn, research may be focused on adapting the synthesis method to achieve the highest conductivity, which represents a great advantage compared to a trial-and-error approach considering many compositions and experimental procedures.4. Conclusions
The application of the model of associated solutions is suitable for the calculation of the conduction properties of LiPON compositions for any lithium and nitrogen content in both glasses and amorphous thin films. As a result of the theoretical derivation of the Gibbs formation energies developed for the two oxynitride compounds, we now have a powerful tool for prediction of the properties of amorphous solid electrolytes, in the form of bulk glasses or films. The existence of a new oxynitride, LiPO1.5N, is proposed, based on the results of nitridation of lithium pyrophosphate. This phase also forms from the nitridation of lithium metaphosphate. The structure of this new compound consists of [PO2N2] tetrahedral units, as is the case in the known phase of Li2PO2N. However, no other oxynitride is expected to appear after oxygen-for-nitrogen substitution from Li3PO4. These results validate the scheme of reactions of formation of oxynitride compounds. Throughout the quantification of the molar amount of phosphate and oxynitride phosphate compounds at each composition, the number density of lithium ions that take part in ionic conduction of the modelled solids may be calculated. The conductivity increases monotonously with the lithium content from metaphosphate to orthophosphate compositions. Although the introduction of nitrogen increases conductivity, the magnitude of the increase reduces for the highest lithium contents. The greatest increase in conductivity after nitridation was obtained in the metaphosphate composition, in correspondence with published experimental data for LiPON glasses. Furthermore, the values of log10![[thin space (1/6-em)]](https://www.rsc.org/images/entities/char_2009.gif) σ and Ea obtained by the model presented in this work are very close to experimental values for LiPON thin films.
σ and Ea obtained by the model presented in this work are very close to experimental values for LiPON thin films.
Author contributions
A. López-Grande: conceptualization, data curation, formal analysis, investigation, software, visualization, writing original draft, writing – review & editing; G. C. Mather: data curation, formal analysis, investigation, methodology, software, validation, visualization, writing – review & editing; F. Muñoz: conceptualization, data curation, formal analysis, funding acquisition, investigation, methodology, project administration, methodology, project administration, resources, supervision, validation, visualization, writing original draft, writing – review & editing.Conflicts of interest
The authors do not have any conflict of interest to declare.Acknowledgements
The authors thank funding from projects LUMGLASS (PID2020-115419GB-C21/AEI/10.13039/501100011033) and FUNGLASS (European Union Horizon 2020 research and innovation program under grant agreement No 739566). We acknowledge support of the publication fee by the CSIC Open Access Publication Support Initiative through its Unit of Information Resources for Research (URICI).References
- M. J. Wang, E. Carmona, A. Gupta, P. Albertus and J. Sakamoto, Nat. Commun., 2020, 11, 5201 CrossRef CAS PubMed
.
- D. Xiaoa, J. Tonga, Y. Fenga, G. Zhonga, W. Lia and C. Yanga, Solid State Ionics, 2018, 324, 202 CrossRef
.
- J. B. Bates, N. J. Dudney, G. R. Gruzalski, R. A. Zuhr, A. Choudhury and C. F. Luck, Solid State Ionics, 1992, 53–56, 647–654 CrossRef CAS
.
- Y. H. Jouybari, F. Berkemeier, A. Schäfer and G. Schmitz, J. Power Sources, 2018, 394, 160–169 CrossRef
.
- B. Wang, B. S. Kwak, B. C. Sales and J. B. Bates, J. Non-Cryst. Solids, 1995, 183, 297 CrossRef CAS
.
- B. Carette, M. Ribes and J. L. Souquet, Solid State Ionics, 1983, 9–10, 735–737 CrossRef CAS
.
- A. Magistris, G. Chiodelli and M. Duclot, Solid State Ionics, 1983, 9–10, 611–615 CrossRef CAS
.
- M. Tatsumisago, K. Yoneda, N. Machida and T. Hinami, J. Non-Cryst. Solids, 1987, 95–96, 857 CrossRef CAS
.
- Z. Hu, D. Li and K. Xie, Bull. Mater. Sci., 2008, 31, 681 CrossRef CAS
.
- V. Lacivita, A. S. Westover, A. Kercher, N. D. Phillip, G. Yang, G. Veith, G. Ceder and N. J. Dudney, J. Am. Chem. Soc., 2018, 140, 11029 CrossRef CAS PubMed
.
- V. Lacivita, N. Artrith and G. Ceder, Chem. Mater., 2018, 30, 7077 CrossRef CAS
.
- F. Muñoz, Pure Appl. Chem., 2022, 94, 189 CrossRef
.
- J. B. Bates, N. J. Dudney, G. R. Gruzalski, R. A. Zuhr, A. Choudhury and C. F. Luck, J. Power Sources, 1993, 43–44, 103 CrossRef
.
- P. Hockicko, P. Bury and F. Muñoz, J. Non-Cryst. Solids, 2013, 363, 140 CrossRef CAS
.
- N. Mascaraque, J. L. G. Fierro, A. Durán and F. Muñoz, Solid State Ionics, 2013, 233, 73 CrossRef CAS
.
- F. Muñoz, A. Durán, L. Pascual, L. Montagne, B. Revel and A. C. M. Rodrigues, Solid State Ionics, 2008, 179, 574 CrossRef
.
- A. López-Grande, R. Dagupati, P. Galán del Sastre and F. Muñoz, J. Am. Ceram. Soc., 2021, 104, 5625 CrossRef
.
- B. A. Shakhmatkin, N. M. Vedishcheva, M. M. Shultz and A. C. Wright, J. Non-Cryst. Solids, 1994, 177, 249 CrossRef CAS
.
- O. L. Anderson and D. A. Stuart, J. Am. Ceram. Soc., 1954, 37, 573 CrossRef CAS
.
- K. Senevirathne, C. S. Day, M. D. Gross, A. Lachgar and N. A. W. Holzwarth, Solid State Ionics, 2013, 233, 95 CrossRef CAS
.
- F. Tessier and A. Navrotsky, Chem. Mater., 2000, 12, 148 CrossRef CAS
.
- B. De B. Darwent, Natl. Stand. Ref. Data Ser., 1970, 31, 52 Search PubMed
.
- W. M. Latimer, J. Am. Chem. Soc., 1951, 73, 1480 CrossRef CAS
.
- W. M. Latimer, J. Am. Chem. Soc., 1921, 43, 818 CrossRef CAS
.
- J. Richter and W. Vreuls, Ber. Bunsen. Phys. Chem., 1979, 83, 1023 CrossRef CAS
.
-
W. M. Haynes and D. R. Lide, Handbook of Chemistry and Physics, 91st edn, 2010, ISBN 978-1-4398-2077-3 Search PubMed
.
- J.-L. Souquet, M. L. F. Nascimento and A. C. M. Rodrigues, J. Chem. Phys., 2010, 132, 034704 CrossRef PubMed
.
- P. Hockicko, P. Bury and F. Muñoz, Commun. – Sci. Lett. Univ. Zilina, 2013, 15, 33 Search PubMed
.
- B. Elouadi, M. Ouchetto, E. H. Arbib and N. Amraoui, Phase Trans.: A Multinatl. J., 1988, 13, 219 CrossRef CAS
.
-
S. V. J. Kenmuir, PhD Thesis, Durham University 1986
.
- J.-C. Guitel and I. Tordjman, Acta Cryst, 1976, B32, 2960 CrossRef CAS
.
- A. Daidouh, M. L. Veiga, C. Pico and M. Martinez-Ripoll, Acta Cryst, 1997, C53, 167 CAS
.
- A. S. Korotkov and V. V. Atuchin, Optics Commun., 2008, 281, 2132 CrossRef CAS
.
- M. A. T. Marple, T. A. Wynn, D. Cheng, R. Shimizu, H. E. Mason and Y. S. Meng, Angew. Chem., Int. Ed., 2020, 59, 22185 CrossRef CAS PubMed
.
- D. Massiot, F. Fayon, M. Capron, I. King, S. Le Calvé and B. Alonso,
et al.
, Magn. Reson. Chem., 2002, 40, 70 CrossRef CAS
.
- V. I. Voronin, E. A. Sherstobitova, V. A. Blatov and G. h. Shekhtman, J. Solid State Chem., 2014, 211, 170 CrossRef CAS
.
- Y.-W. Hu, I. D. Raistrick and R. A. Huggins, J. Electrochem. Soc., 1977, 124, 1240 CrossRef CAS
.
- R. A. Huggins, Electrochim. Acta, 1977, 22, 773 CrossRef CAS
.
- R. Marchand, L. Agliz, R. Boukbir and A. Quemerais, J. Non-Cryst. Solids, 1988, 103, 35 CrossRef CAS
.
- T. M. Alam, S. Conzone, R. K. Brow and T. J. Boyle, J. Non-Cryst. Solids, 1999, 258, 140 CrossRef CAS
.
- D. Massiot, R. Conanec, W. Feldmann, R. Marchand and Y. Laurent, Inorg. Chem., 1996, 35, 4957 CrossRef CAS PubMed
.
Footnote |
| † Electronic supplementary information (ESI) available. See DOI: https://doi.org/10.1039/d3ta00724c |
| This journal is © The Royal Society of Chemistry 2023 |


