Influence of temperature-induced A-site cation redistribution on the functional properties of A-site complex polar perovskite K1/2Bi1/2TiO3†
Gina E.
Eyoum
 a,
Udo
Eckstein
 a,
Hana
Ursic
 bc,
Monica
Pinto-Salazar
 d,
Gerd
Buntkowsky
 d,
Pedro B.
Groszewicz
 e,
Stefano
Checchia
 f,
Kouichi
Hayashi
 gh,
Kyle G.
Webber
a and
Neamul H.
Khansur
 *a
*a
aDepartment of Materials Science and Engineering, Friedrich-Alexander-Universität Erlangen-Nürnberg, 91058 Erlangen, Germany. E-mail: neamul.khansur@fau.de
bElectronic Ceramics Department, Jožef Stefan Institute, Ljubljana, Slovenia
cJožef Stefan International Postgraduate School, Jamova Cesta 39, Ljubljana, Slovenia
dInstitute of Physical Chemistry, Technische Universität Darmstadt, 64287, Darmstadt, Germany
eDepartment of Radiation Science and Technology, Delft University of Technology, Delft 2629JB, Netherlands
fESRF, The European Synchrotron, 71 Avenue des Martyrs, CS40220, 38043 Grenoble Cedex 9, France
gDepartment of Physical Science and Engineering, Nagoya Institute of Technology, Nagoya 466-8555, Japan
hJapan Synchrotron Radiation Research Institute, SPring-8, Kouto, Sayo, 679-5198, Japan
First published on 22nd March 2023
Abstract
Tailoring the electromechanical properties of a material without altering the original composition is an emerging phenomenon for the optimization of functional properties. Post-sintering annealing with varying maximum temperatures, cooling rates, and atmospheres can influence the crystallographic phases, domain structures, conductivity, mechanical properties, and the temperature stability of the electromechanical properties. K1/2Bi1/2TiO3 (KBT) is a high-temperature stable >280 °C A-site complex perovskite piezoelectric and is critical for high-temperature applications. However, the influence of annealing conditions on crystal structure, domain structure, and functional properties is not well-known. This work demonstrates the effect of annealing cooling rate and maximum temperature on the macroscopic electromechanical response as well as the crystal and domain structure. It is shown that the room-temperature state of KBT can be reversibly switched between the ferroelectric and relaxor state, where the slow cooling from 900 °C favors the stabilization of the relaxor state and quenching induces the ferroelectric state. Importantly, the quenched sample showed a stable piezoelectric coefficient up to 368 °C in the depolarization temperature, an increase of 78 °C. The origin of ferroelectric-relaxor state change is proposed to be related to the A-site cation redistribution and the associated change in the crystal structure and domain structure.
1. Introduction
Chemical arrangement of A- and/or B-site mixed-metal cations in (A′1−xA′′x)(B′1−yB′′y)O3 perovskite oxides plays a significant role in realizing crystal structure and functional properties, including colossal magnetoresistance, superconductivity, multiferroicity, ionic conductivity, piezoelectricity.1–4 Generally, second-order Jahn–Teller distortions5 associated with the presence of d0 cations on the B-site, e.g., Ti4+, Nb5+, and Ta5+, and/or lone-pair cations on the A-site, e.g., Pb2+ and Bi3+, are principal criteria to the existence of polar nature in perovskite oxides. As such, from the crystal engineering point of view, using an optimal combination of mixed-metal cations on the A- and/or B-sites is critical for enhanced functional properties. In addition to compositions with mixed-metal cations both on the A- and B-sites, a significant number of lead-based and lead-free polar perovskite oxides with only B-site complex structure A(B′1−yB′′y)O3, e.g., Pb(Mg1/3Nb2/3)O3, Pb(Mg1/3Ta2/3)O3, Pb(In1/2Nb1/2)O3, Pb(Sc1/2Ta1/2)O3, and Ba(Zn1/3Ta2/3)O3, are known to exhibit excellent functional properties.4,6–8 Importantly, the chemical ordering of the B-site mixed-metal cations plays a crucial role in the observed functional response through the stabilization of the relaxor (RE) or ferroelectric (FE) states.2,8 The cation ordering is driven by the extent of differences between the ionic size and formal charge, where compositions with large cation size mismatch favor long-range cation ordering, and compositions with closely matched cation size tend to be disordered.9 Although there have been several critical studies of the B-site complex polar perovskites and the influence of B-site cation arrangement, very few experimental studies on the A-site complex (A′1−xA′′x)BO3 polar perovskite oxides are known.10–14 By using X-ray and neutron total scattering data and selected area electron diffraction patterns, these studies have highlighted the lack of long-range A-site cation ordering. It is important to note that despite the absence of long-range A-site cation ordering, changes in local scale cation arrangements can induce significant changes in functional properties.9Bismuth potassium titanate K1/2Bi1/2TiO3 (KBT)15 is one of the few lead-free polar dielectric perovskite oxides with an A-site complex (A′1−xA′′x)BO3 structure. It is attractive for device applications because of the demonstrated oxide ion conductivity suitable for intermediate temperature solid-oxide fuel cell16 and relatively high (≤300 °C) temperature-stable piezoelectric properties promising for sensors.17 Importantly, KBT is also an end member in several application-relevant high-temperature stable piezoelectric compositions, such as solid-solutions of BiFeO3–PbTiO3–K1/2Bi1/2TiO3 and Na1/2Bi1/2TiO3–K1/2Bi1/2TiO3–K0.5Na0.5NbO3.18–20 Interestingly, similar to Na1/2Bi1/2TiO3 (NBT), KBT shows temperature-dependent dielectric responses that are not entirely typical of pure ferroelectric or relaxor, and instead exhibits a mixed ferroelectric-relaxor state at room temperature.21,22 The presence of a relaxor state in KBT and NBT at room temperature can be related to the local structural distortion driven by the displacement of Bi along the 〈111〉c direction.12 It is important to note that the appearance of a RE state in macroscopic measurements, such as temperature-dependent dielectric properties, in Bi-based compositions depends significantly on minor variations in stoichiometry, oxygen vacancies, processing conditions, grain size, etc.23–26 For example, grain sizes below 0.18 μm were found to stabilize the relaxor state in KBT at the room temperature27 and to influence the electric-field induced macroscopic functional properties. Moreover, the A-site non-stoichiometry, i.e., a deviation of K+/Bi3+ ratio from 1, decreases the tetragonal distortion of the KBT.16
The dielectric response of the as-processed KBT shows a ferroelectric-like response up to approximately 300 °C without any significant frequency-dependent variation.25 Above this, a transition from FE to RE state (TF-R) occurs and the temperature of the maximum of permittivity (Tm) shifts to a higher temperature with increased measurement frequencies.23 The relaxation observed above the TF-R in the frequency-dependent dielectric response of KBT is often attributed to random fields28,29 created by the presence of the disordered A-site Bi3+ and K+ cations.12,30 Local structural analysis using total scattering and density functional theory calculations reported that long-range ordering of A-site cations in KBT is unfavorable.11,12 It is important to note, unlike displacive ferroelectrics where B-site cation off-centering is the major contributor to the polarization, the increased tetragonal distortion associated with the A-site cation ordering is critical for the polarization in KBT.11 These earlier works have highlighted critical structural aspects of KBT ceramics. However, experimental studies on tailoring the A-site cation ordering/disordering in KBT and their relationship with functional properties is not established. Importantly, controlling the ordering/disordering of A-site cations can be crucial in stabilizing the ferroelectric or relaxor state at room temperature in A-site complex perovskite oxides.
Although the field-induced ferroelectric ordering in relaxors is important for functional applications, the thermal stability of the induced FE state is limited by the depolarization temperature (Td), which typically lies between 100 °C to 150 °C for NBT-based systems.31 Understanding the parameters influencing the structure, microstructure, and/or chemical homogeneity is essential to tune the Td in A-site complex oxide ceramics. Several works have focused on stabilizing the ferroelectric state in Bi-based lead-free relaxors.31,32 For example, Muramatsu et al.33 reported an increase in Td by 50 °C in thermally quenched NBT, which has been attributed to the quenching-induced enhancement of lattice distortion and increased long-range ordering. An enhancement in Td after rapid cooling to room temperature from temperatures ranging between 700 °C and 1100 °C was also reported for the relaxor Na1/2Bi1/2TiO3–BaTiO3 and BiFeO3–BaTiO3.31,34–37 An increase in the defect concentration with quenching, typically understood to be oxygen vacancies, is also considered crucial in stabilizing the FE state.34 Despite this, an oxygen tracer diffusion study of as-processed and quenched NBT did not reveal any significant variation in oxygen vacancy concentration due to the quenching.38 Although quenching has been found to increase the stability range of the field-induced ferroelectric state in different compositions, their underlying mechanism is not well-established.31 Studies on the influence of rapid cooling/quenching on A-site complex KBT are lacking. The slow cooling at a rate of 0.1 K min−1 from 900 °C or annealing for 24 h at 1000 °C, which is 50 °C lower than the sintering temperature, were found to establish relaxor and ferroelectric state, respectively.10,24 Interestingly, annealing for 24 h at 800 °C was found to establish relaxor state for the same composition. From these previous studies, it can be inferred that slow cooling at rates of 0.1 K min−1 favors the RE state, whereas rapid cooling, i.e., quenching from temperatures above ranging between 700 °C to 1100 °C, favors the FE state in Bi-based A-site complex perovskites. However, the origin of the thermal-treatment-dependent change in the FE/RE state and their correlation with crystal structure, oxygen vacancies, and residual stresses are not well understood. For example, quenching in NBT was found to increase the rhombohedral distortion;33 however, in the case of BiFeO3 with the same R3c crystal structure, quenching did not alter the structural distortion significantly.39 This further highlights that the microscopic origin of the shift in depolarization temperature differs depending on the chemical compositions. Therefore, to understand the influence of A-site cation ordering, change in crystal structure, and/or internal stress, the A-site complex tetragonal KBT has been investigated with varying cooling rates and maximum temperatures up to 900 °C. The thermal history-dependent crystal structure and domain structure have been studied and correlated to their functional electromechanical responses. While slow cooling leads to a decrease in Td, quenching resulted in the opposite effect with increased depolarization temperature. Moreover, the FE-RE state change can be controlled repeatedly by changing the cooling rate. It is also found that a temperature higher than 800 °C is necessary to initiate significant change and induce a state change in KBT by the heat-treatment process.
2. Experimental methodology
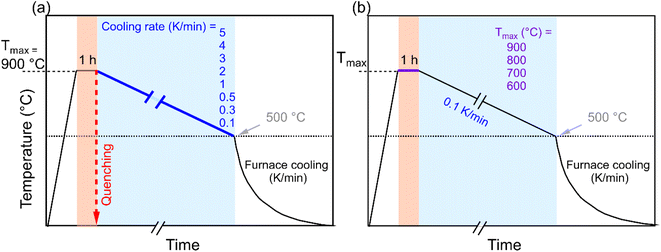
K1/2Bi1/2TiO3 ceramic powder was synthesized by the conventional solid-state reaction route. The constituent elements K2CO3 (99.9%, Alfa Aesar, Germany), Bi2O3 (99.9%, Alfa Aesar, Germany), and TiO2 (99.6%, Alfa Aesar, Germany) were weighed in stoichiometric amounts and ball milled in absolute ethanol for 24 h with 5 mm zirconia milling balls. The mixture obtained after removing the ethanol in a rotary evaporator was calcined using a two-step calcination procedure at 750 °C for 5 h and 900 °C for 3 h to ensure phase pure KBT.40 Calcinated powders were uniaxially pressed at ≈60 MPa to form pellets with a diameter of 10.2 mm and then cold isostatically pressed at 180 MPa. The green bodies were sintered in a closed alumina crucible at 1060 °C for 40 h.40 Sintered KBT ceramics were subsequently ground for electromechanical characterization by a surface grinder to a final thickness of 0.5 mm. It is important to note before the annealing experiment, the as-sintered samples were treated at 600 °C for 1 h followed by cooling to room temperature to remove the internal stress due to the machining and to establish identical sample history.The KBT samples were subjected to different heating/cooling profiles in ambient air atmosphere to thermally treat the sample; the annealing profile of KBT ceramics is shown in Fig. 1. In the first case (Fig. 1a), the samples were heated to Tmax = 900 °C with a heating rate of 5 K min−1 and dwelling time of 1 h and then cooled down to 500 °C with different cooling rates between 5 K min−1 to 0.1 K min−1. Below this temperature the samples were furnace cooled, as it was not possible to control the cooling rate below this temperature due to the lack of active cooling capabiltiy of the furnace. To investigate the influence of rapid cooling, quenching in air was also performed for four different Tmax values of 900 °C, 800 °C, 700 °C, and 600 °C. In the case of quenching, after heating to the targeted Tmax with a dwelling time of 1 h, the samples were removed from the furnace at the Tmax and exposed to air. Moreover, to investigate the temperature range at which the RE-FE state change is inhibited, Tmax was varied between 900 °C to 600 °C with the slowest cooling rate of 0.1 K min−1. For clarity, the 5 K min−1 cooling rate, 0.1 K min−1 cooling rate, and quenching will be termed normal cooling (NC), slow cooling (SC), and quenched (Q) throughout the manuscript.
The surface crystal structure of all KBT samples was investigated using a Bruker D8 Advance eco XRD diffractometer equipped with CuKα (wavelength, λ ≈ 1.5406 Å) radiation in Bragg–Brentano geometry. For surface sensitive XRD measurements, differently treated circular disks with ≈8 mm diameter and 1 mm thickness were used. Before the surface-sensitive XRD measurements, the machined samples were annealed at 600 °C for 1 h. To evaluate the crystal structure from the bulk of the sample, the high energy X-ray measurement was conducted at the European Synchrotron (ESRF), beamline ID15A,41 in transmission geometry with a beam energy of 87 keV (λ ≈ 0.1425 Å) and beam dimensions of 150 μm × 50 μm. The thermally treated samples with dimensions of 1 mm × 5 mm × 1 mm (thickness × length × width) were used for high-energy XRD experiments.
47,49Ti solid-state NMR spectra were recorded on a Bruker Avance III 600 MHz spectrometer using a carrier frequency of 33.81 MHz. The samples were spun at 8 kHz in a 4 mm rotor. A Hahn echo pulse sequence was employed with a pulse length of 3.8 μs (π), a Hahn echo delay of 122 μs, a recycle delay of 0.05 s, and a dwell time of 0.2 μs. Shift of free induction decay to the echo maximum prior to Fourier transformation ensured cancellation of spurious signals from probe ringing, a common artefact encountered at these low NMR frequencies.42 Spectra are simulated using the program DMfit.43
A scanning electron microscope (SEM) (Helios NanoLab 600i Dual Beam, FEI Company, USA) was used to observe the difference in microstructure of the thermally treated KBT samples. For microstructure investigation, normal cooled (NC), slow cooled (SC) and quenched (Q) samples were prepared with subsequent polishing steps down to 1 μm using diamond paste followed by a final polishing step with silica oxide polishing suspension (OPS). The average grain size of thermally treated KBT were calculated using ImageJ software. A total of 5 images of respective samples, where at least 100 grains were measured.
Samples were sputtered with Pt electrodes on the two opposing 8 mm surfaces for electromechanical characterization. The temperature-dependent dielectric permittivity and loss were characterized at frequencies between 1 kHz to 1 MHz from room temperature to 600 °C in a modified furnace (LE6/11/3216, Nabertherm, Germany) outfitted with an LCR meter (E4980AL, Keysight, USA). A heating and cooling rate of 2 K min−1 was used while the temperature-dependent data were collected using a custom-built LabView program for every 0.5 °C temperature change. For small-signal piezoelectric measurements, the thermally treated samples (NC900, SC900, and Q900) were electrically poled at 90 °C in an oil bath with an applied electric field of 6 kV mm−1 for 15 min followed by field-cooling to room temperature. Temperature-dependent d33 measurements were conducted from room temperature to 400 °C using a custom-built setup. To minimize the influence of contact stress on the sample, a cylindrical sample with a diameter of 5.8 mm diameter and height of 6 mm is ideal for our measurement setup. However, because of the large coercive field of ≥6 kV mm−1 of the KBT, it was not possible to pole such a thick sample. Therefore, for the temperature-dependent d33 measurements, the poled circular disk of KBT with a thickness of 0.5 mm and diameter of 5.8 mm was placed between two end pieces of Pt-sputtered KBT ceramics with thickness of 2.75 mm and diameter of 5.8 mm, i.e., the whole assembly was of 6 mm height and 5.8 mm of diameter. The end pieces were made with KBT ceramics to ensure mechanical compatibility with the sample of interest. The sample assembly was then placed between two polished tungsten carbide bearings enabling electrical contact. Details of the measurement setup and custom-built LabView program can be found in previous works.44,45
Piezo-response force microscopy (PFM) analysis was performed using Jupiter XR and MFP-3D atomic force microscopes (Asylum Research, Santa Barbara, California, USA). Conductive tips with a radius of approximately 15 nm made of platinum-coated Si (AC240TM-R3, Olympus, Taiwan) were used for PFM scanning. An electrical voltage of 2–8 V and a frequency of ∼350 kHz was applied during PFM scanning in the dual AC resonance tracking mode. The PFM phase hysteresis loops were measured in the off-electric-field switching spectroscopy mode with the pulsed DC step signal and the superimposed AC drive signal as explained in.46 The waveform parameters were: the sequence of the rising DC step signal was driven at 20 Hz; the frequency of the triangular envelope was 0.2 Hz; a superimposed sinusoidal AC signal with an amplitude of 10–20 V and a frequency of ∼300 kHz was used. Three cycles were measured.
3. Results and discussion
3.1 Influence of cooling rate and maximum temperature on the annealing of KBT
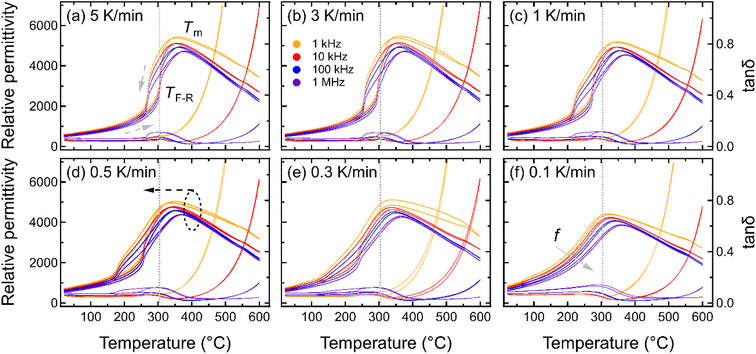
To understand the influence of cooling rate on the spontaneous RE-FE state change in KBT, the temperature-dependent dielectric response was characterized for samples cooled at various cooling rates from the annealing temperature of 900 °C (Fig. 2). The temperature-dependent dielectric permittivity and tanδ of all annealed samples were measured between 20 °C to 600 °C at measurement frequencies between 1 kHz to 1 MHz. The dielectric response of the sample cooled with 5 K min−1 rate (NC900) (Fig. 2a) matches well with that of previously reported as-processed KBT ceramics,27,40 indicating 5 K min−1 cooling from 900 °C does not significantly influence the dielectric response of KBT. The NC900 sample exhibits a relatively high maximum dielectric permittivity of 4500 at the temperature of maximum permittivity, Tm of 378 °C at 1 MHz, where Tm varies with measurement frequency. Moreover, the KBT sample exhibits a dielectric anomaly during heating at approximately 304 °C (indicated as TF-R in Fig. 2a), with a significant thermal hysteresis. The TF-R was extracted from the reciprocal of permittivity (see ESI Fig. S3†), where the temperature of permittivity deviation from the linearity was determined.47 Previous works on KBT27 and other B-site complex materials, such as Pb(Sc1/2Ta1/2)O3,7 suggest this kind of response as the spontaneous relaxor-to-ferroelectric state change upon cooling. As such, the existence of TF-R and any variation in related dielectric anomaly can be considered as an indication of a difference in the spontaneous FE-RE state change of KBT. Importantly, the room-temperature permittivity value tends to increase with a decrease in cooling rate and is maximum for the sample cooled with 0.1 K min−1 (see ESI Fig. S1†). Such an increased permittivity of relaxors is argued to be due to the higher number of interfaces or domain wall density.48The frequency-dependent variation of Tm also highlights the relaxor nature of KBT. From Fig. 2, it is evident that with a decreasing cooling rate, TF-R shifts to a lower temperature, and the thermal hysteresis around TF-R decreases before becoming almost non-existent for the cooling rate of 0.1 K min−1 (SC900). Considering the disappearance of TF-R, it can be argued that cooling from the Tmax of 900 °C at a rate of 0.1 K min−1 suppresses the spontaneous RE-FE transition during cooling down to room temperature and results in a room-temperature stable RE state. This result is consistent with previous reports of post-sintering annealing dependent studies of KBT.10 The suppression of spontaneous RE-FE transition can be attributed to the different extent of local-scale distribution of Bi3+ and K+ cations without any long-range A-site cation ordering.10,11 Moreover, Jiang et al.49 by PDF analysis of synchrotron and neutron total scattering data reported the presence of Bi3+-rich polar clusters associated to the disordered A-site cation configurations in the as-processed KBT (NC900) even at the room temperature. As such, controlling the mobility and distribution of A-site cations by varying the temperature and cooling rate can be effective in controlling the functional properties of KBT and Bi-based oxide perovskites, in general. To highlight the minimum temperature required to suppress the spontaneous RE-FE state change, we also varied Tmax for the 0.1 K min−1 cooling rate, and the permittivity measurements were performed (see ESI Fig. S2†). These data show the formation of an enhanced dielectric anomaly with decreasing annealing temperature, consistent with a spontaneous RE-FE transition.
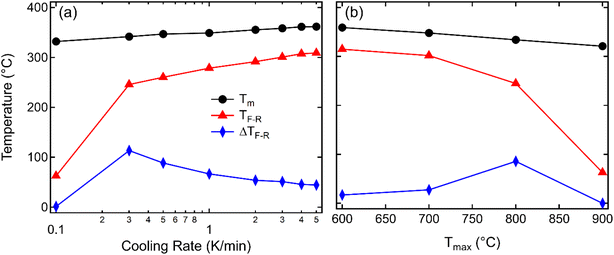
To highlight the influence of the varying cooling rate and Tmax on the slowest cooling rate, TF-R, Tm during heating, and the width of the thermal hysteresis at TF-R (ΔTF-R) are shown in Fig. 3. It should be noted here that the ΔTF-R ≈ 0 can be taken as an indicator for the stabilization of RE state at the room temperature (Fig. 2f). Although Tm and TF-R both displayed a decrease with slower cooling rates, a significant reduction in TF-R was observed below the cooling rate of 0.3 K min−1. Moreover, samples cooled with the 0.3 K min−1 rate showed the highest ΔTF-R before becoming negligible for the 0.1 K min−1 cooling rate, indicating that a cooling rate below approximately 0.3 K min−1 is critical to suppress the spontaneous RE-FE state in KBT ceramics. On the other hand, the ΔTF-R (Fig. 3b) seems to increase with increasing Tmax up to 800 °C of the annealing temperature before becoming indistinguishable for 900 °C annealed samples. This trend is similar to a decrease in cooling rate (Fig. 3a). Within the cooling rate used in this work, the maximum ΔTF-R value possibly indicates the increased presence of relaxor state in ferroelectric KBT before transitioning to dominant relaxor state at the room temperature. Moreover, the Tm decreases with decreasing cooling rate (Fig. 3a) as well as with increased Tmax (Fig. 3b). The lower temperature shift in dielectric anomaly related to the Tm can be attributed to several parameters, such as grain size, conductivity, internal stress, etc.50–53 For example, oxygen vacancy and associated reduced local distortion have been found to shift Tm to lower temperature.50 Interestingly, a significant decrease in TF-R and ΔTF-R is observed for samples slow-cooled from above 800 °C. From the cooling rate-dependent and Tmax-dependent analysis of the dielectric permittivity data, it can be argued that a cooling rate below 0.3 K min−1 for Tmax of 900 °C is effective in suppressing the spontaneous RE-FE transition, whereas slow cooling with 0.1 K min−1 from 700 °C already initiates change in spontaneous RE-FE transition. However, a temperature above 800 °C with a cooling rate of 0.1 K min−1 is the most effective condition to stabilize the RE state.
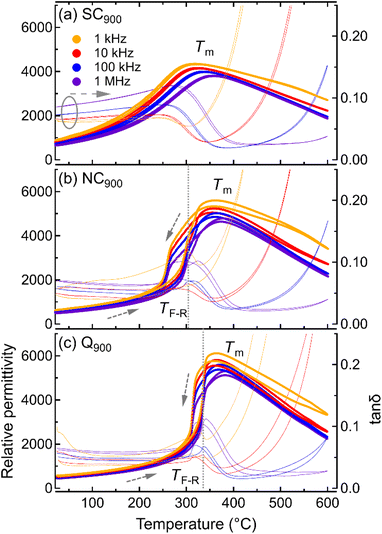
The air quenching of KBT ceramics was performed with varying maximum temperature between 600 °C and 900 °C. The temperature-dependent dielectric data (see ESI Fig. S 4†) of 900 °C, 800 °C, and 600 °C quenched samples indicate that to induce any significant change in dielectric permittivity response, such as a higher temperature shift of TF-R of the as-processed KBT, a quenching temperature higher than 800 °C is required. Interestingly, quenching-induced effect, e.g., increased lattice distortion and shift in Td in NBT was also evident only above 800 °C.33 This suggests that a temperature higher than 800 °C is essential to effectively rearrange the cations or defects in Bi-based perovskite oxides. It should be noted here that annealing of perovskite oxides at higher temperature can induce A-site cation deficiency through volatilization and associated oxygen vacancies. For example, Guo et al.24 reported that post-sintering annealing of KBT at 1000 °C for 24 h changed the ratio of A/B cations from 1.040 to 1.035.24 As such, it can be argued that in the present case, annealing at 900 °C for 1 h did not change the A/B ratio significantly. The influence of cooling rate, i.e., slow cooling (0.1 K min−1), normal cooling (5 K min−1), and air quenching, on the crystal structure, domain structure, and piezoelectric response was investigated for Tmax of 900 °C.
3.2 Temperature-dependent dielectric properties
In order to directly compare the effect of different cooling profiles, i.e., slow cooling, normal cooling, and quenching on KBT, temperature-dependent dielectric permittivity and tanδ for differently annealed samples measured during heating and cooling are shown in Fig. 4. A heating and cooling rate of 2 K min−1 was used for the temperature-dependent permittivity measurements. As previously noted, the sharpness of the dielectric anomaly at the TF-R and thermal hysteresis indicates a RE-FE state change, whereas the absence of dielectric anomaly and thermal hysteresis suggests the stabilization of the RE state at room temperature.40 The Q900 sample (Fig. 4c) displays a higher permittivity value at the Tm and a sharp transition at the TF-R, indicating the FE-RE state change similar to the NC900 sample. Importantly, the TF-R was found to shift to 336 °C for the quenched sample, which is 32 °C higher than the as-processed and NC900 KBT ceramics. This result suggests an increase in the stability range of the FE state in KBT due to quenching, a result that is consistent with other Bi-based perovskite oxide ceramics.31 In addition, the thermal hysteresis in tanδ above the TF-R for Q900 sample is significantly higher, which is possibly related to increased presence of high-temperature active charged species. Nevertheless, the dielectric loss between room-temperature and TF-R of Q900 is similar to NC900 KBT. On the other hand, the SC900 (0.1 K min−1) sample does not exhibit any significant anomaly that resembles TF-R or any thermal hysteresis, indicating an absence of spontaneous RE-FE state change, unlike the as-processed and quenched samples.10These results suggest that controlling the cooling rate from 900 °C is efficient in changing the room temperature state of the KBT as well as the temperature stability range. It is important to note that the annealing condition-dependent change in KBT is reversible. For example, the SC900 sample can be reverted to the as-processed state by cooling from 900 °C at a rate of 5 K min−1 (see ESI Fig. S5†), where no significant difference in macroscopic response, average crystal structure, and microstructure was observed. The reversibility of the state change indicates that the annealing up to 900 °C with a dwell time of 1 h did not induce any remanent change in the stoichiometry, and, therefore, volatilization of the chemical elements for the given annealing condition can be considered negligible.
3.3 Structural variation due to the thermal treatment
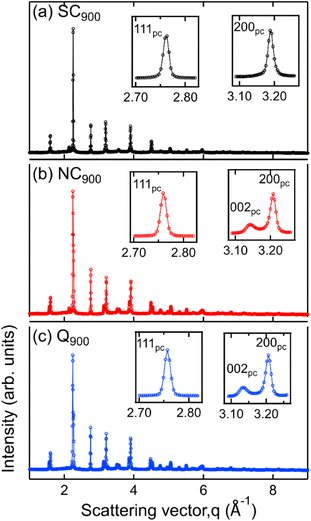
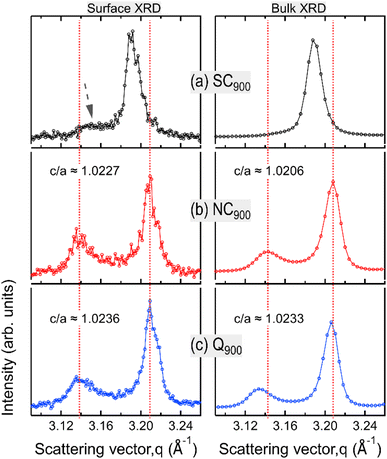
Data presented in the previous sections comprehensively demonstrates the influence of heat treatment on the functional response of KBT. In the following, the microstructure and surface domain structures are investigated to elucidate the origin of thermal treatment-induced changes in KBT. Full diffraction patterns (Fig. 5) of SC900, NC900, and Q900 were collected using a high-energy X-ray source. The SC900 KBT shows a significantly different crystal structure than that of the NC900 and the Q900 samples. The NC900 and Q900 samples show a tetragonal structure with split h00pc reflections, whereas the SC900 sample displays (Fig. 5a) single symmetric reflections without evidence of tetragonal distortion. Importantly, quenching or slow cooling did not induce any secondary phases in the as-processed KBT. Nevertheless, within the resolution limit of the measurement technique used here, it is considered that the slow cooling of KBT from 900 °C transforms the average crystal structure from a tetragonal to a pseudocubic state. It should be noted here that the XRD data presented here is from the bulk of the thermally treated ceramic body. Previous high-energy XRD data of NBT-based relaxors also showed a similar average cubic structure.54 Considering the SC900 sample exhibits electromechanical properties (Fig. 11a), it can be stated that although the average structure is cubic, there remain local scale distortions. Previous temperature-dependent TEM analysis of the domain structure of as-processed KBT has revealed the existence of mixed local scale tetragonal and cubic phases at temperatures between 280 °C and 450 °C.55 As such, it can be argued that the slow cooling of KBT stabilizes the local scale tetragonal and cubic phases, resulting in the observed pseudocubic structure at room temperature. Such observations match well with the previously reported diffraction data and electrical properties of NBT-based relaxors.54,56 The SC900 sample can be considered a relaxor at room temperature and exhibits electric-field (poling) induced macroscopic remanent polarization. The XRD data further highlights the observation of dielectric permittivity data presented in Fig. 3, i.e., suppression of spontaneous RE-FE state change in KBT and the associated change in the crystal structure.We also investigated the surface structure of the thermally treated KBT ceramics using laboratory XRD in reflection geometry. Fig. 6 shows the 200pc reflection of SC900, NC900, and Q900 from the surface and the bulk. Interestingly, the surface diffraction pattern of the SC900 sample is significantly different, showing a low-intensity reflection on the left of the 200pc reflection, which is absent in the case of bulk XRD (Fig. 6a). Previous works on NBT-based relaxors showed a difference in surface and bulk crystal structures, possibly due to the oxygen vacancy and associated variation in chemical pressure between the surface and bulk.57 It was also highlighted that the thickness of the surface layer depends on the extent of oxygen vacancies. However, in our study, the surface crystal structure of the SC900 KBT can be reverted to its original state by heating up to 900 °C in an ambient air atmosphere, i.e., no increased partial pressure of O2 is needed. As such, the variation in the surface structure of the SC900 KBT is likely not due to the creation of increased oxygen vacancies during slow cooling but the change in the arrangement of cations and already existing oxygen vacancies and the associated change in lattice parameter at the surface.
Nevertheless, the surface and bulk XRD data also indicate that the tetragonal distortion for the ferroelectric NC900 and Q900 is different. Noticeably, the c/a ratio is higher for the Q900 samples than that of the NC900 sample. Additionally, the deviation angle, δ = 90° − 2![[thin space (1/6-em)]](https://www.rsc.org/images/entities/char_2009.gif) tan−1(c/a),58i.e., the angle between two adjacent domains at the surface and the bulk, was estimated as ∼1.28° and ∼1.16° for NC900, while ∼1.33° and ∼1.32° for Q900 KBT. It is important to note that the extent of lattice distortion influences both the deviation angle and the stress at the domain wall junction and generally increases with increasing tetragonal distortion.59 Another critical aspect of the Q900 sample is that difference in surface and bulk c/a ratio and deviation angle is negligible, i.e., the structural distortion is more homogeneous for this sample despite the increased c/a due to the quenching. Jiang et al.11 reported the relation between increased tetragonal distortion and increased local A-site cation ordering in KBT by PDF analysis and DFT calculation. As such, our experimental data highlights that the quenching induces a higher tetragonal distortion due to more ordered local A-site cation arrangements, and similarly, the decrease in tetragonal distortion in the SC900 sample is possibly related to the decreased local A-site cation ordering. The analysis of surface and bulk X-ray diffraction data reveals higher tetragonal distortion and more homogeneous distribution of the distorted structure for Q900 KBT than that of the NC900 KBT.
tan−1(c/a),58i.e., the angle between two adjacent domains at the surface and the bulk, was estimated as ∼1.28° and ∼1.16° for NC900, while ∼1.33° and ∼1.32° for Q900 KBT. It is important to note that the extent of lattice distortion influences both the deviation angle and the stress at the domain wall junction and generally increases with increasing tetragonal distortion.59 Another critical aspect of the Q900 sample is that difference in surface and bulk c/a ratio and deviation angle is negligible, i.e., the structural distortion is more homogeneous for this sample despite the increased c/a due to the quenching. Jiang et al.11 reported the relation between increased tetragonal distortion and increased local A-site cation ordering in KBT by PDF analysis and DFT calculation. As such, our experimental data highlights that the quenching induces a higher tetragonal distortion due to more ordered local A-site cation arrangements, and similarly, the decrease in tetragonal distortion in the SC900 sample is possibly related to the decreased local A-site cation ordering. The analysis of surface and bulk X-ray diffraction data reveals higher tetragonal distortion and more homogeneous distribution of the distorted structure for Q900 KBT than that of the NC900 KBT.
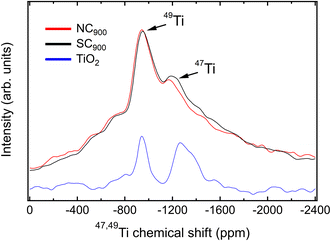
To further confirm the relaxor state of the SC900 KBT, the 47,49Ti MAS NMR spectra for SC900 and NC900 samples were collected. 47,49Ti MAS NMR spectra for the SC900 and NC900 show two peaks (Fig. 7) with their maxima at −948 ppm and −1290 ppm. These maxima are interpreted as the presence of both 49Ti and 47Ti isotopes, respectively. The NMR frequency of both Ti isotopes lies in the same range, hence lines from both are usually observed. This can be better illustrated by the NMR spectrum of TiO2 (anatase) as a reference,42 displayed in Fig. 7 (blue). Their width difference stems from the larger quadrupolar moment of the 47Ti isotope. Albeit less intense, its signal is more sensitive to changes in the local structure. The quadrupolar coupling constant (CQ), a NMR parameter related to the local structure,60 can be determine from the signal width. However, for 47,49Ti NMR it can be also estimated from the separation of the lines from its two isotopes, due to the second order quadrupolar-induced shift. A simulation of the NMR spectrum for TiO2 (see ESI Fig. S6a†) results in a CQ value of approximately 4.4 MHz, which matches reported values.61
KBT exhibits a47,49Ti NMR spectrum that contrasts to one from the TiO2 reference material. Instead of a clear distinction between the resonances from both isotopes, as observed in TiO2, these peaks are smeared out and mingled into one single broad signal for KBT (Fig. 7). This is a trait of disorder of the local structure, but often encountered in perovskite oxides based on solid solutions, especially for relaxor ferroelectrics.62 Despite that, the center band for each isotope can still be resolved as marked in Fig. 7. Their separation may provide a hint on the magnitude of the quadrupolar coupling constant, if a single, well-defined CQ value is considered, and the local structure disorder is accounted for with convolution of the simulated line with a window function (see ESI Fig. S6b†). This approach results in a CQ value around 3.1 MHz, with an uncertainty of less than ±0.3 MHz by visual inspection of the position of peak maxima.
Despite that, the flanks of the main signal are not well reproduced by this model, nor the considerable signal intensity on both sides of the main resonances. Instead, the peak for the 49Ti resonance exhibits a triangular shape, characteristic of a distribution of EFG tensor components and often encountered for solids with marked disorder in the local structure. Such disorder and its effect on NMR lines of quadrupolar nuclei can be well described by the Czjzek model.63 By considering the distribution of CQ values in the framework of the Czjzek model, both the shape of the center band from the 49Ti resonance and the overall peak shape for the complete 47,49Ti NMR spectrum as well as the presence of spinning sidebands can be described (ESI Fig. S6c and d†). This analysis results in a mean CQ of approximately 3.7 MHz for the NC900. Such a value for the mean CQ parameter is reasonable, and compares well to CQ observed for the Ti site of analogous perovskite oxides, for example BaTiO3.64
Next, we compare these features to the line of slow cooled KBT (SC900). The overall line shape is similar, as expected from both samples exhibiting the same composition and average structure. Despite that, the 47Ti line is more pronounced and slightly broader for the slow cooled sample than in the normal cooled sample. This is a noteworthy change given that it is caused only by the cooling rate after annealing equivalent KBT ceramic samples. Broader NMR lines in the context of the Czjzek model can be interpreted as consequence of higher degree of structural disorder, and the 47Ti is a more sensitive probe to minute changes in the local structure than the 49Ti, hence the additional broadening is detected only for the former. A simulation of the spectrum for SC900 KBT with the same parameters found for NC900 does not adequately reproduce the line shape and width. However, an increase of the mean CQ value to 4.0 MHz results in a better match to the experimental line for SC900 (see ESI Fig. S6d†). While these changes are on the limit of resolution and detectability, they corroborate the increase of local structure disorder as consequence of slower cooling rates for KBT. 47,49Ti NMR offers a unique vantage point to analyze K+ and Bi3+ disorder, as its local environment is immediately determined by the situation on the A-site.
3.4 Influence on the microstructure and domain structure
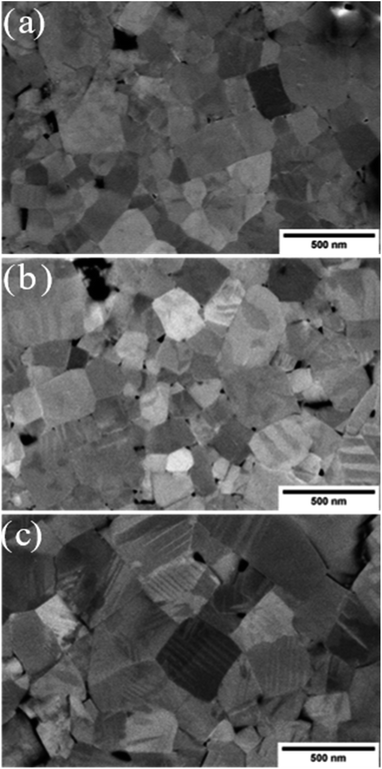
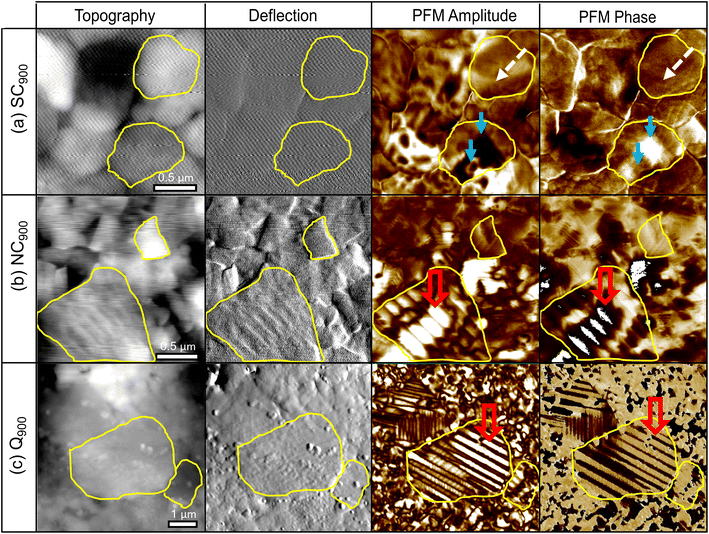
The microstructure images of the SC900, NC900, and Q900 samples collected with SEM are presented in Fig. 8. No significant change in grain size or size distribution was evident due to the thermal treatment, and the average grain size of the KBT sample was ∼540 ± 0.6 nm.40 Interestingly, a lamellar domain structure-like feature is visible for NC900 and Q900 samples. Otoničar et al.55 reported similar lamellar domain structures of as-processed KBT at room temperature, which are associated with the 90° domains and (011)/(101) twin boundaries. In contrast, no such features were observed for the SC900 sample, hinting at the cooling rate-dependent variation in a domain structure. Moreover, the density of lamellar domains seems higher while width is smaller for Q900 KBT than that of NC900 KBT. Previous work on La-doped PbTiO3 ceramics has shown a significant increase in 90° domain density or a decrease in domain width with an increasing c/a ratio.65 As such the variation in domain wall density observed in NC900 and Q900 KBT can be attributed to the difference in the cooling-rate-dependent tetragonal distortion.PFM measurements were used to observe the local domain structure in SC900, NC900, and Q900 KBT ceramics. As can be seen in Fig. 9, the domain structure differs as a function of annealing conditions. The NC900 and Q900 KBT exhibited large regular lamellar ferroelectric domains ranging in size from a few hundred nanometers to micrometers, in agreement with the SEM analysis (Fig. 8). Red open arrows indicate representative examples of these domains in Fig. 9. In the SC900 KBT, the domain structure varies from grain-to-grain. In some grains, there is no evidence of long-range domain structure, where these grains exhibit monotonic contrast in the amplitude and phase images (marked by dashed white arrows Fig. 9) that is typical of relaxors, since the resolution of PFM is insufficient to detect nanoscale domains. In other grains, some examples of irregularly shaped domains of several hundred nanometers in size are observed, indicated by a solid blue arrow in Fig. 9.
The local scale switching response also supports differences in the relaxor-like and ferroelectric-like behavior noticed in SC900, NC900, and Q900 KBT ceramics due to differences in annealing conditions (Fig. 10). The most pronounced ferroelectric behavior is observed in Q900 KBT ceramics (Fig. 10e and f). For NC900 ceramics, pronounced ferroelectric behavior is observed at some measurement points (Fig. 10c), while no ferroelectric PFM hysteresis loops are observed at other points (Fig. 10d). On the other hand, no ferroelectric PFM hysteresis loops are observed in SC900 ceramics, indicating relaxor-like behavior (Fig. 10b). In Fig. 10a, a slight evolution of hysteretic behavior can be seen, indicating a trace of ferroelectricity in this sample as well. As such, the PFM image and local hysteresis response further confirm the influence of annealing conditions on the domain structure and local scale heterogeneity, where the Q900 sample shows the homogenous distribution of grains with lamellar domains and more pronounced local ferroelectric behavior.
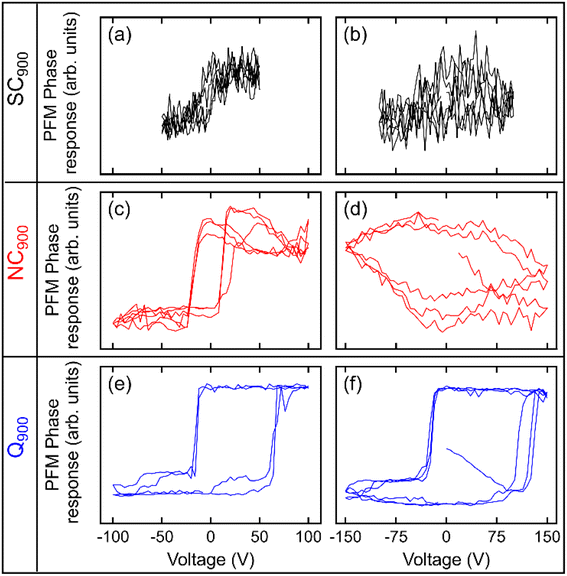 | ||
| Fig. 10 Local PFM phase hysteresis loops measured at two different spots in (a, b) SC900, (c, d) NC900, and (e, f) Q900 KBT ceramics. | ||
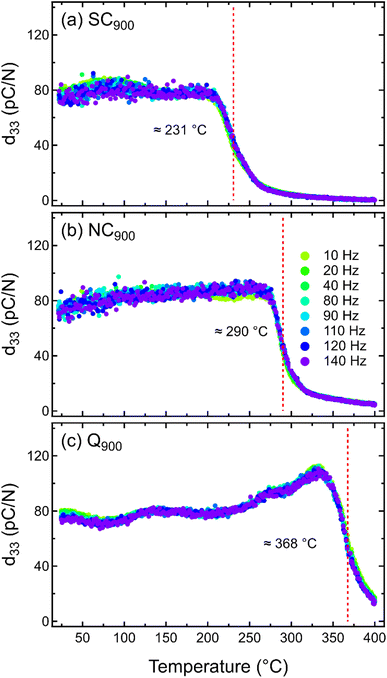 | ||
| Fig. 11 Temperature-dependent d33 of (a) SC900, (b) NC900, and (c) Q900 KBT measured between 10 to 140 Hz. | ||
3.5 Temperature-dependent piezoelectric properties
Previous data clearly demonstrates the importance of thermal treatment in changing the local disorder in KBT, which is expected to also affect the macroscopic electromechanical response. Despite this, there is a lack of any report of quenching and/or slow cooling-induced changes in piezoelectric properties of KBT. As such, the SC900, NC900, and Q900 samples were electrically poled to investigate the temperature-dependent small-signal piezoelectric coefficient, d33, from 20 °C to 400 °C at different frequencies, demonstrating the temperature stability of the induced ferroelectric order (Fig. 11). All the samples show a similar room temperature d33 value of approximately 76 ± 3 pC N−1 without any significant variation depending on the measurement frequencies. Importantly, the room temperature d33 is stable up to approximately 210 °C for all samples. However, above this temperature, the d33 value of SC900 samples begins to decrease and becomes negligible above 250 °C. Generally, the temperature at which the d33 starts to drop due to the increasing decay of macroscopic remanent polarization is considered the depolarization temperature,66 which limits the operating temperature range of a piezoelectric material. The Td of SC900, NC900, and Q900 samples was found to be approximately 231 °C, 290 °C, and 368 °C, respectively. As such, slow cooling (0.1 K min−1) from 900 °C decreases the Td of the as-processed KBT by nearly 59 °C, whereas quenching from the same maximum temperature increases the Td by 78 °C. Similar to previously reported quenching studies of NBT-based and BiFeO3–BaTiO3 compositions, it is evident that the Td of KBT can also be shifted to higher temperatures without sacrificing the d33 value. It is important to note that although an increase in d33 around 125 °C for the Q900 was observed, no dielectric anomaly, crystallographic phase change, or enhanced conductivity was found in this temperature range (Fig. 4c). Therefore, the origin of such an increase is not known; however, a relative change in structure distortion and extrinsic domain wall contributions could play a role here. Our previous work40 on the stress-amplitude-dependent Rayleigh analysis of KBT revealed that the temperature-dependent relative change of intrinsic and extrinsic contributions to the overall piezoelectric coefficient can differ depending on the variation in tetragonal distortion of the as-processed sample. Nevertheless, further investigation of the variation in tetragonal distortion by in situ temperature-dependent diffraction measurement will be required to understand this. Importantly, the cooling rate-induced state change in KBT is stable at least up to 800 °C, which is much higher than their depolarization temperature and Curie point.Interestingly, temperature-dependent d33 data for all samples showed no significant variation with the measurement frequencies. Generally, the frequency dispersion of d33 with increasing temperature is related to the higher mobility of defects, such as space charge and/or structural defects.67,68 The lack of frequency dispersion for all three cases of KBT indicates that thermal treatment did not induce any significant defects that are mobile within the measurement range of 400 °C. Although the quenching-induced increase in Td has been reported for different piezoelectric compositions, their underlying mechanisms are not well understood. For example, a study on NBT-7BT reported quenching induced spontaneous tetragonal-to-rhombohedral phase transition and built-in electric bias field due to increased defects are the origin of increased Td.69 On the contrary, quenching-induced increased structure distortion has been argued to be the origin of increased Td in NBT.33 The variation in structural distortion could play a crucial role in the temperature stability of the field-induced piezoelectric response.32 Previous works have shown that higher tetragonal distortion can shift the ferroelectric-paraelectric phase transition temperature to a higher temperature due to the increased c/a ratio53 and internal residual stress associated with the intergranular coupling.70–72
Our experimental data comprehensively demonstrated the influence of annealing temperature and cooling rate on the macroscopic piezoelectric response and their stability range. Moreover, the annealing cooling rate has a pronounced effect on the room-temperature stabilization of FE and RE state in KBT. Considering that the Bi-based A-site complex perovskite oxide ceramics, among others, possess local scale intrinsic disorder, for example, related to the heterogeneous distributions of A-site cations and their polar displacements,11,12,14 controlling the degree of this local disorder with post-sintering annealing is critical to tuning the functional response. It has been reported that the microscopic origin of relaxor nature at room temperature in the as-processed KBT is related to the existence of Bi3+-rich polar clusters,49 which intrinsically stabilizes during the cooling step of the sintering process. Interestingly, at the higher symmetry cubic phase, the preferred displacement of Bi3+ is the 〈100〉c directions; however, during the transition to the tetragonal phase with cooling, the local Bi-displacement branch off to 〈111〉c directions and induces local scale structural heterogeneity.12 Kim et al.73 has attributed such local scale heterogeneity of Bi3+ cation as the origin of nano-domains in Bi-based compositions. It is important to mention that existence of nano-domains does not necessarily indicate the presence of PNRs. In fact, no direct experimental evidence of PNRs in KBT using PDFs analysis has been found.49 Nevertheless, the post-sintering annealing at a sufficiently high temperature but below the sintering temperature with varying cooling rates can alter the degree of local displacement of Bi3+ cation, i.e., local scale structural heterogeneity. In the case of thermal quenching of KBT from 900 °C, a more homogeneous distribution (less clustering) of Bi3+ is established as quenching from high temperature did not provide the time necessary to form a significant degree of the Bi3+-rich clusters, i.e., Bi-displacement along the 〈111〉c is suppressed, and associated local structural heterogeneity is decreased. Yin et al.74 using first-principles calculation reported that there is a small energy gap, ΔE ≈ 16.7 meV, between [111]c and [001]c displacement directions of Bi3+ cation. The more homogeneous distribution or more ordered A-site cation arrangement due to the quenching can be further rationalized from the fact that a significant increase in tetragonal distortion and domain wall density was observed. Previous works have reported the relation between increased tetragonal distortion and increased local A-site cation ordering in KBT by PDF analysis and DFT calculation.11 As such, it can be argued that in KBT, the more homogeneously distributed A-site cations with less Bi3+-displacement along the 〈111〉c can be established after quenching. On the contrary, the slow cooling (0.1 K min−1) from 900 °C provides sufficient time to form a significantly higher degree of local Bi3+-rich polar clusters than that of the normally cooled and quenched KBT. However, within the scope of the current work, the driving force for the formation of Bi3+-rich clustering49 or local displacement of Bi along 〈111〉c directions12 in average tetragonal structured KBT cannot be determined.
The influence of internal residual (local) stress with different annealing conditions has also been considered to explain the variation in functional properties and state change in KBT. One can argue that cooling slowly forms high temperatures, allowing the internal stresses to relax and the RE state to persist, whereas cooling quickly increases internal stresses that can drive a stress-induced FE order. For example, externally applied stress-induced relaxor to ferroelectric state change has been observed in NBT-BT composition.45 However, diffraction studies using synchrotron radiation source (see ESI Fig. S7†) did not reveal any significant differences in internal residual stress state due to the annealing process. Moreover, Zhang et al.75 reported the quenching-induced residual stress of approximately 15 MPa and −8 MPa on the surface and core of NBT-BT, respectively. This quenching-induced stress is far below their coercive stress, implying that the residual stress due to quenching is insufficient to induce RE-FE state change in this case. Nevertheless, our analysis also highlights that the required threshold temperature and cooling rate to significantly alter the A-site cation arrangements for KBT are >800° and <0.3 K min−1, respectively.
4. Conclusions
Post-sintering thermal treatment is a critical tool to tailor electromechanical properties without requiring the modification of chemical composition. For the A-site complex KBT ceramics, it was shown that the cooling rate and the maximum temperature of the annealing condition play a crucial role in stabilizing the FE and RE state at room temperature. Rapid cooling stabilizes the FE state, whereas slow cooling stabilizes the RE state. The FE and RE state KBT showed similar small-signal piezoelectric coefficients at the room-temperature after electrical poling. However, the depolarization temperature, i.e., loss of macroscopic polarization, is significantly different. For the KBT, it was found that the Td of the slow-cooled sample is approximately 70 °C lower than the as-processed sample, whereas, for the quenched sample, it was increased by 56 °C. The origin of the difference in depolarization temperature is related to the annealing condition-dependent variation in A-site cation arrangement and the associated change in the crystal structure (tetragonal distortion) and domain structure. The opposite effect of slow cooling and quenching on the depolarization temperature KBT further highlights that rapid cooling hinders the rearrangement of the A-site cations by inhibiting the local Bi3+-rich clustering and enhancing the ferroelectric state and depolarization temperature. This work highlights that change in A-site cation arrangement is crucial for the observed annealing condition-dependent variation in functional properties.Conflicts of interest
There are no conflicts to declare.Acknowledgements
The authors gratefully acknowledge financial support from the Deutsche Forschungsgemeinschaft under GRK2495/H. N. H. K. acknowledges funding from the Deutsche Forschungsgemeinschaft (DFG) under KH 471/2. H. U. thanks the Slovenian Research Agency for financial support under project N2-0212 and core funding P2-0105. The technical assistance of Val Fišinger at JSI is gratefully acknowledged. P. G. acknowledges financial support by the Dutch Research Council (NWO) for the ECCM Tenure Track funding under project number ECCM.006. M. P. S. acknowledges funding from the Deutsche Forschungsgemeinschaft (DFG) under contract Bu-911-28-2. This study was supported by JSPS Japanese-German Graduate Externship (Grant No. 2019/R1). The European Synchrotron (ESRF) is acknowledged for provision of beamtime (experiment MA-4774, DOI: 10.15151/ESRF-ES-452942182).References
- G. King and P. M. Woodward, J. Mater. Chem., 2010, 20, 5785–5796 RSC.
- O. Bidault, C. Perrin, C. Caranoni and N. Menguy, J. Appl. Phys., 2001, 90, 4115–4121 CrossRef CAS.
- M. C. Knapp and P. M. Woodward, J. Solid State Chem., 2006, 179, 1076–1085 CrossRef CAS.
- C. G. F. Stenger and A. J. Burggraaf, Phys. Status Solidi A, 1980, 61, 653–664 CrossRef CAS.
- P. S. Halasyamani and K. R. Poeppelmeier, Chem. Mater., 1998, 10, 2753–2769 CrossRef CAS.
- P. K. Davies, Curr. Opin. Solid State Mater. Sci., 1999, 4, 467–471 CrossRef.
- F. Chu, N. Setter and A. K. Tagantsev, J. Appl. Phys., 1993, 74, 5129–5134 CrossRef CAS.
- C. G. F. Stenger and A. J. Burggraaf, Phys. Status Solidi A, 1980, 61, 275–285 CrossRef CAS.
- P. K. Davies, H. Wu, A. Y. Borisevich, I. E. Molodetsky and L. Farber, Annu. Rev. Mater. Res., 2008, 38, 369–401 CrossRef CAS.
- H. Manabu and F. Shinobu, Jpn. J. Appl. Phys., 2017, 56, 10PC03 CrossRef.
- B. Jiang, T. Grande and S. M. Selbach, Chem. Mater., 2017, 29, 4244–4252 CrossRef CAS.
- I. Levin, D. S. Keeble, G. Cibin, H. Y. Playford, M. Eremenko, V. Krayzman, W. J. Laws and I. M. Reaney, Chem. Mater., 2019, 31, 2450–2458 CrossRef CAS.
- G. O. Jones, J. Kreisel and P. A. Thomas, Powder Diffr., 2002, 17, 301–319 CrossRef CAS.
- D. S. Keeble, E. R. Barney, D. A. Keen, M. G. Tucker, J. Kreisel and P. A. Thomas, Adv. Funct. Mater., 2012, 23, 185–190 CrossRef.
- V. A. Isupov, Ferroelectrics, 2005, 315, 123–147 CrossRef CAS.
- L. Li, M. Li, I. M. Reaney and D. C. Sinclair, J. Mater. Chem. C, 2017, 5, 6300–6310 RSC.
- T. Takenaka, H. Nagata and Y. Hiruma, Jpn. J. Appl. Phys., 2008, 47, 3787 CrossRef CAS.
- A. J. Bell, T. P. Comyn and T. J. Stevenson, APL Mater., 2021, 9, 010901 CrossRef CAS.
- J. T. Bennett, Development of bismuth ferrite derived piezoelectric ceramics for high temperature applications, University of Leeds, 2014.
- R. Dittmer, E. M. Anton, W. Jo, H. Simons, J. E. Daniels, M. Hoffman, J. Pokorny, I. M. Reaney and J. Rödel, J. Am. Ceram. Soc., 2012, 95, 3519–3524 CrossRef CAS.
- Z. F. Li, C. L. Wang, W. L. Zhong, J. C. Li and M. L. Zhao, J. Appl. Phys., 2003, 94, 2548–2552 CrossRef CAS.
- K. Riess, N. H. Khansur, A. Martin, A. Benčan, H. Uršič and K. G. Webber, Phys. Rev. B, 2021, 103, 094113 CrossRef CAS.
- M. Hagiwara and S. Fujihara, Appl. Phys. Lett., 2015, 107, 012903 CrossRef.
- J. Guo, M. Zhu, L. Li, T. Qing, C. Wang, L. Liu, M. Zheng and Y. Hou, J. Appl. Phys., 2017, 121, 014101 CrossRef.
- M. Hagiwara, Y. Ehara, N. Novak, N. H. Khansur, A. Ayrikyan, K. G. Webber and S. Fujihara, Phys. Rev. B, 2017, 96, 014103 CrossRef.
- J. Guo, M. Zhu, L. Li, M. Zheng and Y. Hou, J. Alloys Compd., 2017, 703, 448–453 CrossRef CAS.
- H. Manabu and F. Shinobu, Jpn. J. Appl. Phys., 2015, 54, 10ND10 CrossRef.
- R. Pirc and R. Blinc, Phys. Rev. B, 2007, 76, 020101 CrossRef.
- D. Phelan, C. Stock, J. A. Rodriguez-Rivera, S. Chi, J. Leão, X. Long, Y. Xie, A. A. Bokov, Z.-G. Ye, P. Ganesh and P. M. Gehring, Proc. Natl. Acad. Sci., 2014, 111, 1754–1759 CrossRef CAS PubMed.
- M. Hagiwara, J. Ceram. Soc. Jpn., 2021, 129, 496–503 CrossRef CAS.
- K. V. Lalitha, B. Wang, P. Ren, D. A. Hall and T. Rojac, Open Ceram., 2022, 10, 100259 CrossRef.
- H. Nagata, Y. Takagi, Y. Yoneda and T. Takenaka, Appl. Phys. Express, 2020, 13, 061002 CrossRef CAS.
- H. Muramatsu, H. Nagata and T. Takenaka, Jpn. J. Appl. Phys., 2016, 55, 10TB07 CrossRef.
- K. V. Lalitha, J. Koruza and J. Rödel, Appl. Phys. Lett., 2018, 113, 252902 CrossRef.
- Q. Li, J. Wei, T. Tu, J. Cheng and J. Chen, J. Am. Ceram. Soc., 2017, 100, 5573–5583 CrossRef CAS.
- S. Kim, G. P. Khanal, S. Ueno, C. Moriyoshi, Y. Kuroiwa and S. Wada, J. Appl. Phys., 2017, 122, 014103 CrossRef.
- B. Wang, Y. Z. Li and D. A. Hall, J. Am. Ceram. Soc., 2022, 105, 1265–1275 CrossRef CAS.
- Y. Takagi, Y. Ochiai, M. Ito, T. Kawagoe, H. Nagata and I. Sakaguchi, Jpn. J. Appl. Phys., 2022, 61, SN1034 CrossRef.
- T. Rojac, M. Kosec, B. Budic, N. Setter and D. Damjanovic, J. Appl. Phys., 2010, 108, 074107 CrossRef.
- G. E. Eyoum, U. Eckstein, K. Riess, A. Gadelmawla, E. Springer, K. G. Webber and N. H. Khansur, J. Mater. Sci., 2022, 57, 15843–15861 CrossRef CAS.
- G. B. M. Vaughan, R. Baker, R. Barret, J. Bonnefoy, T. Buslaps, S. Checchia, D. Duran, F. Fihman, P. Got, J. Kieffer, S. A. J. Kimber, K. Martel, C. Morawe, D. Mottin, E. Papillon, S. Petitdemange, A. Vamvakeros, J.-P. Vieux and M. Di Michiel, J. Synchrotron Radiat., 2020, 27, 515–528 CrossRef CAS PubMed.
- P. B. Groszewicz, H. Breitzke, W. Jo, J. Rödel and G. Buntkowsky, J. Appl. Phys., 2017, 121, 114104 CrossRef.
- D. Massiot, F. Fayon, M. Capron, I. King, S. Le Calvé, B. Alonso, J.-O. Durand, B. Bujoli, Z. Gan and G. Hoatson, Magn. Reson. Chem., 2002, 40, 70–76 CrossRef CAS.
- F. H. Schader, Mechanical Stability of the Electromechanical Properties and Phase Transitions in Lead-Containing and Lead-Free Ferroelectrics, Technische Universität Darmstadt, 2016.
- F. H. Schader, Z. Wang, M. Hinterstein, J. E. Daniels and K. G. Webber, Phys. Rev. B, 2016, 93, 134111 CrossRef.
- H. Uršič and U. Prah, Proc. R. Soc. A, 2019, 475, 20180782 CrossRef PubMed.
- W. Jo, J. Daniels, D. Damjanovic, W. Kleemann and J. Rodel, Appl. Phys. Lett., 2013, 102, 192903 CrossRef.
- V. V. Shvartsman and D. C. Lupascu, J. Am. Ceram. Soc., 2012, 95, 1–26 CrossRef CAS.
- B. Jiang, D.-Y. Lin, X. Wang, S. M. Selbach and K. Page, J. Appl. Phys., 2022, 132, 224101 CrossRef CAS.
- Z. Zhao, X. Liang, T. Zhang, K. Hu, S. Li and Y. Zhang, J. Eur. Ceram. Soc., 2020, 40, 712–719 CrossRef CAS.
- J. Suchanicz and W. S. Ptak, Ferroelectr. Lett. Sect., 1990, 12, 71–78 CrossRef CAS.
- A. Gadelmawla, K. Riess, J. Birkenstock, M. Hinterstein, K. G. Webber and N. H. Khansur, J. Appl. Phys., 2021, 130, 185106 CrossRef CAS.
- G. Picht, N. H. Khansur, K. G. Webber, H. Kungl, M. J. Hoffmann and M. Hinterstein, J. Appl. Phys., 2020, 128, 214105 CrossRef CAS.
- J. E. Daniels, W. Jo, J. Rödel and J. L. Jones, Appl. Phys. Lett., 2009, 95, 032904 CrossRef.
- M. Otoničar, S. D. Škapin, B. Jančar, R. Ubic and D. Suvorov, J. Am. Ceram. Soc., 2010, 93, 4168–4173 CrossRef.
- R. Ranjan and A. Dviwedi, Solid State Commun., 2005, 135, 394 CrossRef CAS.
- S. Kong, N. Kumar, S. Checchia, C. Cazorla and J. Daniels, Adv. Funct. Mater., 2019, 29, 1900344 CrossRef.
- S. Stemmer, S. K. Streiffer, F. Ernst and M. Rüuhle, Philos. Mag. A, 1995, 71, 713–724 CAS.
- M. U. Farooq, R. Villaurrutia, I. Maclaren, T. L. Burnett, T. P. Comyn, A. J. Bell, H. Kungl and M. J. Hoffmann, J. Appl. Phys., 2008, 104, 024111 CrossRef.
- P. B. Groszewicz, Open Ceram., 2021, 5, 100083 CrossRef CAS.
- A. Labouriau and W. L. Earl, Chem. Phys. Lett., 1997, 270, 278–284 CrossRef CAS.
- V. Veerapandiyan, M. N. Popov, F. Mayer, J. Spitaler, S. Svirskas, V. Kalendra, J. Lins, G. Canu, M. T. Buscaglia, M. Pasciak, J. Banys, P. B. Groszewicz, V. Buscaglia, J. Hlinka and M. Deluca, Adv. Electron. Mater., 2022, 8, 2100812 CrossRef CAS.
- U. Werner-Zwanziger, A. L. Paterson and J. W. Zwanziger, J. Non-Cryst. Solids, 2020, 550, 120383 CrossRef CAS.
- T. J. Bastow and H. J. Whitfield, Solid State Commun., 2001, 117, 483–488 CrossRef CAS.
- S. K. Choi, S. R. Kim and D. G. Choi, J. Mater. Sci.: Mater. Electron., 2000, 11, 603–607 CrossRef CAS.
- E. M. Anton, W. Jo, D. Damjanovic and J. Rodel, J. Appl. Phys., 2011, 110, 094108 CrossRef.
- N. H. Khansur, J. Biggemann, M. Stumpf, K. Riess, T. Fey and K. G. Webber, Adv. Eng. Mater., 2020, 22, 2000389 CrossRef CAS.
- L. Wahl, J. G. Maier, S. Schmiedeke, T. A. Pham, T. Fey, K. G. Webber, N. Travitzky and N. H. Khansur, J. Am. Ceram. Soc., 2022, 105, 6755–6764 CrossRef CAS.
- J. Chen, C. Zhou, H. Liu, H. Zhang, Q. Li, C. Yuan, J. Xu, S. Cheng, J. Zhao and G. Rao, J. Alloys Compd., 2022, 924, 166505 CrossRef CAS.
- D. A. Hall, A. Steuwer, B. Cherdhirunkorn, P. J. Withers and T. Mori, J. Mech. Phys. Solids, 2005, 53, 249–260 CrossRef CAS.
- D. A. Hall, A. Steuwer, B. Cherdhirunkorn, T. Mori and P. J. Withers, J. Appl. Phys., 2004, 96, 4245–4252 CrossRef CAS.
- D. Hall, J. Mater. Sci., 2001, 36, 4575–4601 CrossRef CAS.
- S. Kim, R. Miyauchi, Y. Sato, H. Nam, I. Fujii, S. Ueno, Y. Kuroiwa and S. Wada, Adv. Mater., 2023, 2208717, DOI:10.1002/adma.202208717.
- J. Yin, X. Shi, H. Tao, Z. Tan, X. Lv, X. Ding, J. Sun, Y. Zhang, X. Zhang, K. Yao, J. Zhu, H. Huang, H. Wu, S. Zhang and J. Wu, Nat. Commun., 2022, 13, 6333 CrossRef CAS PubMed.
- M.-H. Zhang, P. Breckner, T. Frömling, J. Rödel and K. V. Lalitha, Appl. Phys. Lett., 2020, 116, 262902 CrossRef CAS.
Footnote |
| † Electronic supplementary information (ESI) available. See DOI: https://doi.org/10.1039/d3ta00808h |
| This journal is © The Royal Society of Chemistry 2023 |

