 Open Access Article
Creative Commons Attribution 3.0 Unported Licence
Understanding dehydration of Prussian white: from material to aqueous processed composite electrodes for sodium-ion battery application†
F. M.
Maddar
 a,
D.
Walker
 b,
T. W.
Chamberlain
 a,
J.
Compton
 a,
A. S.
Menon
 a,
M.
Copley
 a and
I.
Hasa
 *a
*a
aWMG, The University of Warwick, Coventry, CV4 7AL, UK. E-mail: ivana.hasa@warwick.ac.uk
bDepartment of Physics, The University of Warwick, Coventry, CV4 7AL, UK
First published on 6th July 2023
Abstract
Prussian blue analogues (PBAs) have attracted much attention as potential cathode materials for sodium-ion battery (SIBs) applications. The presence of water in these compounds plays a significant role on the electrochemical behaviour, highlighting the importance of a comprehensive understanding of the dehydration process. Herein, we investigate the properties and the dehydration effects on the structural, morphological, and electrochemical properties of a Prussian White (PW) cathode material (Na2−xFe[Fe(CN)6]1−y·zH2O). The use of such material as well as the water-based electrode processing method employed matches the requirements for low toxicity, cost, and resource abundance in large-scale applications. By combining temperature dependent in situ X-ray diffraction analysis, ex situ structural and morphological investigation and electrochemical characterization, it is found that water removal is a kinetically driven process that is strongly affected by the experimental conditions (e.g., temperature, heating rate, atmosphere) and the environment of the PW system (material vs. composite electrode). This study addresses the challenges driven by the presence of surface adsorbed and interstitial water in PW systems and offers insights into the processability of water-based PW electrodes and their electrochemical response under different dehydration conditions. Optimal conditions to transition from a sodium-rich hydrated monoclinic phase toward a sodium-rich dehydrated rhombohedral phase are identified and are found to be different when comparing data from PW material in its powder form and PW material within a composite electrode for SIB application.
1. Introduction
Sodium-ion batteries (SIBs) are considered the next generation, sustainable, low cost, and efficient electrochemical energy storage technology. Studied alongside lithium-ion batteries (LIBs) in the 1970s, they were quickly side-lined in favour of the more promising performance observed for LIBs. It was only after 2008 that this battery technology regained momentum as demonstrated by the many research groups starting to investigate SIB materials.1 Concerns about the long-term availability of the raw materials employed for LIBs production,2–4 the potential lower cost of SIBs5 as well as a renewed interest in more sustainable energy storage systems6 has triggered the escalated attention towards the SIB technology. This has been recently confirmed by the growing interest of many successful companies working toward SIB commercialisation.7–13Despite the fast-growing technological development, the scientific challenges for a rational improvement of SIB materials lies in the lack of a comprehensive understanding of the structure–property correlation in several SIB active materials which hinders a systematic optimisation of their performance, and the successful validation of lab-scale results in prototype and industrially relevant scales.
A major challenge for the uptake of the SIB technology in real world applications is the development of high energy density cells while maintaining low cost and sustainability.14
Among the various cathode materials proposed for SIBs, Prussian blue analogues (PBAs) hold great promise due to their satisfactory theoretical capacity, low cost and easy synthesis methods, and tuneable redox potentials achievable by using low cost and abundant elements such as Fe and Mn.15–20 PBAs have a general structural formula of AxM2[M1(CN)6]1−y·nH2O (with A = alkaline metal; M1 and M2 = transition metal cations; y = number of [M1(CN)6] vacancies). Despite the several advantages of PBAs, vacancies and water in their structure strongly affects the Na ion storage behaviour resulting in poor capacity, side reactions with electrolyte and low overall performance for practical applications. Controlling synthesis methods of PBAs in such a way that allows high sodium content and low vacancy and water content can enhance their structural stability and electrochemical performance. Thus, several studies have investigated improved synthesis methods aiming at reducing structural defects.21–24 Goodenough et al. firstly reported the improved electrochemical stability of PBAs through dehydration, converting a Na-rich monoclinic Na2MnFe(CN)6 into a rhombohedral structure.25 Further recent studies conducted by Zhou et al.26 and Chou et al.27 highlighted the negative impact of structural water on the electrochemical performance of these materials.
Among all PBAs, Fe-based sodium rich Na2Fe[Fe(CN)6] is characterized by a high theoretical capacity of ∼170 mA h g−1 (two sodium ions extracted per formula unit), and a relatively high operating voltage of ∼3.2 V.28,29 The Fe-based framework makes it particularly desirable for large-scale applications in terms of both cost and resource abundance. However, as for the other PBAs, its electrochemical behaviour is strongly affected by the presence of water. Thus, understanding its electrochemical properties and response to dehydration is critical to advance and accelerate its implementation in relevant cell prototypes.
Rudola et al.30 made important remarks highlighting structural conversion and stability when Fe-based PBA is thermally dehydrated converting from monoclinic to the higher capacity rhombohedral structure emphasising its sensitivity towards drying pressure, gas atmosphere and working environment. More recent study by Nielsen et al.31 investigated the effect of water removal on a Prussian White (PW) system by using neutron diffraction observing the co-existence of the monoclinic and hydrated rhombohedral structures for a single composition of PW independently of the synthesis method adding on to the inherent understanding of water in the structure. While most of the research has focussed on the understanding of the dehydration at the material level, in this study we further push the investigation from materials to composite electrodes processed in water. So far, the water sensitivity of PBAs has hindered aqueous electrode processing as demonstrated by the several studies reporting on the use of N-methyl pyrrolidone (NMP) during electrode manufacturing. A more comprehensive understanding of the effect of water and the induced degradation processes is necessary to obtain high-performance electrode materials produced through environmentally friendly aqueous processing. In this work, we investigate the thermal dehydration process on a promising PW material, Na1.80(5)Fe[Fe(CN)6]·1.84(3)H2O presenting a theoretical capacity of about 160 mA h g−1 in its fully dehydrated state. It is found that water removal is a kinetically driven process that is strongly affected by the experimental conditions (e.g., temperature, heating rate, atmosphere) and the environment of the PW system (powder vs. composite electrode). By monitoring vacuum pressure and drying duration, we influence the crystallinity of the structure impacting the activity of the low spin Fe2+/Fe3+ redox reaction resulting in increased overall capacity. This study addresses the challenges driven by the presence of surface adsorbed and interstitial water in PW systems and offers insights into the processability of water-based PW electrodes and their electrochemical response under different dehydration conditions.
2. Experimental section
2.1. Material characterization
X-ray diffraction (XRD) measurements of the pristine powders and dried PW electrode samples were carried out using a Malvern PANalytical Aeris diffractometer (40 kV, 15 mA) with non-monochromated Cu Kα radiation (λ = 1.5408 Å). A Ni Cu-Kβ filter, a Soller slit (0.04 rad), a divergence slit (1/4°) and a 13 mm X-ray mask were used on the incident beam side. An anti-scatter (9 mm) and Soller (0.04 rad) slits were used on the diffracted beam side. Data was collected in Bragg–Brentano mode using a zero background Si holder while spinning, between an angular range of 10–60° (2θ) with a step size of 0.01° and time per step of ∼200 s using a PIXcel1D-Medipix3 detector. Dried electrodes were transferred into an argon-filled glovebox in which they were prepared by mounting onto the zero background Si holder and covered with Kapton film to prevent air exposure during the measurement.In situ XRD measurements as a function of temperature were conducted on a pristine PW powder using a Rigaku Oxford Diffraction Synergy-S diffractometer equipped with an ARC 100 detector with Mo Kα (λ = 0.7114 Å). Herein, borosilicate glass capillary tubes with Ø 0.5 mm (Capillary Tube Supplies Ltd) were filled and sealed inside an argon filled glovebox establishing an argon atmosphere within the capillary. Temperature was controlled using an Oxford Cryosystems Cobra Plus and incrementally increased at a rate of 2 °C min−1 between 17 and 227 °C, with a dwell time of 10 min to hold and stabilize at the specified temperature before each scan. The CrysAlisPro v42.x software was used to make fast powder scans (15 min per scan) with an angular range of 15.5–41.5° (2θ). Similar experiments were conducted on pristine PW electrodes using an Anton Paar XRDynamic 500 equipped with a Primux 3000 X-ray tube giving Co Kα1,2 radiation (λ = 1.7902 Å) and a Pixos 2000 1D detector. The samples were mounted in the Anton Paar TTK 600 stage and the chamber placed under vacuum (max vacuum pressure reached 10−2 mbar). Temperature was incrementally increased between 25 and 200 °C at a scan rate of 5 °C min−1 with a dwell time of 5 min at each temperature. Each scan was recorded with a step size of 0.01° and time per step of ∼106 s within an angular range of 15.5–41.5° (2θ). An alternative test has been conducted by heating the stage at 170 °C and keeping the temperature fixed for 20 hours. The sample surface was aligned at the beginning of the measurement and adjusted automatically to compensate for the expansion of the stage with temperature. Structural refinements were performed using a combination of the Pawley12 and Rietveld methods in the GSAS-II software package.32 The unit cell parameters from Ojwang et al.29 and Song et al.25 were used as starting points for the structural refinements. For both, powders and electrodes, Rietveld refinements were used to obtain unit cell parameters and then Pawley refinements were carried out using the obtained parameters from the Rietveld refinements. Pawley refinements could not be used to accurately obtain the lattice parameters due to the overlap of the several Bragg reflections particularly in the monoclinic phase. Scanning electron microscopy (SEM) was used to observe morphologies of the PW samples by using a Zeiss SUPRA FE-SEM (Zeiss, Germany). PW samples were transferred from the glove box into the SEM using an air-less transfer system. Analysis was carried out by applying an acceleration voltage of 5–10 kV. Cross-sections were obtained using a HITACHI Ion Milling System (IM4000 plus) at an acceleration voltage of 4 kV for 1 hour.
2.2. Electrode processing and electrochemical testing
PW with a nominal chemical composition of Na1.80(5)Fe[Fe(CN)6]·1.84(3)H2O was used as received from Altris AB. Aqueous processing was used to prepare electrodes. Active material (PW), binder (carboxymethyl cellulose binder (CMC, BVH8, Ashland) and styrene–butadiene rubber (SBR, BM-451B, Zeon)) and carbon additive were mixed in a weight ratio of 93.5![[thin space (1/6-em)]](https://www.rsc.org/images/entities/char_2009.gif) :
:![[thin space (1/6-em)]](https://www.rsc.org/images/entities/char_2009.gif) 3.0
3.0![[thin space (1/6-em)]](https://www.rsc.org/images/entities/char_2009.gif) :
:![[thin space (1/6-em)]](https://www.rsc.org/images/entities/char_2009.gif) 3.5 using a high energy mixer (EL1, Eirich) with deionised water as the solvent. The slurry was then allowed to degas for 1 hour at 40 mbar before being coated onto a 15 μm aluminium foil (Avotec Steel). The resulting electrodes were calendered (Innovative Machine Corp.) to a target density of 1.5 g cm−3 (equating to ∼30% porosity) with average loadings of 140 g m−2 (GSM). Prior to cell assembly, PW electrodes were cut into discs (Ø 14.8 mm for CR 2032 coin cells and Ø 12 mm for Swagelok® T-cells) and dried under dynamic vacuum using Glass Oven B-585 (BUCHI UK Ltd) at 170 °C for different durations: 15, 24 and 48 hours. Electrochemical tests were conducted on either two-electrode coin cell configuration, or 3 electrode T-cells assembled in an argon-filled glove box (MBraun LABstar) with a H2O and O2 content lower than 0.5 ppm. The cells contained the above prepared PW electrode as the working electrode, sodium metal cut from sodium pieces (99.8%, Across Organics), rolled, pressed, and punched as the counter electrode (and reference electrode in the T-cell format). A glass fibre separator (Whatman, grade GF/A) was soaked with a 1 M sodium hexafluorophosphate (NaPF6) solution in either diglyme (Fluorochem Ltd) or a mixture of ethylene carbonate (EC)
3.5 using a high energy mixer (EL1, Eirich) with deionised water as the solvent. The slurry was then allowed to degas for 1 hour at 40 mbar before being coated onto a 15 μm aluminium foil (Avotec Steel). The resulting electrodes were calendered (Innovative Machine Corp.) to a target density of 1.5 g cm−3 (equating to ∼30% porosity) with average loadings of 140 g m−2 (GSM). Prior to cell assembly, PW electrodes were cut into discs (Ø 14.8 mm for CR 2032 coin cells and Ø 12 mm for Swagelok® T-cells) and dried under dynamic vacuum using Glass Oven B-585 (BUCHI UK Ltd) at 170 °C for different durations: 15, 24 and 48 hours. Electrochemical tests were conducted on either two-electrode coin cell configuration, or 3 electrode T-cells assembled in an argon-filled glove box (MBraun LABstar) with a H2O and O2 content lower than 0.5 ppm. The cells contained the above prepared PW electrode as the working electrode, sodium metal cut from sodium pieces (99.8%, Across Organics), rolled, pressed, and punched as the counter electrode (and reference electrode in the T-cell format). A glass fibre separator (Whatman, grade GF/A) was soaked with a 1 M sodium hexafluorophosphate (NaPF6) solution in either diglyme (Fluorochem Ltd) or a mixture of ethylene carbonate (EC)![[thin space (1/6-em)]](https://www.rsc.org/images/entities/char_2009.gif) :
:![[thin space (1/6-em)]](https://www.rsc.org/images/entities/char_2009.gif) diethylene carbonate (DEC) in a ratio of 3
diethylene carbonate (DEC) in a ratio of 3![[thin space (1/6-em)]](https://www.rsc.org/images/entities/char_2009.gif) :
:![[thin space (1/6-em)]](https://www.rsc.org/images/entities/char_2009.gif) 7 (v/v%) (Fluorochem Ltd) as the electrolyte. Cyclic voltammetry (CV) tests were conducted within the 2.0–4.0 V (vs. Na+/Na) potential range at a scan rate of 0.1 mV s−1. Galvanostatic cycling tests were conducted within the 2.0–4.0 V voltage range applying a constant current of 0.1C during 5 formation cycles and 0.2C during the following cycles (1C = 140 mA g−1). Galvanostatic intermittent titration technique (GITT) was performed after one charge/discharge cycle in coin cell at 0.1C, by applying a current density of 14 mA g−1 (0.1C) for 10 min followed by 60 min resting period in open circuit. Galvanostatic cycling test were conducted by using a battery tester (BCS-805, BioLogic). CV and GITT measurements were performed with a multichannel potentiostat, VMP3 (BioLogic). All electrochemical tests were carried out in a climatic chamber (Binder oven) at 25 °C.
7 (v/v%) (Fluorochem Ltd) as the electrolyte. Cyclic voltammetry (CV) tests were conducted within the 2.0–4.0 V (vs. Na+/Na) potential range at a scan rate of 0.1 mV s−1. Galvanostatic cycling tests were conducted within the 2.0–4.0 V voltage range applying a constant current of 0.1C during 5 formation cycles and 0.2C during the following cycles (1C = 140 mA g−1). Galvanostatic intermittent titration technique (GITT) was performed after one charge/discharge cycle in coin cell at 0.1C, by applying a current density of 14 mA g−1 (0.1C) for 10 min followed by 60 min resting period in open circuit. Galvanostatic cycling test were conducted by using a battery tester (BCS-805, BioLogic). CV and GITT measurements were performed with a multichannel potentiostat, VMP3 (BioLogic). All electrochemical tests were carried out in a climatic chamber (Binder oven) at 25 °C.
3. Results and discussion
3.1. Structural phase transitions and morphology characterization of PW material
PW systems come in a variety of compositions that differ in terms of sodium content, vacancy sites and water content which strongly affect the Na ion storage behaviour of this class of compounds.31,33 High sodium content, low vacancy concentration and water content are generally considered favourable conditions for electrochemical performance.29The material used in this work is a sodium rich, hydrated compound (Na1.80(5)Fe[Fe(CN)6]·1.84(3)H2O) characterized by a monoclinic structure. Three types of water can be found in PBAs systems consisting of surface adsorbed water, interstitial water and coordinated water. While the latter one is chemically bonded and cannot be removed from the structure, interstitial and adsorbed water can be removed by heat treatment as already reported.34,35 To identify the thermal conditions needed for the dehydration of the Na-rich hydrated PW system, in situ XRD analysis as a function of temperature has been conducted on a pristine powder and the results are reported in Fig. 1.
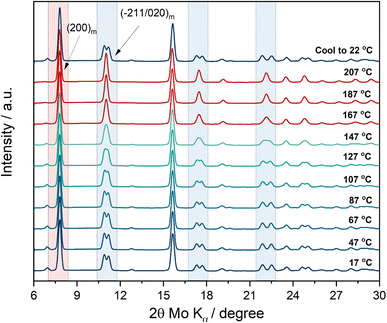 | ||
| Fig. 1 In situ XRD measurement as a function of temperature on pristine PW powder material. Test conducted in transmission mode. Heating rate: 2 °C min−1. | ||
The test has been carried out in transmission mode by using a capillary sealed under argon (no vacuum applied). The first XRD spectrum at room temperature (17 °C) can be indexed according to the monoclinic structure (P21/n) of the pristine material. Upon temperature increase, the typical monoclinic double peak features centred at about 11°, 17.5° and 22.2° (2θ, Mo Kα, see regions highlighted in light blue) start to merge into a single peak at about 147 °C resembling a shift to a rhombohedral-like symmetry. Phase transition to the rhombohedral structure does not occur since the growth of the (012)r reflection is not observed.35 Upon further temperature increase, the feature sharpens and becomes a clear single reflection at 167 °C. Interestingly the highest intensity peak of the monoclinic phase, i.e., the (200)m reflection (see region highlighted in red) remains stable at high temperature, suggesting that the experimental conditions including heating scan rate and the sealed environment (no vacuum pressure applied) affect the kinetics of the phase transformation. Indeed, the results indicate that dehydration occurs upon temperature increase, however considering the closed environment, the residual moisture in the closed capillary hinders a full phase transition, suggesting instead only the occurrence of a structural change toward a higher symmetry rather than a phase change occurrence highlighting further its sensitivity to the drying conditions.36 The observation is confirmed by the appearance of the monoclinic pristine phase upon cooling down. Indeed, the last XRD spectrum collected at room temperature after the heating step, shows that moisture is re-adsorbed by the powder at 22 °C. Besides, a preliminary indication obtained by the in situ XRD experiment and in agreement with previous studies,29,37 is that 170 °C is an effective drying temperature to remove interstitial water from the crystal structure.
Ex situ XRD has been conducted for powders dried for 15, 24 and 48 hours at 170 °C under dynamic vacuum of 10−2 mbar to confirm the dehydration is a kinetically driven process affected by the experimental conditions. The refined powder patterns and the corresponding SEM images are reported in Fig. 2(a)–(h).
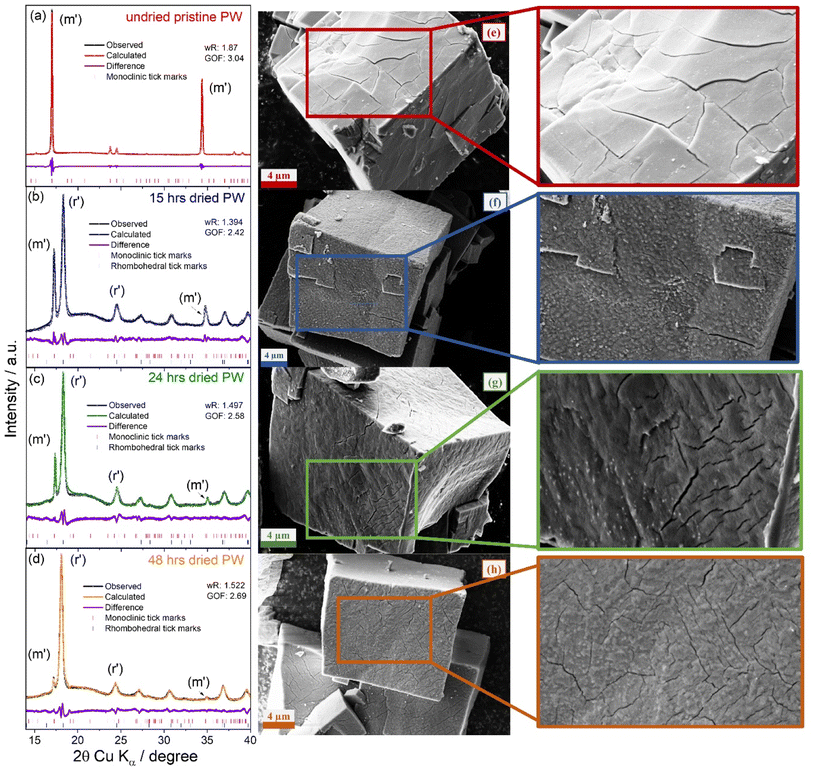 | ||
| Fig. 2 Fitted powder XRD patterns of (a) pristine PW, (b) 15 hours, (c) 24 hours, and (d) 48 hours dried PW under dynamic vacuum (∼10−2 mbar). Black lines represent the observed data points, coloured profiles are the fitted profiles, purple lines are the difference curves and pink and blue tick marks represent allowed Bragg diffraction positions of monoclinic and rhombohedral phases respectively (see Table 1 for refined lattice parameters). (e)–(h) Corresponding SEM images with zoomed cracking features. | ||
The XRD patterns of the pristine undried PW powder (Fig. 2(a)) presents a monoclinic phase (space group = P21/n, a = 10.4543(7), b = 7.4441(9), c = 7.2864(8) Å, and β = 92.71(2)°) with no sign of impurities and lattice parameters in agreement with previous studies.29,35 The sharp peaks indicate a high degree of crystallinity, which upon longer drying decreases as demonstrated by the XRD patterns for the samples dried for 15, 25 and 48 hours (see Fig. 2(b)–(d)). The dehydrated PW structures obtained at the different drying times resulted in the appearance of the rhombohedral phase as indicated by the new reflection (r′) at ∼18.3° (2θ, Cu Kα), the merging of the peaks at 24.5°, and the reduction of the monoclinic peaks (m′) and (m′′) at ∼17° and ∼34.3°, respectively. The longer the drying time, the more the reflections associated to the rhombohedral phase grow at the expenses of the monoclinic phase indicating water removal from the structure.29 After 48 hours of drying, most of the water was removed from the structure with a clear transition to the rhombohedral phase. It is worth noting though, that even after 48 hours of drying, a complete transition to the rhombohedral phase is not achieved as indicated by the presence of the monoclinic peaks at 17.2° and 34.9° (see Fig. 1(d)). Refinement results for the XRD patterns presented in Fig. 2 are reported in Table 1.
| Sample | R wp | GOF | Space group (P21/n) monoclinic | Space group (R![[3 with combining macron]](https://www.rsc.org/images/entities/char_0033_0304.gif) ) rhombohedral ) rhombohedral |
||||||
|---|---|---|---|---|---|---|---|---|---|---|
| a (Å) | b (Å) | c (Å) | β (°) | Vol (Å3) | a (Å) | c (Å) | Vol (Å3) | |||
| Undried | 10.4543(7) | 7.4441(9) | 7.2864(8) | 92.71(2) | 566.43(1) | — | — | — | ||
| 15 h dried | 1.394 | 2.42 | 10.3276(9) | 7.04585 | 7.5946(3) | 91.72(5) | 552.39(1) | 6.5475(5) | 19.0070(8) | 705.67(3) |
| 24 h dried | 1.497 | 2.58 | 10.2709(4) | 6.94129 | 7.5621(5) | 91.70(7) | 538.89(3) | 6.5386(1) | 18.9831(5) | 702.86(2) |
| 48 h dried | 1.522 | 2.69 | 10.2421(8) | 6.99082 | 7.5015(5) | 92.40(5) | 536.64(7) | 6.5423(2) | 18.9130(2) | 701.0(6) |
It is observed that upon dehydration, the unit cell volume of the monoclinic phase decreases. A similar trend is observed also for the rhombohedral phase. Interestingly, Ojwang et al.35 previously reported that upon moisture exposure of the rhombohedral phase, the unit cell volume of the monoclinic phase decreases implying a loss of bulk sodium, combined with an oxidation of Fe2+ to Fe3+ due to reaction with water. Our data appears to have an opposite trend; however, it is worth considering the different experimental conditions (moisture exposure vs. dehydration). Indeed, in this study, during the dehydration process, water is removed from the interstitial sites of the structure under dynamic vacuum conditions which does not allow sufficient time for moisture to react and extract Na ions from the bulk at the same time, while in the report from Ojwang et al.,35 the unit cell volume reduction is mainly attributed to sodium loss. Indeed, a more recent study supports our findings on the reduction of the unit cell upon dehydration.31 W. R. Brant et al.29 suggested a volume collapse of 20% relatively to the hydrated phase. In this study, the dehydration conducted under dynamic vacuum conditions (10−2 mbar, at 170 °C) leads to a lower volume contraction of ∼6%, which is reflected in a loss of crystallinity (observed as an increase of the FWHM of the diffraction peaks – see Fig. 2(a)–(d)) implying structural strain. To visualise the effects of dehydration on the PW morphology, SEM analysis was conducted. Fig. 2(e) shows the typical cubic nature of the pristine PW particles and the appearance of large open cracks on its surface. As the powders are dried, changes in surface topography are observed. The surface texture of the PW particles changed significantly when dried for 15 hours (Fig. 2(f)) resulting in a rough surface with bright deposits. Samples dried for 24 hours, resulted in more cracks and smaller amounts of bright deposits on its surface. As PW particles were dehydrated for longer (48 hours), surface cracks become more prominent in agreement with the unit cell volume reduction reported in Table 1.
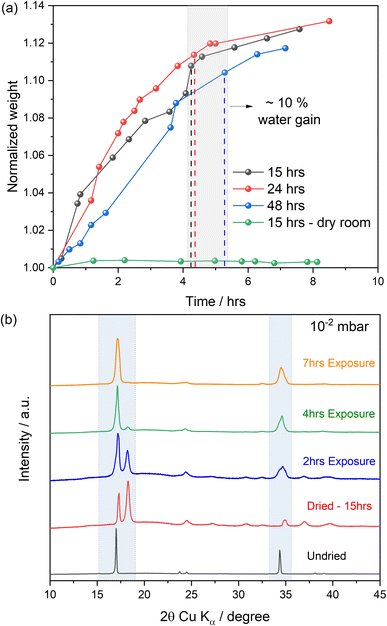
It is worth noting that the different particle size observed in the SEM images is not arising from the dehydration process but rather attributable to the broad particle size distribution of the investigated material (see SEM image reported in Fig. S1 in ESI†). Indeed, studies reported by W. R. Brant et al.29 indicate no significant change in particle size distribution with particles appearing to be slightly more broken apart upon drying. The sensitivity of the dehydrated PW samples was then tested upon exposure to moisture in air and in dry room conditions. Samples were weighed before and after drying powders for 15, 24 and 48 hours under controlled dynamic vacuum of ∼10−2 mbar at 170 °C. The mass of the dried material was then monitored over time upon moisture exposure in ambient, room temperature conditions. The results are reported in Fig. 3.
According to previous reports, the pristine PW material may contain ∼10–20% of water including adsorbed, interstitial and coordinated water.27 All dried samples exhibit a mass loss of about ∼10% after the dehydration process. When exposed to moisture (see Fig. 3(a)), the changes observed in terms of mass increase were not significantly different between the three dried samples, however few differences were observed. The PW dried for 15 hours showed an initial sharper mass gain around the first hour relatively to the samples dried for 24 and 48 hours. After ∼4–5 hours, all profiles start to level off, returning to their original weights (before dehydration) and indicating water uptake into the structure. Interestingly, the sample exposed to a dry room environment did not exhibit a substantial change in mass, suggesting dry room conditions to be sufficient for the protection of the dehydrated phases against moisture.
XRD analysis was performed to observe structural changes occurring over time as a consequence of water uptake. The XRD patterns reported in Fig. 3(b) show that after exposure to air/moisture, the structure starts to transition from a mixture of monoclinic and rhombohedral phases towards a cubic system. This is most likely due to a structural change involving de-sodiation from the bulk with concomitant oxidation of Fe2+ to Fe3+.35 In addition to this, a small impurity peak at ∼32.5° (2θ, Cu Kα) can be seen and this can be attributed to the formation of Na4[Fe(CN)6] on exposure to air confirming observations from Ojwang et al.35 After 2 hours, a mixture of monoclinic, rhombohedral, and cubic phases are observed, and Rietveld refinements (Fig. S2 and Table S1 in ESI†) suggest an approximate ratio of monoclinic![[thin space (1/6-em)]](https://www.rsc.org/images/entities/char_2009.gif) :
:![[thin space (1/6-em)]](https://www.rsc.org/images/entities/char_2009.gif) rhombohedral
rhombohedral![[thin space (1/6-em)]](https://www.rsc.org/images/entities/char_2009.gif) :
:![[thin space (1/6-em)]](https://www.rsc.org/images/entities/char_2009.gif) cubic of 0.6
cubic of 0.6![[thin space (1/6-em)]](https://www.rsc.org/images/entities/char_2009.gif) :
:![[thin space (1/6-em)]](https://www.rsc.org/images/entities/char_2009.gif) 1
1![[thin space (1/6-em)]](https://www.rsc.org/images/entities/char_2009.gif) :
:![[thin space (1/6-em)]](https://www.rsc.org/images/entities/char_2009.gif) 1. As expected, the fittings indicate an expansion of the unit cell volumes of both the monoclinic and rhombohedral phases upon water uptake, showing an opposite trend compared to the dehydration experiments (see Fig. 2 and Table 1). This is consistent with re-hydration of the sample but suggests that only partial re-hydration has occurred after 2 hours. After being exposed to atmospheric conditions for 4 hours, a complete transition to the cubic phase has occurred. No further significant structural changes are observed after 7 hours of exposure, with the fitted lattice parameters showing a clear unit cell expansion of the cubic phase from 2 to 7 hours indicating an uptake of water by the cubic phase over time.
1. As expected, the fittings indicate an expansion of the unit cell volumes of both the monoclinic and rhombohedral phases upon water uptake, showing an opposite trend compared to the dehydration experiments (see Fig. 2 and Table 1). This is consistent with re-hydration of the sample but suggests that only partial re-hydration has occurred after 2 hours. After being exposed to atmospheric conditions for 4 hours, a complete transition to the cubic phase has occurred. No further significant structural changes are observed after 7 hours of exposure, with the fitted lattice parameters showing a clear unit cell expansion of the cubic phase from 2 to 7 hours indicating an uptake of water by the cubic phase over time.
3.2. Structural phase transitions and morphology characterization of composite electrodes
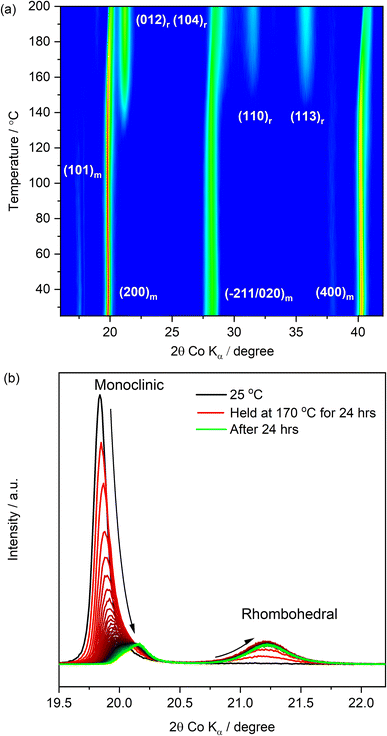
The characterization of the PW powders and the analysis of their dehydration behaviour allowed a comprehensive understanding of the experimental conditions needed for the dehydration and the handling of the PW material. By using a drying temperature of 170 °C for 48 hours under dynamic vacuum (10−2 mbar), water was successfully removed with the obtainment of powders exhibiting a dominance of the rhombohedral phase, which is known to show more promising electrochemical performance in sodium-ion cells.34In order to understand if the same experimental conditions could be applied to water-processed PW electrodes obtained by using the pristine (undried) PW in its monoclinic phase, in situ XRD as a function of temperature was performed on electrode coatings prepared using a water-based process (see Experimental section) eliminating the use of NMP solvent. The results are reported in Fig. 4.
Fig. 4(a) shows the evolution of the XRD patterns of a PW-based electrode undergoing a heat treatment from room temperature (25 °C) up to 200 °C under dynamic vacuum (10−2 mbar). It is shown that upon dehydration, the reflection associated to the rhombohedral phase increases at the expense of the dominant monoclinic reflection (characterising the pristine electrode). The (101)m reflection located at ∼17.47° (2θ, Co Kα) and attributed to the monoclinic phase, decreases in intensity and disappears at about ∼110 °C. The dominant peak at ∼19.73° (200)m persists and gradually decreases in intensity upon heating especially after 160 °C, maintaining a lower intensity with a slightly shifted position even at the higher dehydration temperature of 200 °C. A similar behaviour is also observed for the (400)m reflection at ∼40.22°, which decreases in intensity and shifts to a higher angle upon heating. Additionally, the monoclinic reflections (−211/020)m at ∼28.17° shift to higher angles and transition into a single rhombohedral reflection (104)r as the temperature increases. Interestingly, the initial monoclinic feature, which is the distinct double peak feature in the pristine powder (see Fig. 2(a)), appears as a convoluted broader peak for the pristine electrode, which becomes a single broad peak at about 160 °C. Simultaneously, as the monoclinic reflections decrease in intensity, formation of the rhombohedral phase is denoted by the appearance of the (012)r reflection at ∼140 °C with enhanced intensity as the temperature is increased. Additional rhombohedral reflections are observed at ∼31.45° (110)r and ∼38.73° (113)r highlighting a phase transition towards the rhombohedral phase upon dehydration. Clearly, even by employing a higher dehydration temperature of 200 °C, a complete dehydration of the electrode is not achieved, as demonstrated by the presence of both monoclinic and rhombohedral phases, confirming that the kinetics and the experimental conditions play a crucial role in the dehydration process. To investigate potential kinetic effects due to the heating rate, another electrode was then heated up to 170 °C and the temperature was held for 24 hours. The XRD pattern evolution during the hold step is reported in Fig. 4(b). After 24 hours, a complete dehydration was not achieved also in this case, suggesting that dehydration of composite electrodes processed in water is more challenging when compared to powders.
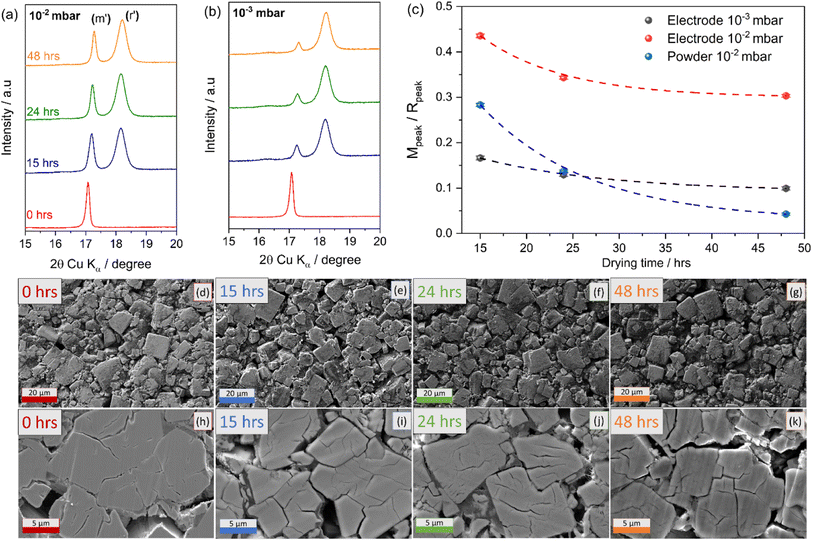
To facilitate water removal from the composite electrodes, two different vacuum conditions during the dehydration process were compared, i.e., 10−2 and 10−3 mbar at 170 °C. As with the initial tests conducted on powders, electrodes were dried for 15, 24 and 48 hours. XRD patterns of the investigated electrodes are reported in Fig. 5.
Fig. 5(a) and (b) shows that by using a vacuum pressure of 10−3 mbar during the dehydration process the monoclinic phase decreases sharply after only 15 hours, with a dominance of rhombohedral phase after 48 hours similar to the behaviour observed for powders (see Fig. 1) using a vacuum pressure of 10−2 mbar.
A pseudo-quantitative analysis of the monoclinic to rhombohedral transformation was performed by calculating the area under the peaks of the two strongest reflections between ∼17 and 19° (2θ, Cu Kα) (Fig. 5(a) and (b)). Considering that the intensity of each of the peaks has only contribution from a single phase (monoclinic or rhombohedral),29 it is reasonable to approximate the area of the peak with the amount of that phase. The ratio of intensities thus obtained can be used to track the monoclinic to rhombohedral transformation. The calculation has been performed for the powders, and the electrodes dried under two different vacuum conditions. The results reported in Fig. 5(c), clearly indicate that the dehydration process is more difficult for composite electrodes and that an improved vacuum system accelerates the transition from monoclinic to rhombohedral phase. The fitted XRD patterns and corresponding fitting lattice parameters are reported in Fig. S3 and Table S2 in the ESI.†
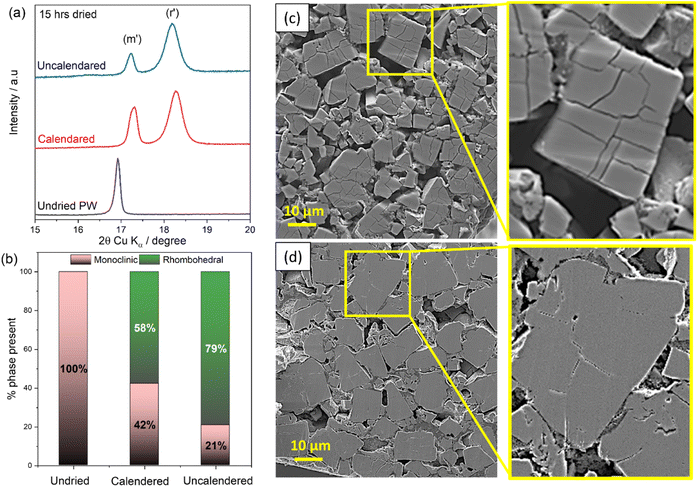
In addition, SEM analysis was carried out to investigate the effect of the dehydration process on the electrode microstructure. Similar morphologies were seen in the planar SEM images for the different electrodes as shown in Fig. 5(d)–(g) highlighting the compactness of the electrode particles. However, the cross-section analysis, reported in Fig. 5(h)–(k) reveals that upon dehydration cracks appear on the PW particles propagated linearly as the drying duration increased. Consequently, the removal of water during drying resulted in more cracks on the crystal surface. The effect, already observed at the powder level (SEM images in Fig. 1) is more pronounced for composite electrodes, indicating that optimal conditions for a successful dehydration process are crucial and need to take into account the structural stability of the electrode to avoid delamination. It is worth mentioning, that the dehydration conditions employed here, i.e., 170 °C at 10−3 mbar for 48 hours might lead to deleterious effects in terms of electrode stability especially for high loading and might depend on the manufacturing method employed to obtain electrodes. Indeed, an interesting effect of dehydration has been observed when comparing the dehydration process of calendered vs. uncalendered electrodes. It is found that calendering, hinders the dehydration process, suggesting longer drying times or higher temperatures are required for the successful transition toward the rhombohedral phase.
Fig. 6(a) reports the XRD patters of calendered (30% porosity target) and uncalendered PW-electrodes dried for 15 hours at 170 °C (10−3 mbar). It is shown that calendered electrodes exhibits about 42% of monoclinic phase after 15 hours of dehydration, while uncalendered electrode present a dominance of the rhombohedral phase relatively to the monoclinic (79% vs. 21%) (see Fig. 6(b)). The more efficient dehydration process occurring for the uncalendered electrodes is also visible from the cross-sectional SEM images reported in Fig. 6(c) and (d). Indeed, when water is removed more efficiently from the bulk structure of the electrodes (lower packing density), more visible cracks are observed within the electrode particles (see Fig. 6(c)), while for the calendered electrode, given the less effective dehydration, less cracks are detected.
3.3. Evaluation of electrochemical properties of PW-based electrodes in sodium cells
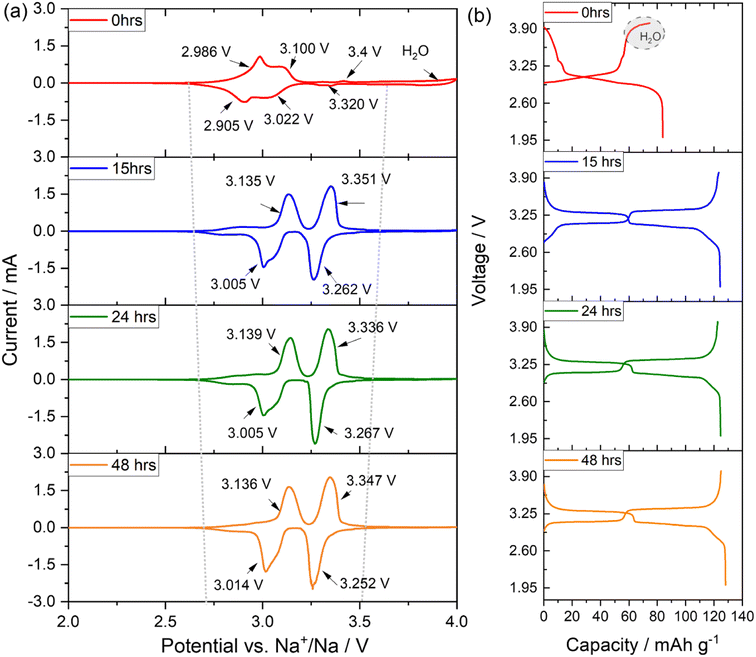
To assess the electrochemical behaviour on the investigated PW-based electrodes, cyclic voltammetry has been performed in three electrode cells between 2.0 and 4.0 V versus Na+/Na at a scan of 0.1 mV s−1.The voltammograms, reported in Fig. 7(a) shows that the pristine undried electrode (0 hours) exhibits a broad reversible convoluted redox process at about 3.0 V vs. Na+/Na with an irreversible oxidative reaction occurring at potentials higher than 3.8 V vs. Na+/Na attributable to water decomposition.27 Upon dehydration, conducted at 170 °C under dynamic vacuum at 10−2 mbar, the voltage profile clearly changes, showing already for the electrode dried for 15 hours a net separation of two reversible contributes at about 3.13/3.01 V and 3.35/3.26 V vs. Na+/Na associated to the redox activity of the high-spin Fe2+/Fe3+ (bonding to N), and the low-spin Fe2+/Fe3+ (bonding to C), respectively. Indeed, the presence of water in the structure strongly influences the activity of the low spin Fe2+/Fe3+redox couple, which is instead activated upon dehydration.15,34,38,39 With a longer drying process (see CV for electrodes dried for 24 and 48 hours), the shape of the voltammogram does not dramatically change, however the overall polarization decreases, and the second redox reaction becomes more pronounced when compared to the contribution of the high spin Fe2+/Fe3+. The CV results are also confirmed by galvanostatic cycling tests performed to investigate the sodium ion storage behaviour in the different electrodes. Fig. 7(b) shows that the pristine undried sample exhibits an initial sloping region during the first de-sodiation (charge) process up to about 3.1 V, followed by a sharp increase of the voltage profile up to 3.8 V, when a plateau like feature appears confirming the presence of water and its consequent oxidative decomposition. The material presents a charge capacity of about 75 mA h g−1 and a discharge capacity of about 84 mA h g−1, suggesting removal of ∼1 equivalent of sodium during the first de-sodiation and the ability to store more sodium upon sodiation (discharge). Electrodes dried for longer, show a very different voltage profile exhibiting two distinct plateaus, a more reversible charge/discharge process, a decreased polarization, and a higher charge/discharge capacity of about 130 mA h g−1. In the high voltage region, ranging from 3.3 to 4.0 V, some differences are observed upon increasing drying time. Fig. S4† shows an extracted enlarged view of the high voltage region. It is observed that, for the electrode dried 15 hours a sloping region is visible above 3.8 V indicating the presence of residual water. The electrode dried for 24 hours show a similar profile, however the electrode dried for 48 hours clearly shows a sharper increase of the voltage profile toward the upper cut off (4.0 V) and a slightly larger de-sodiation capacity. Besides, upon prolonged drying, the gain in capacity is not substantial. To investigate the effect of dehydration upon cycling further galvanostatic cycling test have been conducted.
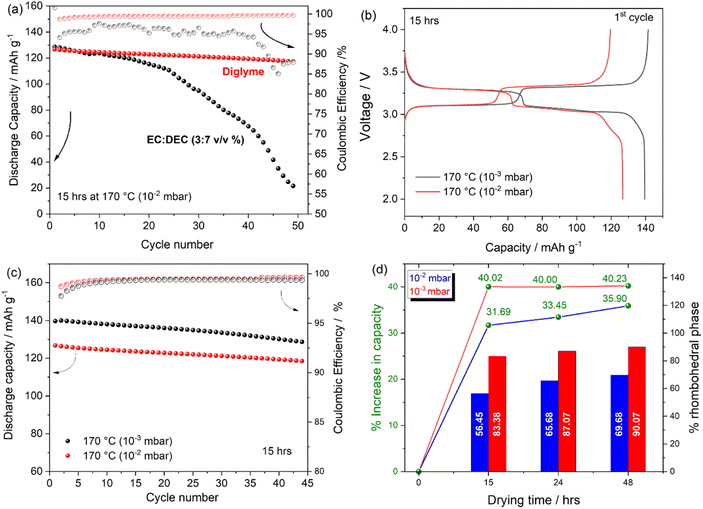
Fig. 8(a) reports the cycling stability and coulombic efficiency (CE) trend of Na half cells containing PW electrode dried at 170 °C (10−2 mbar) cycled using a carbonate-based (black curve) and a glyme-based (red curve) electrolyte solution. The carbonate containing cell exhibits poor cycling performance both in terms of cycling stability and CE. The poor electrochemical response is attributable to the unstable Na metal/electrolyte interphase40,41 when using carbonate-based solvents rather than the electrode material itself. Indeed, by using a glyme-based electrolyte, CE is strongly improved as well as the cycling stability (92.6% capacity retention after 45 cycles) suggesting less parasitic reactions at the Na/electrolyte interface.42 Accordingly, all further results have been conducted by using the glyme-based systems. The effect of the vacuum pressure during the dehydration step has been investigated electrochemically. Voltage profile and cycling stability are reported in Fig. 8(b) and (c), respectively. It is clearly observed that by using the same dehydration temperature, i.e., 170 °C, higher charge/discharge capacity of 140 mA h g−1 can be obtained when adopting a vacuum pressure of 10−3 mbar. Both CE and cycling stability are not strongly affected by the two different vacuum conditions, with capacity fade upon cycling being independent of the vacuum conditions, however with a substantial effect in terms of delivered capacity. A comparative analysis of the percentage gain in capacity upon dehydration has been correlated to the relative amount of rhombohedral phase present in the electrode compared to the pristine monoclinic phase. Fig. 8(d) shows that when adopting a vacuum pressure of 10−2 mbar, an increase from 0% to 56.45%, 65.68% and 69.68% is observed when drying electrodes for 15, 24 and 48 hours respectively, corresponding to a percentage increase in capacity relatively to the capacity delivered by the pristine undried (100% monoclinic phase, 83.6 mA h g−1 ± 4.6) of 31.69% (122.3 mA h g−1 ± 3.9), 33.45% (125.6 mA h g−1 ± 1.9) and 35.69% (130.4 mA h g−1 ± 3.5) respectively. On the other hand, when adopting a vacuum pressure of 10−3 mbar, beside the initial 40% increase in capacity (compared to the pristine undried electrode), obtained after 15 hours of drying (139.5 mA h g−1 ± 0.4), the increase in capacity observed after 24 and 48 hours of drying is not substantial in agreement with the small variation of rhombohedral phase calculated upon a prolonged dehydration. Given the higher efficiency of the dehydration process conducted at 10−3 mbar, a lower drying temperature has also been tested. Fig. S5† reports the voltage profile of Na-half cells containing PW electrodes dried under a dynamic vacuum of 10−3 mbar at 150 °C and 170 °C. Beside the slightly different charge capacity observed for the electrode dried at 150 °C, exhibiting a lower charge capacity and a slopy voltage profile above 3.8 V attributable to the decomposition of residual water, the discharge capacity delivered by the two electrodes is rather similar, suggesting that with improved vacuum conditions the drying temperature can also be decreased, which might be beneficial in terms of final electrode structural stability especially for high loading electrodes.
Overall, the results suggest that a tailored combination of temperature, time and vacuum pressure are crucial for an efficient dehydration of PW based electrodes, with vacuum pressure being more influential compared to temperature and time.
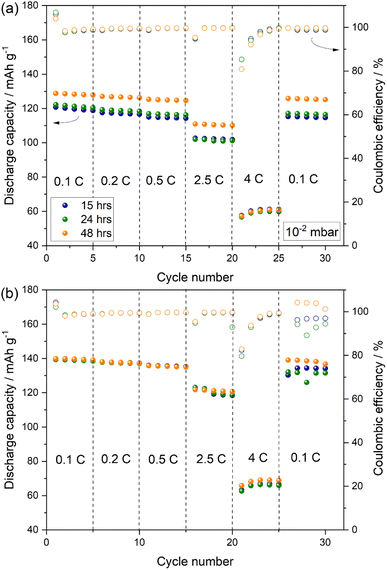
Indeed, the observation is further supported by rate capability tests performed on Na-half cells using PW-based electrodes dried at 170 °C for different drying time under a dynamic vacuum of 10−2 and 10−3 mbar.
Fig. 9 shows that when using a vacuum pressure of 10−2 mbar, the drying time influences the delivered capacity especially at lower rate up to 2.5C, while at 4C a comparable performance is observed with capacities dropping by almost 50% (see Fig. 9(a)). On the other hand, when adopting a vacuum pressure of 10−3 mbar (Fig. 9(b)), an optimal capacity of about 140 mA h g−1 is obtained after 15 hours of drying, with no substantial increase upon prolonged drying time at all cycling rates.
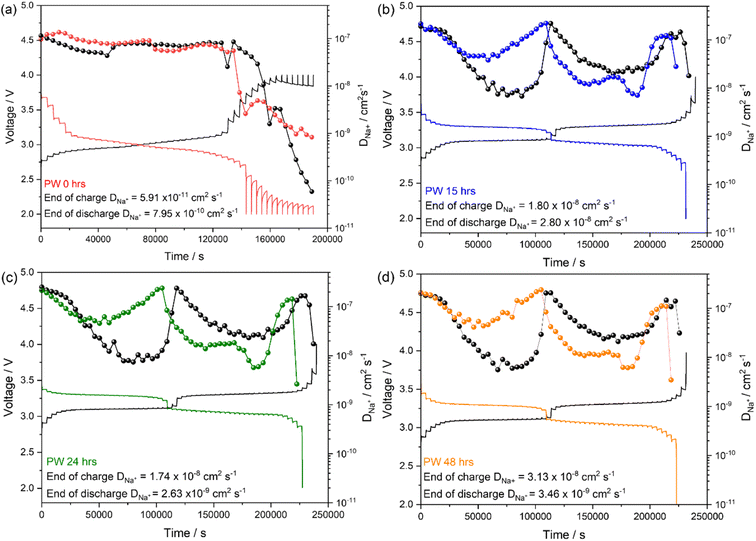
Galvanostatic intermittent titration technique (GITT) was performed to analyse the kinetic of the Na+ diffusion in the PW electrodes dried for the different durations under a dynamic vacuum of 10−3 mbar.
The method, equations and parameters used to calculate the diffusion coefficient are reported in the ESI (see Fig. S6 and Table S3†). The undried PW presents Na+ diffusion coefficient (DNa+) values in the order of 10−8 cm2 s−1 both upon charge and discharge, with sluggish kinetics at the end of the de-sodiation and sodiation processes obtaining orders of magnitude in the ranges of ∼10−11 cm2 s−1 and ∼10−10 cm2 s−1 respectively (Fig. 10(a)). Interestingly, the dehydrated samples present DNa+ values in the order of 10−8 to 10−7 cm2 s−1 in the plateau regions associated to the high spin and low spin Fe2+/Fe3+redox process, respectively (Fig. 10(b)–(d)). It is worth noting that interstitial water occupies the same sites of Na+ ions in the PW structure, thus one would expect that by dehydration, Na+ ion diffusion would be facilitated. However, it is also worth considering that the rate capability data reported in Fig. 9 do not exhibit substantial differences among the three electrodes, suggesting similar diffusion kinetics. The observation can then be related to the microstructure of the electrode. Indeed, upon dehydration, more cracks were observed on the electrode particles (see Fig. 5) which might hinder diffusion of Na+ ions. Hence, even if more interstitial sites are made readily available after dehydration, the simultaneous generation of structural cracks upon drying limits the potential enhancement in the overall diffusion kinetics.
4. Conclusion
The presence of water in PW systems plays a crucial role in defining the corresponding electrochemical response upon sodium ion storage. In this study, we have carried out a comprehensive characterisation of the structural and morphological changes occurring upon dehydration and have correlated the environmental conditions of the dehydration process with the phase transitions occurring upon water removal.Moreover, while most of the current research has focussed on the understanding of the dehydration at the material level, in this study we further push the investigation from solely active materials to composite electrodes processed in water. It is found that water removal is a kinetically driven process that is strongly affected by the experimental conditions (e.g., temperature, heating rate, atmosphere) and the environment of the PW system (powder vs. composite electrode).
The results indicate that the dehydration process is more complex for composite electrodes compared to pristine powders, highlighting the delayed transition from the hydrated monoclinic to the dehydrated rhombohedral phase when a low vacuum pressure is employed.
Beside the structural changes detected upon water removal, dehydration is also found to have a great impact on the electrode microstructure. Cross-section analysis reveals that upon dehydration cracks appear on the PW particles and propagate linearly as the drying duration increased. The effect, also observed for powders is more pronounced for composite electrodes especially the uncalendered ones. The generated cracks also affect sodium ions diffusion paths as highlighted by GITT results which do not highlight substantial changes in terms of kinetics of ions diffusion upon prolonged drying time. Overall, it is found that when using efficient vacuum conditions, temperatures ranging between 150 °C and 170 °C can be used to efficiently remove large part of the adsorbed and interstitial water in 15 hours transitioning to a material with a dominance in rhombohedral phase exhibiting capacity value of 140 mA h g−1. Further improvement in capacity can be obtained with longer drying times or higher temperature, however considering the high mass loading employed in this study this could impact the structural integrity of the electrode, which instead might not be an issue for lower loadings.
Author contributions
F. M. Maddar: investigation, data acquisition, formal analysis, writing original draft; D. Walker: in situ XRD data acquisition; T. W. Chamberlain: formal analysis and data curation for XRD data, review and editing; J. Compton: supporting electrochemical data acquisition, review and editing; A. S. Menon: discussion on analysis of ex situ XRD data; M. Copley: funding acquisition, review and editing; I. Hasa: supervision, conceptualization, methodology, project administration, funding acquisition, review and editing.Conflicts of interest
There are no conflict of interest to declare.Acknowledgements
This work has received funding from the European Union's Horizon 2020 research and innovation programme under Grant Agreement no. 883753 (Sodium-Ion and Sodium Metal Batteries for efficient and sustainable next-generation energy storage – SIMBA project). We thank Anton Paar for the loan of the XRDynamic 500 instrument used for the in situ XRD measurements. The non-ambient X-ray diffraction measurements were made using equipment provided by the University of Warwick X-ray Diffraction Research Technology Platform. D. W. acknowledges funding from EPSRC grant EP/V007688/1. We would also kindly thank Zach Clarke and Shaun Dixon for providing experimental facility support for the different vacuum systems employed throughout this work. I. H. and F. M. M. are grateful to Prof. Reza Younesi and Dr Ronnie Mogensen (founders of Altris AB and SIMBA project partners) for the insightful discussions on the PW material.References
- C. Delmas, Adv. Energy Mater., 2018, 8, 1703137 CrossRef.
- J.-M. Tarascon, Nat. Chem., 2010, 2, 510 CrossRef CAS PubMed.
- E. A. Olivetti, G. Ceder, G. G. Gaustad and X. Fu, Joule, 2017, 1, 229–243 CrossRef.
- P. Alves Dias, D. Blagoeva, C. Pavel and N. Arvanitidis, Cobalt: demand-supply balances in the transition to electric mobility, Publications Office of the European Union, Luxembourg, 2018 Search PubMed.
- J. F. Peters, A. Peña Cruz and M. Weil, Batteries, 2019, 5, 10 CrossRef CAS.
- European Commission, COM(2019) 640 Final, 2019, 53, 24.
- I. Hasa, N. Tapia-Ruiz and M. Galceran, Frontiers in Energy Research, 2022, 10, 1076764 CrossRef.
- A. Rudola, A. J. R. Rennie, R. Heap, S. S. Meysami, A. Lowbridge, F. Mazzali, R. Sayers, C. J. Wright and J. Barker, J. Mater. Chem. A, 2021, 9, 8279–8302 RSC.
- Y. Li, Y. S. Hu, X. Qi, X. Rong, H. Li, X. Huang and L. Chen, Energy Storage Mater., 2016, 5, 191–197 CrossRef.
- Y.-S. Hu and Y. Li, ACS Energy Lett., 2021, 6, 4115–4117 CrossRef CAS.
- Contemporary Amperex Technology Co. Ltd, https://www.catl.com/en/news/685.html.
- Natron Energy, https://natron.energy/.
- TIAMAT, http://www.tiamat-energy.com/.
- I. Hasa, S. Mariyappan, D. Saurel, P. Adelhelm, A. Y. Koposov, C. Masquelier, L. Croguennec and M. Casas-Cabanas, J. Power Sources, 2021, 482, 228872 CrossRef CAS.
- Z.-Y. Chen, X.-Y. Fu, L.-L. Zhang, B. Yan and X.-L. Yang, ACS Appl. Mater. Interfaces, 2022, 14, 5506–5513 CrossRef CAS PubMed.
- X. Tang, H. Liu, D. Su, P. H. L. Notten and G. Wang, Nano Res., 2018, 11, 3979–3990 CrossRef CAS.
- C. Li, R. Zang, P. Li, Z. Man, S. Wang, X. Li, Y. Wu, S. Liu and G. Wang, Chem.–Asian J., 2018, 13, 342–349 CrossRef CAS PubMed.
- S. Adak, M. Hartl, L. Daemen, E. Fohtung and H. Nakotte, J. Electron Spectrosc. Relat. Phenom., 2017, 214, 8–19 CrossRef CAS.
- Q. Liu, Z. Hu, M. Chen, C. Zou, H. Jin, S. Wang, S.-L. Chou, Y. Liu and S.-X. Dou, Adv. Funct. Mater., 2020, 30, 1909530 CrossRef CAS.
- M. Pasta, R. Y. Wang, R. Ruffo, R. Qiao, H.-W. Lee, B. Shyam, M. Guo, Y. Wang, L. A. Wray, W. Yang, M. F. Toney and Y. Cui, J. Mater. Chem. A, 2016, 4, 4211–4223 RSC.
- Y. You, X.-L. Wu, Y.-X. Yin and Y.-G. Guo, Energy Environ. Sci., 2014, 7, 1643 RSC.
- C. Yan, A. Zhao, F. Zhong, X. Feng, W. Chen, J. Qian, X. Ai, H. Yang and Y. Cao, Electrochim. Acta, 2020, 332, 135533 CrossRef CAS.
- X. Wu, Y. Luo, M. Sun, J. Qian, Y. Cao, X. Ai and H. Yang, Nano Energy, 2015, 13, 117–123 CrossRef CAS.
- R. Chen, Y. Huang, M. Xie, Z. Wang, Y. Ye, L. Li and F. Wu, ACS Appl. Mater. Interfaces, 2016, 8, 31669–31676 CrossRef CAS PubMed.
- J. Song, L. Wang, Y. Lu, J. Liu, B. Guo, P. Xiao, J.-J. Lee, X.-Q. Yang, G. Henkelman and J. B. Goodenough, J. Am. Chem. Soc., 2015, 137, 2658–2664 CrossRef CAS PubMed.
- J. Hu, H. Tao, M. Chen, Z. Zhang, S. Cao, Y. Shen, K. Jiang and M. Zhou, ACS Appl. Mater. Interfaces, 2022, 14, 12234–12242 CrossRef CAS PubMed.
- W. Wang, Y. Gang, J. Peng, Z. Hu, Z. Yan, W. Lai, Y. Zhu, D. Appadoo, M. Ye, Y. Cao, Q. F. Gu, H. K. Liu, S. X. Dou and S. L. Chou, Adv. Funct. Mater., 2022, 32, 2111727 CrossRef CAS.
- P. Wang, Y. Li, D. Zhu, F. Gong, S. Fang, Y. Zhang and S. Sun, Dalton Trans., 2022, 51, 9622–9626 RSC.
- W. R. Brant, R. Mogensen, S. Colbin, D. O. Ojwang, S. Schmid, L. Häggström, T. Ericsson, A. Jaworski, A. J. Pell and R. Younesi, Chem. Mater., 2019, 31, 7203–7211 CrossRef CAS.
- A. Rudola, K. Du and P. Balaya, J. Electrochem. Soc., 2017, 164, A1098 CrossRef CAS.
- I. Nielsen, D. Dzodan, D. O. Ojwang, P. F. Henry, A. Ulander, G. Ek, L. Häggström, T. Ericsson, H. L. B. Boström and W. R. Brant, JPhys Energy, 2022, 4, 44012 CrossRef.
- B. H. Toby and R. B. Von Dreele, J. Appl. Crystallogr., 2013, 46, 544–549 CrossRef CAS.
- W.-J. Li, C. Han, G. Cheng, S.-L. Chou, H.-K. Liu and S.-X. Dou, Small, 2019, 15, 1900470 CrossRef PubMed.
- L. Wang, J. Song, R. Qiao, L. A. Wray, M. A. Hossain, Y. De Chuang, W. Yang, Y. Lu, D. Evans, J. J. Lee, S. Vail, X. Zhao, M. Nishijima, S. Kakimoto and J. B. Goodenough, J. Am. Chem. Soc., 2015, 137, 2548–2554 CrossRef CAS PubMed.
- D. O. Ojwang, M. Svensson, C. Njel, R. Mogensen, A. S. Menon, T. Ericsson, L. Häggström, J. Maibach and W. R. Brant, ACS Appl. Mater. Interfaces, 2021, 13, 10054–10063 CrossRef CAS PubMed.
- J. Cattermull, M. Pasta and A. L. Goodwin, Mater. Horiz., 2021, 8, 3178–3186 RSC.
- S. He, J. Zhao, X. Rong, C. Xu, Q. Zhang, X. Shen, X. Qi, Y. Li, X. Li, Y. Niu, X. Li, S. Han, L. Gu, H. Liu and Y.-S. Hu, Chem. Eng. J., 2022, 428, 131083 CrossRef CAS.
- J. Sun, H. Ye, J. A. S. Oh, A. Plewa, Y. Sun, T. Wu, Q. Sun, K. Zeng and L. Lu, Energy Storage Mater., 2021, 43, 182–189 CrossRef.
- Y. Liu, Y. Qiao, W. Zhang, Z. Li, X. Ji, L. Miao, L. Yuan, X. Hu and Y. Huang, Nano Energy, 2015, 12, 386–393 CrossRef CAS.
- D. I. Iermakova, R. Dugas, M. R. Palacín and A. Ponrouch, J. Electrochem. Soc., 2015, 162, A7060–A7066 CrossRef CAS.
- J. Conder and C. Villevieille, Chem. Commun., 2019, 55, 1275–1278 RSC.
- K. Westman, R. Dugas, P. Jankowski, W. Wieczorek, G. Gachot, M. Morcrette, E. Irisarri, A. Ponrouch, M. R. Palacín, J. M. Tarascon and P. Johansson, ACS Appl. Energy Mater., 2018, 1, 2671–2680 CrossRef CAS.
Footnote |
| † Electronic supplementary information (ESI) available. See DOI: https://doi.org/10.1039/d3ta02570e |
| This journal is © The Royal Society of Chemistry 2023 |

