 Open Access Article
White light thermoplasmonic activated gold nanorod arrays enable the photo-thermal disinfection of medical tools from bacterial contamination†
Federica
Zaccagnini
 a,
Piotr
Radomski
 b,
Maria Laura
Sforza
 a,
Pawel
Ziółkowski
 b,
Seok-In
Lim
c,
Kwang-Un
Jeong
 c,
Dariusz
Mikielewicz
 b,
Nicholas P.
Godman
d,
Dean R.
Evans
 d,
Jonathan E.
Slagle
d,
Michael E.
McConney
d,
Daniela
De Biase
d,
Jonathan E.
Slagle
d,
Michael E.
McConney
d,
Daniela
De Biase
 a,
Francesca
Petronella
 *e and
Luciano
De Sio
 *a
*a
aDepartment of Medico-Surgical Sciences and Biotechnologies Sapienza University of Rome, Latina, Italy. E-mail: luciano.desio@uniroma1.it
bGdansk University of Technology, Faculty of Mechanical Engineering and Ship Technology, Energy Institute, Poland
cDepartment of Polymer-Nano Science and Technology, Department of Nano Convergence Engineering, Jeonbuk National University, Jeonju, Republic of Korea
dAir Force Research Laboratory, Materials and Manufacturing Directorate, Wright-Patterson Air Force Base, Ohio, USA
eNational Research Council of Italy, Institute of Crystallography CNR-IC, Montelibretti, Rome, Italy. E-mail: francesca.petronella@ic.cnr.it
First published on 19th June 2023
Abstract
The outspread of bacterial pathogens causing severe infections and spreading rapidly, especially among hospitalized patients, is worrying and represents a global public health issue. Current disinfection techniques are becoming insufficient to counteract the spread of these pathogens because they carry multiple antibiotic-resistance genes. For this reason, a constant need exists for new technological solutions that rely on physical methods rather than chemicals. Nanotechnology support provides novel and unexplored opportunities to boost groundbreaking, next-gen solutions. With the help of plasmonic-assisted nanomaterials, we present and discuss our findings in innovative bacterial disinfection techniques. Gold nanorods (AuNRs) immobilized on rigid substrates are utilized as efficient white light-to-heat transducers (thermoplasmonic effect) for photo-thermal (PT) disinfection. The resulting AuNRs array shows a high sensitivity change in refractive index and an extraordinary capability in converting white light to heat, producing a temperature change greater than 50 °C in a few minute interval illumination time. Results were validated using a theoretical approach based on a diffusive heat transfer model. Experiments performed with a strain of Escherichia coli as a model microorganism confirm the excellent capability of the AuNRs array to reduce the bacteria viability upon white light illumination. Conversely, the E. coli cells remain viable without white light illumination, which also confirms the lack of intrinsic toxicity of the AuNRs array. The PT transduction capability of the AuNRs array is utilized to produce white light heating of medical tools used during surgical treatments, generating a temperature increase that can be controlled and is suitable for disinfection. Our findings are pioneering a new opportunity for healthcare facilities since the reported methodology allows non-hazardous disinfection of medical devices by simply employing a conventional white light lamp.
Introduction
Disinfection of harmful microorganisms is crucial in safeguarding household, public, and healthcare premises1 and, until recent years, has been an effective tool for preventing and controlling infectious diseases. The Covid-19 pandemic highlighted the issues related to contact transmission and raised awareness of the importance of environmental hygiene for human safety. The 2022 Healthcare Cleaning Forum has underlined the crucial role of innovations like digitalization, tracking, automated disinfection, and antimicrobial surfaces, focusing on the sustainability of the newly adopted innovative solutions.1 Routine cleaning and disinfection of healthcare structures and instruments could lower the viruses and bacteria transmission among patients and through objects, tools, or surfaces. Consequently, implementing antimicrobial mechanisms for frequently reused surfaces is of increasing interest. Antimicrobial surfaces can be realized, for instance, by adding coatings of different materials and producing biocidal agents with other techniques: the most common technologies are anti-adhesive surfaces, contact-active surfaces, or light-activated molecules.2Disinfection methods can be classified as chemical and physical. The first category employs chemical agents, called biocides or germicides, that kill microorganisms interfering with their essential enzymes. Alternatively, physical disinfection methods involve using heat or radiation to eliminate microorganisms contaminating the surfaces. At sufficiently high temperatures, heat can lead to sterilization, thus removing all forms of life, including microorganisms. Chemical disinfection techniques may encounter practical difficulties since the antimicrobial compounds can cause skin and mucosal surfaces irritation and/or have an unpleasant smell; furthermore, they can be potentially flammable or cause deterioration or corrosion of metals. The usage of safer products, such as quaternary ammonium compounds (also known as quats or QACs), is not adequate for all kinds of bacteria and viruses, and the development of microbial persistence mechanisms has been reported to occur following exposure to sublethal levels of these compounds.3,4 These methods typically cause cell surface alteration, and changes in cell membrane permeability, causing damage to the intracellular constituents. Despite the high efficiency, reactions triggered by chemical disinfectants may produce toxic disinfection by-products, which can develop resistance traits such as generalised resistance (persistence or ability to form biofilms) or specific resistance (specific antibiotic resistance), as well as increasing human cancer risk.5 Commonly used physical-chemical disinfection methods include (but are not limited to) the use of ozone, chlorine dioxide, free chlorine, UV irradiation,6 Fenton and photo-Fenton reactions,7 semiconductor-assisted photocatalysis8 and hydrogen peroxide plus UV processes.9 These techniques come under the umbrella term of advanced oxidation processes (AOP) that make use of a physical trigger such as electromagnetic radiation to generate reactive oxygen species (ROS) (e.g., hydroxyl radicals ˙OH) and superoxide radical anions (˙O2−)). ROS can provoke the degradation of organic molecules by giving rise to a sequence of oxidation reactions that can potentially cause the mineralization of the target organic compound, such as lipidic components of the cell membranes.8 Although highly effective toward bacteria and virus inactivation, AOP processes have drawbacks, including the need for costly energy sources and chemical compounds to produce ROS. Therefore, the scientific community is very active in developing and augmenting new strategies and materials that can trigger AOP disinfection processes by solar or visible light irradiation.8,10,11
Since the XIX century, Luis Pasteur introduced a paradigm shift by demonstrating the effectiveness of heating to disinfect and sterilize surgical instruments, dressing, objects, and liquids.12 Today, the progress in nanomaterials synthesis and characterization has paved the way for using light as a cost-effective and sustainable energy source to generate highly localized heat through PT agents. PT agents are light absorbers that convert light energy, of a suitable frequency, to heat. They often cause controlled and localized hyperthermia-producing protein denaturation to promote microorganism PT disinfection.13 PT disinfection is a physical disinfection method that, unlike photocatalysis, does not involve the trigger of (photo)chemical reactions but is only based on the heat produced by the PT agents.
Plasmonic nanomaterials can offer outstanding opportunities for achieving PT disinfection if used as PT agents. In particular, metal nanoparticles (NPs) exhibit excellent PT properties, providing a high light-to-heat conversion efficiency.14 Such a property arises from the Localized Surface Plasmon Resonance (LSPR) phenomenon that occurs when an electromagnetic radiation impinges on a metal NP with a particular frequency that is in resonance with one of the collective electronic oscillations of the nanomaterial. The light absorption is enhanced and confined close to the NP surface. Conduction electron oscillations increase the frequency of collisions with the lattice atoms resulting in Joule heating (thermoplasmonic effect). Therefore, the optical energy of metal NPs is converted into thermal energy with high efficiency and then released to the surrounding environment.15
Noble metal NPs such as gold (Au),13 silver (Ag),14 and copper (Cu)15 are extensively used as PT agents for disinfection because their resonance frequency lies in the visible range,16 making the process sustainable and cost-effective, unlike organic compounds that require UV light to generate heat.10 Among noble metal NPs, AuNPs benefit from several properties, including high PT efficiency, excellent biocompatibility, and chemical stability. Moreover, available synthesis methods currently allow tuning AuNP morphology and surface chemistry according to the desired chemical-physical properties and applications.17 Loeb et al. performed PT disinfection experiments using AuNPs having similar sizes but different shapes. Their work demonstrated a higher PT disinfection efficiency for Au nanorods (AuNRs) compared to Au nanocubes, highlighting AuNRs' excellent performance as nano-heaters and for broadband light sources.18 AuNRs are elongated NPs that, due to their peculiar morphology, are excellent candidates in several application fields, including biosensing,19,20 drug delivery,21 photocatalysis,22 tumour ablation by PT therapy,23,24 and PT disinfection.25
AuNRs were also employed as building blocks in nanocomposites to realize devices for PT disinfection. AuNRs embedded in polydimethylsiloxane, an optically transparent and non-toxic silicone polymer, were used for fabricating microfluidic channels with a high PT response and water disinfection capabilities.26 Loeb et al. coated the glass coverslip of a solar reactor with PT nanomaterials (AuNRs and carbon black) to enhance water disinfection capabilities. Their results highlighted the significant contribution of AuNRs that display their PT properties in the Near Infrared (NIR) range, leading to a temperature increase 78% higher than the temperature increase achieved with only carbon black under solar irradiation.27 However, the reactor structure is designed for bulk water disinfection. Thus, the contributions of carbon black and high-density AuNRs to the generation of heat are more relevant despite the absence of an optical signal caused by the carbon black double layer opacity and to the spectrum broadening due to the AuNR aggregates.
In this work, we intend to take a step forward in the field of PT disinfection by tackling the challenge of achieving bacteria killing under white light irradiation. To this end, we exploit the extraordinary capability of an array of AuNRs firmly deposited on a glass substrate using a controlled electrostatic Layer-by-Layer (eLbL) assembly method. The resulting highly dense and well-monodispersed AuNRs array possesses a large absorption cross-section, making them promising candidates for broadband energy conversion through a PT process. Our experimental results, supported by a solid theoretical analysis, demonstrate that, under the investigated experimental conditions, white light irradiation of the AuNRs array produced a temperature increase suitable for achieving white light-triggered disinfection. We show that our highly efficient plasmonic platforms can be effectively utilized in healthcare facilities, allowing the white light-assisted thermal disinfection of different surgical instruments.
Experimental
Materials
Citrate-capped AuNRs having size 55 nm × 15 nm (AuNRs) were purchased from Nanocomposix. Acetone, isopropanol, methanol, sodium hydroxide (NaOH), poly(sodium 4-styrenesulfonate)(PSS, Mw ∼70 kDa), and poly(allylamine hydrochloride)(PAH, Mw ∼50 kDa) were purchased from Merck. Deionized water was used to prepare the colloidal dispersions of AuNRs and the polyelectrolyte solutions.Escherichia coli (E. coli) K12 MG1655 CGSC#7740 was obtained from the Coli Genetic Stock Centre (CGSC) collection. The minimal medium E supplemented with 0.40% glucose was used for bacterial growth. The chemicals required for preparing the bacterial growth medium were purchased from Merck or VWR International. LIVE/DEADTM BacLightTM Bacterial Viability Kit for microscopy was purchased from Thermo Fisher Scientific.
Immobilization of AuNRs on glass substrates
The incorporation of AuNRs on glass substrates was achieved following the procedure reported in ref. 28. Briefly, 1 cm × 1 cm sized glass substrates were thoroughly washed in an ultrasonic bath for 10 min by using, sequentially, methanol and acetone. An intermediate rinsing step in isopropanol was carried out between the two washing steps. Finally, the glass substrates were stored in isopropanol, rinsed, and dried under a stream of nitrogen before use. Before fabricating the polyelectrolyte (PE) multilayer, the substrates were immersed for 30 min in a 5 M NaOH solution to impart a negative charge triggering the electrostatic incorporation of the first positively charged PE. PEs were deposited using eLbL by following the sequence: PAH-PSS-PAH. Accordingly, the building of the PE multilayer was performed by sequentially immersing the glass substrate in PAH, PSS, and PAH solutions for 10 min. In particular, the concentration of the PE solution was 1.6 mg mL−1, and the pH was 2 for the PAH solution and 8 for the PSS, respectively. In-between two consecutive immersion steps, an intermediate washing step was performed (2 min immersion in water) to remove the excess of PE molecules. Finally, a final step of a 2 min immersion in water was carried out to avoid the counterion effect.29 The substrates were then dried under a stream of nitrogen and stored in a refrigerator (+4 °C). Subsequently, the PE functionalized glass substrates were immersed for 16 h in a colloidal dispersion of AuNRs (suitably diluted to obtain an optical density of 1 at 790 nm). After this step, the AuNRs-modified substrates were washed with water and gently dried under a stream of nitrogen before their characterization.Sensitivity to the refractive index variation and photo-thermal characterization
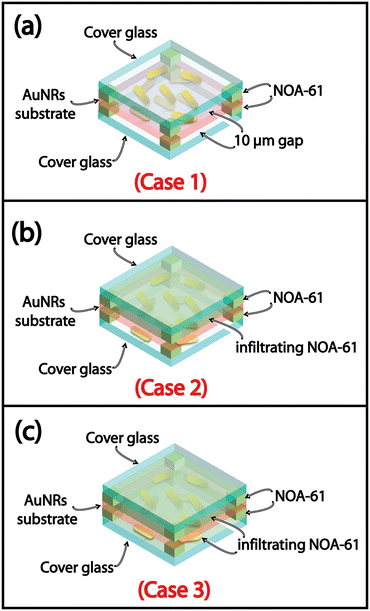
A double-face glass cell was used to investigate the optical response of the AuNR-modified substrates to the alteration of the refractive index (n) of the infiltrating medium. This configuration was suitably selected to study the optical and the PT behavior of the AuNR-modified substrates in two different conditions: (i) when only one side of the substrate underwent a n variation, and (ii) when both sides of the AuNRs substrate experienced an n variation.To this end, a cell was fabricated, such that the AuNR substrate was sandwiched between two glass slides (1.2 cm × 1.2 cm). First, to ensure a uniform 10 μm gap between the plasmonic substrate and the two glass slides, the glue NOA-61 with 10 μm glass microbeads was deposited on the corners of the AuNRs substrate on both sides. Then the AuNRs substrate was placed in between the two glass slides. After that, the cell was sealed by exposing it to UV light radiation for 1 min. At this stage, the first side of the resulting cell was infiltrated with the NOA-61 as a representative medium with a known n. Subsequently, the absorption spectrum was collected, and the PT measurements were performed. The same procedure was performed after infiltrating the second side of the double-face cell.
White light disinfection
The ability of the AuNR modified substrates to achieve surface disinfection, induced by white light irradiation, was investigated utilizing E. coli cells as a model bacterium.AuNR substrates were immersed in 500 μL of a 104 CFU mL−1E. coli cells dispersion in minimal E (with no glucose). After 30 min, the substrate, contaminated with E. coli cells, was dried under a stream of nitrogen. The substrate was then characterized by absorption spectroscopy and irradiated with white light (14.7 W cm−2 for 10 min) by using the experimental setup described in section 2.5.4. After irradiation, the substrates were inspected by fluorescence microscopy using propidium iodide as a staining agent. The staining was realized by immersing the sample for 10 min in 500 μL minimal E with 2 μL fluorescent dye propidium iodide. The substrate was dried under a stream of nitrogen before microscopy analysis. Control experiments used SYTO 9TM as a staining agent for identifying viable cells.
Characterizations
Results and discussion
AuNRs substrate characterization and white light photo-thermal response
AuNPs exhibit a strong LSPR effect and are tunable according to size, shape, and surface chemistry. Au is a noble metal with good biocompatibility that enables interaction with biological entities such as human cells and bacteria without affecting their viability.30 AuNRs are an optimal model for studying white light thermoplasmonic properties from a theoretical and experimental perspective. AuNRs exhibit an absorption cross-section higher than Au Nanospheres (AuNSs).31 Indeed, in the absorption spectrum of AuNRs, the transverse plasmon band can be assimilated to the absorption peak of AuNSs having a diameter equal to the thickness of AuNRs. Such absorption signal is much less intense than the longitudinal plasmon band, thus accounting for the lower absorption cross-section of AuNSs consequently, the less efficient thermoplasmonic conversion efficiency. Therefore, among AuNPs, AuNRs possess an excellent light-to-heat conversion ability, having a PT efficiency of 100% when irradiated at their resonance frequency (monochromatic light source), usually in the NIR range.32 The NIR light is a significant component of the white light source and solar spectrum; thus, exploiting this spectral range can open an opportunity to realize solar-light thermoplasmonic disinfection. Such an outstanding property inspired the goal of the present work. Here, we aim to push the borders of PT conversion efficiency to visible light by investigating AuNR-based platforms able to generate thermal energy upon white light irradiation. In addition, we also exploit the white light PT heating to achieve PT disinfection by using E. coli as a model pathogen to simulate a form of surface contamination.The immersive eLbL method was used for the fabrication of the AuNR-based plasmonic platforms. The procedure relies on the electrostatic interactions involving a negatively charged glass substrate, PEs, and AuNRs. In particular, the AuNR substrates were obtained by performing 3 steps: (i) activation of the glass substrate, (ii) construction of a PE multilayer by eLbL, and (iii) incorporation of AuNRs. The glass surface activation was achieved by immersing it in NaOH. The PE multilayer was realized by alternating a weak positively charged PE (PAH), and a strong negatively charged PE (PSS), giving rise to the sequence PAH–PSS–PAH. A multilayer PE architecture, instead of a monolayer, is suitable for obtaining a high density of AuNRs. Indeed, it was already reported that the amount of deposited NPs increases with the number of PE layers underlying the NPs array.33,34 In addition, the number of PE layers increases the roughness of the substrate,35 providing a high number of charged sites available for anchoring AuNRs. Finally, beyond the electrostatic attraction, the PEM multilayer assembly is also driven by an overcompensation effect, namely an excess of surface charges not paired with those in the underlying layer. Therefore, a multilayer, instead a monolayer, provides a higher surface charge number,36 resulting in a higher AuNRs density.
After that, 16 hours of immersion in an AuNRs colloidal dispersion promoted the incorporation of the plasmonic NPs on the glass surface. In this step, a colloidal AuNRs dispersion with O.D. 1 was used.
Our preliminary experiments demonstrated that the O.D. 1 is suitable for obtaining AuNR substrates with optimal optical properties under the investigated experimental conditions. This value was carefully selected after performing several preliminary experiments consisting of immersion of the PEM-modified glass substrates in AuNRs at different O.Ds. Using a colloidal dispersion with an O.D. less than 1 resulted in substrates with a low amount of AuNRs. Conversely, by exceeding the O.D. 1, no significative increase in the AuNRs density on the substrates was detected. These results suggested that under the investigated experimental conditions, the underlying PAH layer can host only a limited number of AuNRs.
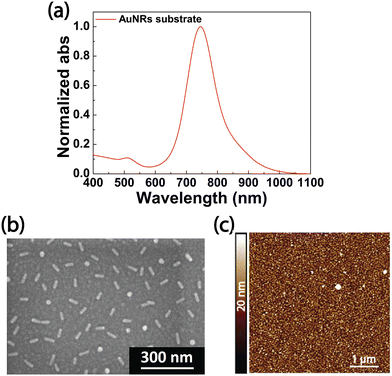
Fig. 1a reports the optical characterization performed by absorption spectroscopy of the resulting AuNRs substrate. It reveals the presence of two peaks corresponding to the transverse (LSPRt) and longitudinal (LSPRl) plasmon modes due to the LSPR phenomenon. The LSPRt peak is centered at 515 nm and much less intense than the LSPRl peak, located at lower energy, namely at 764 nm. The absorption spectrum (Fig. 1a) suggests that the optical properties of the AuNRs array on a glass substrate resemble the ones of AuNR colloidal dispersions where AuNRs are monodisperse due to their peculiar physiochemical features. Remarkably, the spectral response of the sample was acquired by using a bare glass substrate as a baseline. Considering, instead, the glass functionalized with PEM as the baseline, no variation is introduced in the absorption spectrum of the AuNRs substrate. Indeed, the PE multilayer shows an absorption peak in a wavelength range lower than 300 nm. In this spectral range, the glass substrate exhibits a very intense absorption (see Fig. S1, ESI†), thus overlapping the contribution of the PE multilayer. The morphology of the AuNRs substrate (Fig. 1b), analyzed by SEM, pointed out an even AuNRs distribution, where AuNRs are well separated from each other, with no formation of aggregates. Such a result is ascribable to the PE multilayer that confers a uniform charge distribution on the glass substrate. The PE solutions were prepared in the absence of salts. Accordingly, we expect the PAH layer to display a stretched structure that fosters the incorporation of AuNRs occurring through electrostatic attractions involving the positively charged amine groups of the PAH and the negatively charged citrate molecules on the AuNRs surface.
Moreover, from the SEM micrographs analysis, it is computed that AuNR substrates have a fill fraction of 5.9% ± 0.3% and an interparticle distance of (120 ± 22) nm. The topographic investigation performed with AFM is consistent with this hypothesis. Indeed, as displayed in Fig. 1c, the 2D AFM image of the AuNRs substrate shows a uniform distribution of asperities, having an average height profile of ∼10 nm corresponding to the short axis of the NRs, in agreement with the generation of AuNRs monolayer.
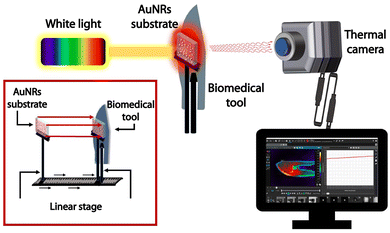
Remarkably, the absorption spectrum of the AuNRs substrate shows the most intense LSPRl band between 600 nm and 900 nm. This absorption signal overlaps the white light source spectrum, as shown in Fig. 2a, which displays an intense signal in the wavelength range from 400 nm to 900 nm. Accordingly, the PT performance of AuNR substrates under white light was investigated using the optical setup described in Fig. 2b; it uses a white light beam that uniformly illuminates the entire sample area at normal incidence (Fig. 2c). During irradiation, a high-resolution thermal camera recorded the temperature profile and the spatial heating distribution on the sample surface in a defined region of interest (ROI). The short distance (1 cm) between the AuNRs substrate and the optical fiber maintains the light beam's convergence.
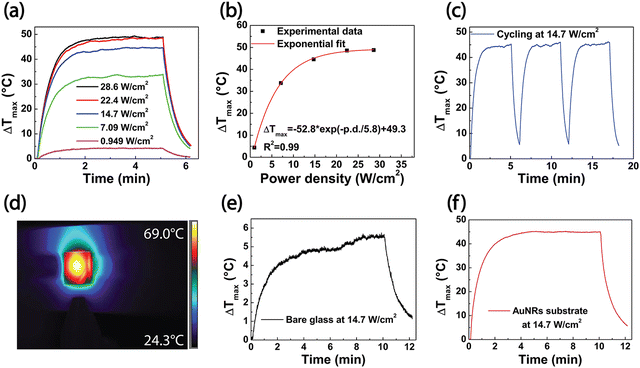
The experimental results from the PT investigation of the AuNR substrates under white light irradiation are reported in Fig. 3. In this set of experiments, the AuNR substrates were illuminated for 5 min. The subsequent shutdown of the white light source allowed the sample to cool down for 2 min. The PT response of AuNR substrates was investigated by varying the power density of the white light source in a range from 0.949 W cm−2 to 28.6 W cm−2. The analysis of the resulting thermographic images gave rise to the plot in Fig. 3a, reporting the maximum temperature increase (ΔTmax) as a function of irradiation time. Independently from the power density, Fig. 3a shows a progressive (exponential) temperature increase during the first 2 min of the 5 min irradiation, followed by a gradual decrease when the light source was turned off. Such a result is consistent with experiments carried out under laser light irradiation for colloidal dispersion of AuNRs37 and for AuNRs immobilized on glass substrates28 or embedded in polymeric matrices.38
Fig. 3b reports the ΔTmax values as a function of the light source power density. Experimental results highlight that 5 min of white light irradiation can produce an appreciable temperature increase when the power density is higher than 5 W cm−2. Indeed, when the minimum light source power density was set at 0.949 W cm−2, a ΔTmax of 4.44 °C was measured, while the maximum ΔTmax value rose to 49.3 °C when the power density increased to 28.6 W cm−2. Selecting a power density of 14.7 W cm−2, the ΔTmax achieved was 44.7 °C. This temperature increase value corresponds to a Tmax of 69 °C, suitable for performing the white light disinfection process in a proper time interval of 10 min. Such a temperature value is above the one identified in the paper by Annesi et al. (65 °C) for promoting a reduction of 2![[thin space (1/6-em)]](https://www.rsc.org/images/entities/char_2009.gif) log CFU of E. coli population (more than 90% in viability reduction) after 7.5 min of AuNRs NIR laser illumination.39 Accordingly, in our experimental conditions, we selected a white light irradiation time of 10 min as a suitable timeframe to induce PT disinfection. For this reason, the power density of 14.7 W cm−2 was chosen as a reference value for further PT experiments of characterization and disinfection.
log CFU of E. coli population (more than 90% in viability reduction) after 7.5 min of AuNRs NIR laser illumination.39 Accordingly, in our experimental conditions, we selected a white light irradiation time of 10 min as a suitable timeframe to induce PT disinfection. For this reason, the power density of 14.7 W cm−2 was chosen as a reference value for further PT experiments of characterization and disinfection.
The fitting of the experimental ΔTmax values as a function of the power density, reported in Fig. 3b, indicated that the power density increase of the white light source produces an exponential rise of ΔTmax, according to the equation:
 | (1) |
Moreover, cycling experiments were carried out in three consecutive irradiation cycles on the same substrate at a power density of 14.7 W cm−2. Results reported in Fig. 3c proved the PT stability of the samples. Indeed, the same value of the ΔTmax was attained in each cycle. A representative thermographic image of the AuNRs substrate under white light irradiation, shown in Fig. 3d, provides evidence of the uniform heating distribution on the sample's surface. A control experiment was performed by irradiating a bare glass substrate with the white light source, applying a power density of 14.7 W cm−2 for 10 min. The resulting time vs. ΔTmax profile, in Fig. 3e, yields a ΔTmax of 5 °C, reaching a maximum temperature (Tmax) of 30 °C after 10 min of irradiation. When the same experiment was carried out by irradiating the AuNRs substrate, a Tmax of 69 °C and a ΔTmax of 44.7 °C were achieved (Fig. 3f), which is in complete agreement with the values reported in Fig. 3a. Such a ΔTmax value is 87.3% higher than the ΔTmax of the bare glass slide, thus demonstrating the ability of AuNRs substrate to convert white light into thermal energy efficiently. AuNRs are excellent PT transducers because they can entirely absorb the impinging EM radiation due to the LSPR phenomenon. An important figure of merit to evaluate the PT properties of the AuNR substrates is the PT conversion efficiency, ηheat, defined as the ratio of the increased internal energy to the total incident radiation. Assuming that the PT experiments were performed at constant room temperature and with uniform white light irradiation, the following expression can be calculated, as typically reported for nanofluids:40
 | (2) |
Assuming the specific heat capacity of borosilicate glass of 779.7 J kg−1 °C−1, the PT efficiency for bare glass and AuNRs substrate are 5.50% and 43.5%, respectively; they are calculated according to the data shown in Fig. 3e and f, for a broadband illumination of 10 min at a power density of 14.7 W cm−2, and estimated at a wavelength of 600 nm (see Fig. 2a) on a glass substrate of 1 cm × 1 cm with a mass of 0.212 g.
AuNRs substrate sensitivity to refractive index change
The AuNRs immobilization protocol discussed in section 2.2 was implemented to deliberately deposit AuNRs on both sides of the glass substrate in a one-shot process. However, a possible strategy for further improving the PT properties of the resulting thermoplasmonic substrates can involve the variation of the n of the infiltrating medium. It is well known that the photo-induced temperature increase is also related to the overall n of the chemical environment experimented with by the plasmonic NPs.43 In the present section, we report and discuss the result of an experiment specifically designed to investigate the effect of the n variation on the AuNRs substrate optical response in two different conditions. In the first, a non-uniform n variation is achieved by varying the n of only one face of the AuNRs substrate. In the second, a uniform n variation is obtained by varying the n of both faces of the AuNRs substrate.Hence, the sensitivity of the AuNR samples was studied by separating the upper and lower sides of the AuNR substrates. To this end, a double face glass cell reported in Fig. 4a was fabricated and infiltrated either with air (Case 1) or with a high n medium, on one side as reported in Fig. 4b (Case 2) and on both sides 4c (Case 3). The glue, NOA-61, was selected as a high n infiltrating medium (n = 1.56).
The optical and PT characterization was performed on these three different cases (Fig. 4).
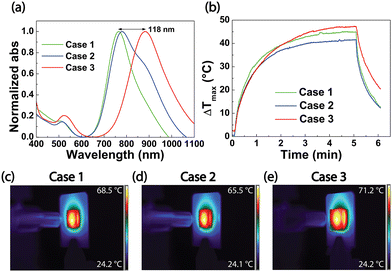
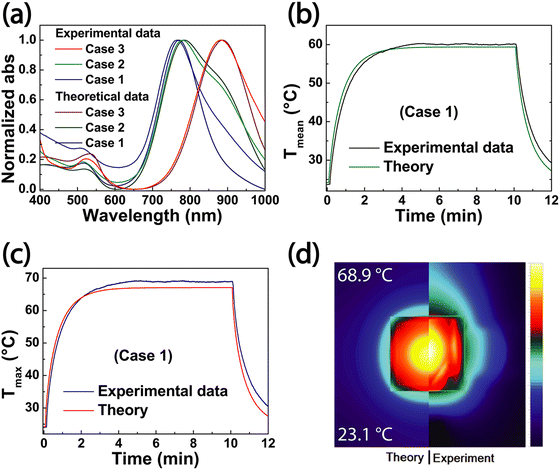
The absorption spectra in Fig. 5a demonstrate that the LSPRl position, initially at 766 nm for AuNRs substrate (Case 1), varied only 14 nm in the non-uniform infiltration of NOA-61 (Case 2). Still, a shoulder is evident at 882 nm. When both the faces were infiltrated with NOA-61, the LSPRl band peaked at 882 nm resulting in a total red-shift of 118 nm (Case 3). This peculiar spectroscopic behavior indicates that the cell absorption spectrum results from the contributions of the sample's two sides. The condition identified as Case 2 of the experiment is characterized by different ns for each side, namely an uneven n variation. In other words, the AuNRs array experienced a n variation on one side and a n preservation on the other, resulting in a 14 nm low red shift of the LSPRl position, along with the shoulder at 882 nm. Conversely, in Case 3, both sides of the substrate underwent the same n variation, resulting in a well-defined absorption peak at 882 nm and, therefore, in a greater LSPRl shift of 118 nm. It is possible to infer that the shoulder accounts for the AuNRs, deposited on the first face that experiences the n variation caused by the NOA-61. Meanwhile, the uniform distribution of NOA-61 on both faces of the AuNRs substrate gave rise to a symmetric LSPRl signal.
Moreover, white light PT experiments were performed by irradiating the sample in Cases 1, 2, and 3. Time-temperature plots are reported in the green (Case 1), blue (Case 2), and red (Case 3) traces of Fig. 5b. The thermal camera recorded 5 min of illumination at a power density of 14.7 W cm−2 plus 1 min with the beam turned off. The temperature increase is greater for Case 3 than for Case 1; therefore, a temperature increase was observed for a higher n of the surrounding medium. The ΔTmax measured for Case 3 is elevated by about 2.3 °C with respect to Case 1, as expected from theoretical investigations.44 Meanwhile, ΔTmax is lower (−3.4 °C) in Case 2 with respect to Case 1.
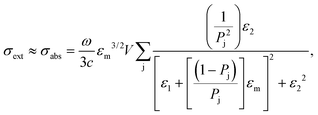
The increase in temperature is dependent on the light source for its intensity, I, and on the AuNRs for the absorption cross-section of the sample σabs, the thermal conductivity km, the shape-correction factor β, and the equivalent radius of a sphere having the same volume of the nanorod Req,45 as described the eqn (3):
 | (3) |
Moreover, the absorption cross-section of the AuNRs substrate depends on the n of the surrounding medium through its dielectric constant:
 | (4) |
Theoretical modelling of the optical and photo-thermal properties
The theoretical simulations were performed following two approaches to confront the experimental results. The first concerns the analytical solutions of the optical cross sections specified by Rayleigh–Drude approximation,46,47 whereas the second part considers the temperature distributions obtained via CFD simulations. The substrate effect is included following Yamaguchi's48 and Rocher's49 approaches, assuming that symmetrically arranged nanorods are ∼98.5 nm for x- and ∼78.5 nm for Z-axes away from one another. The complete calculations and all the theoretical details are provided in the ESI.†Optical properties
From a theoretical point of view, absorption spectra are strongly dependent on the absorption coefficient of each material. Different formulas govern the absorption coefficient for continuous media and nanostructures that will be investigated. Hence, including the Gaussian size and shape distribution of AuNRs, the general equation for absorbance, Abs, assumes: | (5) |
 | (6) |
 | (7) |
The disagreement below 450 nm can be attributed to Rayleigh approximation that works under condition  . For lower λ values, Mie theory is necessary to describe the multipoles interactions in each AuNRs. Above 800 nm, a substrate effect might play a crucial role. Indeed, the utilized equation48 assumes a flat substrate. However, in the experimental cases, the different areas of the substrates do not fulfill the assumption. This inhomogeneity cannot be easily included in the theoretical calculation and could introduce the disagreement between the experimental and theoretical curves for longer wavelengths (Fig. 6a).
Photo-thermal properties
The heat transfer simulations were obtained only for Case 1, using the experimental parameters (white light irradiation, 14.7 W cm−2 for 10 min). This work introduces the approach where ŠTOTe, ŠNPe, and ŠMe are treated as the converted heat from incident electromagnetic energy,50 including Gaussian size and shape distributions, as follows: | (8) |
Boundary conditions are based on adiabatic conditions and mixed (radiation and convection) conditions on the surfaces where the lamp impinges. Due to the lack of some parameters about the NOA61 glue, epoxy resin's properties have been assumed, which can be found in the ESI.† Transient simulations follow the SIMPLE algorithm and the second-order computational scheme for the (Y.1)–(Y.3) equations. The calculations have been performed via Ansys.Fluent software (version 22.1) using the Tryton supercomputer possessing 72 cores (Intel®Xeon®Processor E5 v3@2.3 GHz). The control parameters are established at 0.5 except for pressure and density, whose values equal 0.3. Spatial and time independence are verified and obtained via Richardson and Roache extrapolations.51
Fig. 6b and c report the time-temperature profiles obtained for average (Fig. 6b) and maximum (Fig. 6c) for the theory and the experiments. Fig. 6d shows a corresponding visual comparison of the temperature distributions.
A good agreement between theory and experiments is worth observing, except for a slight mismatch. This difference can be ascribed to the fact that the experimental thermal characterization utilizes a thermal camera that also measures possible irregularities not present in the theoretical model. In addition, another potential difference can be ascribed to the difference in the boundary conditions since a perfect symmetrical assumption was considered in the theoretical part.
White light photo-thermal disinfection
Thermoplasmonic white light disinfection is expected to be a valuable alternative to conventional disinfection induced by irradiation with UV light. Moreover, white light sources are safer for human health and the environment than UV light sources. The germicidal UV lamps show emissions between 200 and 280 nm (UV-C). Although effective for disinfection, as UV-C light sources emit at 254 nm, they can induce several injuries, including sunburn, skin cancer, photokeratitis, retinal damages,52,53 and corneal damages,54 as this wavelength can damage DNA. UV-C radiation is also used in domestic air purifiers for air disinfection. Such wavelengths produce ozone, a molecule harmful to the environment but can also adversely affect the respiratory system.55 Moreover, the UV-light sources are more expansive with respect to white light sources. Our work, conversely, aims at demonstrating for the first time that it is possible achieving disinfection by using a white light source that is safer for health and the environment and more affordable with respect to UV lamps.To demonstrate the extraordinary capability of AuNR substrates to perform white light-assisted PT bacteria disinfection, experiments were carried out as follows:
AuNR substrates were immersed in an E. coli solution containing 104 CFU mL−1 concentration for 30 min.
The substrates were then irradiated for 10 min under white light to induce the PT killing of E. coli cells.
The samples were immersed for 10 min in minimal E medium with the fluorescent dye Propidium Iodide to detect dead cells by fluorescence microscopy.
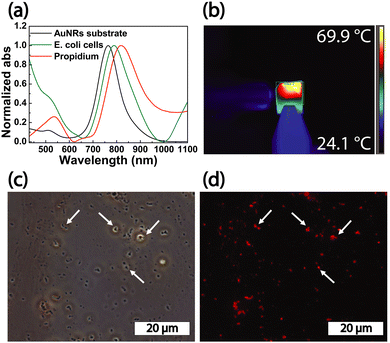
The absorption spectroscopy analysis of the substrate (Fig. 7a, black curve) performed after step 1 revealed a 10 nm red shift of the LSPRl (Fig. 7a, green curve), accounting for the presence of E. coli cells on the substrate. After steps 2 and 3, the absorption spectrum highlighted a 35 nm red shift (Fig. 7a, red curve) associated with the presence of propidium iodide dye, that rises the n of the medium, responsible for an additional peak at 500 nm. The white light PT disinfection experiments were performed at a power density of 14.7 W cm−2 for 10 min providing a maximum temperature value of 69.9 °C (Fig. 7b) sufficient to kill E. coli cells.39 After the white light disinfection experiment, the substrate was investigated by contrast phase microscopy. The high magnification image (Fig. 7c) showed spots with high contrast that can be associated with the presence of E. coli cells characterized by their typical elongated morphology. By investigating the same area by fluorescence microscopy, spots with red fluorescence appeared (Fig. 7d). These features were detected in the same position occupied by the higher contrast spots. They, therefore, can be safely associated with dead E. coli cells stained with propidium iodide dye. Accordingly, we can safely point out that under the investigated experimental conditions, the PT properties of AuNRs substrate are suited to achieve the white light disinfection of the substrate contaminated by E. coli cells.
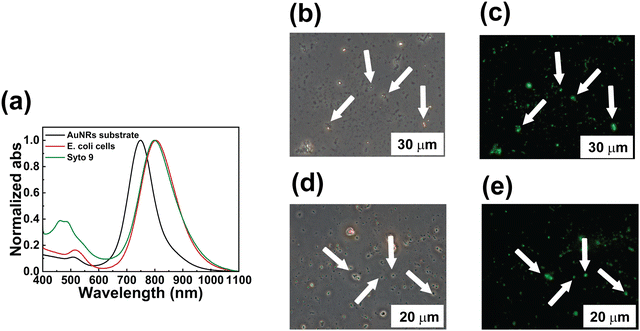
Control experiments were performed without white light-assisted PT disinfection in verifying the AuNR substrate's biocompatibility and to further support the results reported in Fig. 7. The AuNRs substrate (a fresh sample) was immersed in 104 CFU mL−1E. coli cells solution for 30 min and, subsequently, for 10 min in Minimal E with fluorescent dye SYTO 9 that only binds to live bacteria cells. The absorption spectroscopy analysis reported in Fig. 8a (AuNRs sample, black curve; AuNRs sample + E.coli cells, red curve) shows an overall red-shift of about 55 nm (Fig. 8a, green curve) after the experimental steps, plus the peak of the absorption of the green fluorescent dye. Contrast phase (Fig. 8b and d) and fluorescent micrographs (Fig. 8c and e) acquired at different magnifications show a distribution of high contrast and green spots, respectively, corresponding to the live E. coli cells, thus demonstrating that the bacteria killing can be achieved only under proper irradiation conditions and cannot be ascribed to the mere contact with the AuNRs substrate.
Disinfection of medical tools from bacterial contamination
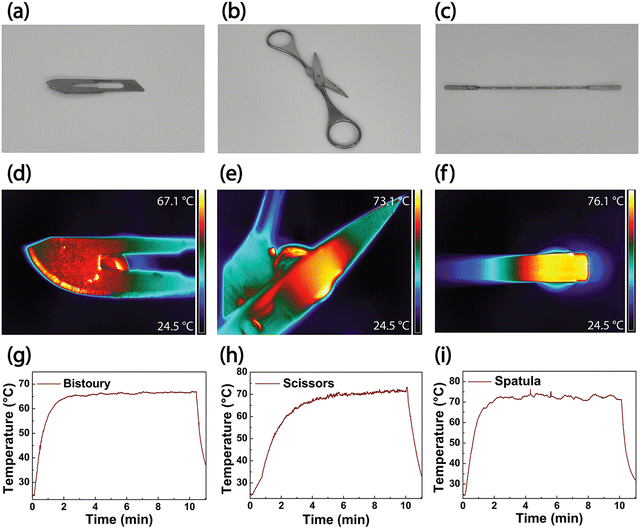
Nanotechnology plays a pivotal role in improving the performance of disinfection applications. AuNRs can convert the absorbed visible light into heat. As a result, the plasmonic platform constituted by AuNRs array deposited on a glass substrate acquires self-disinfectant abilities, under irradiation. The PT properties of AuNR substrates can be exploited to disinfect close surfaces through heat conduction, using the samples as PT transducers.Biomedical tools used in surgery must be frequently sterilized, and the PT properties of AuNR substrates can be used for this purpose. This work developed a thermo-optical setup for testing AuNRs substrates' ability to achieve white light photothermal disinfection of biomedical tools. The optical setup (Fig. 9) was realized so that the AuNRs substrate is brought in close contact with the specific tool, and the illumination (heating generation) is performed through the AuNRs substrate. In this way, it is possible to avoid the direct deposition of AuNRs on the biomedical tool that has to be disinfected. The selected metallic biomedical devices are a bistoury, scissors, and a spatula (Fig. 10a–c, respectively). The disinfection ability of the platform is applied to the tools' surface through heat conduction that requires few minutes of illumination from a white light source to provide a uniform temperature distribution according to the thickness and shape of the instruments. The PT experiments were performed by irradiating the samples for 10 min using the white light source (14.7 W cm−2). The thermal camera measurements were collected on the back of the tools to verify the heat distribution through the thickness of the devices. High-temperature values of 67.1 °C, 73.1 °C, and 76.1 °C are respectively achieved in the areas of interest: the bistoury, the scissors, and the spatula in Fig. 10d–f, respectively. The corresponding temporal plots in Fig. 10g–i show how the different thicknesses impact the temperature rise: the maximum value is obtained after 2 min of irradiation of the bistoury and the spatula, while it requires almost 5 min for the thicker scissors. The temperature values and the heating distribution point out that the plasmonic substrate's disinfection properties can be effectively transferred to other metallic tools. The achieved temperature values are suitable for producing bacterial and viral disinfection, as previously demonstrated in Fig. 7. Although the power density used in the present work is relatively high, our results pave the way to a valuable alternative to conventional disinfection methods. However, ongoing and future studies are devoted to developing a novel hybrid NPs generation with higher photothermal efficiency56 in the visible spectrum.
Conclusions
In this work, we have reported a low-cost, reproducible white light-triggered PT transducer (thermo-plasmonic based) for energy-saving and facile bacteria disinfection. It exploits the properties of an AuNRs array adsorbed on a glass substrate through the immersive eLbL method enabling the PT disinfection of E. coli cells. Refractive index sensitivity experiments have demonstrated that both sides of the substrate are functionalized with AuNRs as a result of the immersive method. Thus, the absorption spectrum is given by both sides becoming highly sensitive to the AuNRs environment. The viability tests on E. coli cells have demonstrated that the plasmonic platform is biocompatible and that bacteria cell death is only due to white light irradiation. Moreover, the PT efficiency of 43.5% obtained under white light illumination confirms the effective contribution of AuNRs array PT properties. Theoretical and experimental comparisons reveal good agreement, thus strengthening the experimental output in terms of n sensitivity and PT capabilities. Using the AuNR samples as white light-activated PT transducers, several medical tools such as a bistoury, scissors, and spatula have been illuminated and then thermally disinfected. Our findings are pioneering a new opportunity for healthcare facilities since the reported methodology allows non-hazardous disinfection of medical devices by simply using a conventional white light lamp. Our results pave the way for exploiting the PT properties of plasmonic NPs to achieve bacterial disinfection under solar light irradiation, thus pioneering a new solution for more environmentally friendly and affordable disinfection procedures, also improving the life quality in less developed countries.Author contributions
FZ performed the photo-thermal experiments and analysed the data; PR, PZ, and DM implemented the theoretical studies; MLS prepared the AuNR substrates; SL, KJ realized the SEM and AFM characterization; NG, DE, JS, and MM provided support and feedback on samples realization and characterization; DD, provided and prepared the bacteria culture; FP designed the methodology, performed the experiments, and supervised the work; LD conceived and formulated the idea, supervised the project, and acquired the funds. FZ, FP, and LD wrote the manuscript.Conflicts of interest
There are no conflicts to declare.Acknowledgements
This work has been supported: by the “NATO - Science for Peace and Security Programme (SPS-G5759, NANO-LC)”; by the Air Force Office of Scientific Research, Air Force Material Command, U.S. Air Force. “Digital optical network encryption with liquid-crystal grating metasurface perfect absorbers” FA8655-22-1-7007 (P. I. L. De Sio, EOARD 2022-2025); by the Italian PON project TITAN “Nanotechnology for cancer immunotherapy”, 2021–2023 ARS01_00906. P. Radomski, P. Ziółkowski, and D. Mikielewicz acknowledge the support of the National Science Centre in Poland under the project “Shape and displacement optimization of gold nanorods in the killing chamber in order to phototermoablation processes”, no UMO-2021/43/D/ST8/02504. Heat transfer computations were carried out using the computers of Centre of Informatics Tricity Academic Supercomputer & Network (TASK).References
- S. Mohapatra, Essentials of Neuroanesthesia, 2017, pp. 929–944 DOI:10.1016/B978-0-12-805299-0.00059-2.
- W. Bäumler, D. Eckl, T. Holzmann and W. Schneider-Brachert, Crit. Rev. Microbiol., 2022, 48, 531–564 CrossRef PubMed.
- B. Z. Lakicevic, H. M. W. Den Besten and D. De Biase, Front. Microbiol., 2021, 12, 738470 CrossRef PubMed.
- Environmental Health & Safety, (accessed 27/03/2023).
- M. Cho, J. Kim, J. Y. Kim, J. Yoon and J. H. Kim, Water Res., 2010, 44, 3410–3418 CrossRef CAS PubMed.
- Z. T. Hu, Y. Chen, Y. F. Fei, S. L. Loo, G. Chen, M. Hu, Y. Song, J. Zhao, Y. Zhang and J. Wang, Sci. Total Environ., 2022, 837, 155720 CrossRef CAS PubMed.
- S. Giannakis, T. M. Le, J. M. Entenza and C. Pulgarin, Water Res., 2018, 143, 334–345 CrossRef CAS PubMed.
- I. De Pasquale, C. Lo Porto, M. Dell’Edera, F. Petronella, A. Agostiano, M. L. Curri and R. Comparelli, Catalysts, 2020, 10, 1382 CrossRef CAS.
- D. J. Weber, W. A. Rutala, D. J. Anderson, L. F. Chen, E. E. Sickbert-Bennett and J. M. Boyce, Am. J. Infect. Control, 2016, 44, e77–84 CrossRef CAS PubMed.
- F. Petronella, A. Truppi, T. Sibillano, C. Giannini, M. Striccoli, R. Comparelli and M. L. Curri, Catal. Today, 2017, 284, 100–106 CrossRef CAS.
- N. López-Vinent, A. Cruz-Alcalde, G. Moussavi, I. del Castillo Gonzalez, A. Hernandez Lehmann, J. Giménez and S. Giannakis, Chem. Eng. J., 2022, 450, 137904 CrossRef.
- G. Birgand, R. Ahmad, A. N. H. Bulabula, S. Singh, G. Bearman, E. C. Sánchez and A. Holmes, Lancet, 2022, 400, 2250–2260 CrossRef PubMed.
- G. M. Santos, F. I. d S. Ferrara, F. Zhao, D. F. Rodrigues and W.-C. Shih, Opt. Mater. Express, 2016, 6, 1217–1229 CrossRef CAS.
- S. Maity, L. N. Downen, J. R. Bochinski and L. I. Clarke, Polymer, 2011, 52, 1674–1685 CrossRef CAS.
- L. Jauffred, A. Samadi, H. Klingberg, P. M. Bendix and L. B. Oddershede, Chem. Rev., 2019, 119, 8087–8130 CrossRef CAS PubMed.
- Z. Tang, D. Ma, Q. Chen, Y. Wang, M. Sun, Q. Lian, J. Shang, P. K. Wong, C. He, D. Xia and T. Wang, J. Hazard. Mater., 2022, 437, 129373 CrossRef CAS PubMed.
- I. Hammami, N. M. Alabdallah, A. A. Jomaa and M. Kamoun, J. King Saud Univ., Sci., 2021, 33, 101560 CrossRef.
- S. Loeb, C. Li and J.-H. Kim, Environ. Sci. Technol., 2018, 52, 205–213 CrossRef CAS PubMed.
- J. Cao, T. Sun and K. T. V. Grattan, Sens. Actuators, B, 2014, 195, 332–351 CrossRef CAS.
- Y. Ziai, F. Petronella, C. Rinoldi, P. Nakielski, A. Zakrzewska, T. A. Kowalewski, W. Augustyniak, X. Li, A. Calogero, I. Sabała, B. Ding, L. De Sio and F. Pierini, NPG Asia Mater., 2022, 14, 18 CrossRef CAS.
- A. Jahangiri-Manesh, M. Mousazadeh, S. Taji, A. Bahmani, A. Zarepour, A. Zarrabi, E. Sharifi and M. Azimzadeh, Pharmaceutics, 2022, 14, 664 CrossRef CAS PubMed.
- J. Zhao, S. C. Nguyen, R. Ye, B. Ye, H. Weller, G. A. Somorjai, A. P. Alivisatos and F. D. Toste, ACS Cent. Sci., 2017, 3, 482–488 CrossRef CAS PubMed.
- S. Liao, W. Yue, S. Cai, Q. Tang, W. Lu, L. Huang, T. Qi and J. Liao, Front. Pharmacol., 2021, 12, 664123 CrossRef CAS PubMed.
- V. Frantellizzi, V. Verrina, C. Raso, M. Pontico, F. Petronella, V. Bertana, A. Ballesio, S. L. Marasso, S. Miglietta, P. Rosa, S. Scibetta, V. Petrozza, M. S. De Feo, G. De Vincentis, A. Calogero, R. Pani, G. Perotto and L. De Sio, Mater. Today Adv., 2022, 16, 100286 CrossRef CAS.
- A. G. Al-Bakri and N. N. Mahmoud, Molecules, 2019, 24, 2661 CrossRef CAS PubMed.
- C. Fang, L. Shao, Y. Zhao, J. Wang and H. Wu, Adv. Mater., 2012, 24, 94–98 CrossRef CAS PubMed.
- S. K. Loeb, J. Kim, C. Jiang, L. S. Early, H. Wei, Q. Li and J. H. Kim, Environ. Sci. Technol., 2019, 53, 7621–7631 CrossRef CAS PubMed.
- F. Petronella, D. De Biase, F. Zaccagnini, V. Verrina, S.-I. Lim, K.-U. Jeong, S. Miglietta, V. Petrozza, V. Scognamiglio, N. P. Godman, D. R. Evans, M. McConney and L. De Sio, Environ. Sci.: Nano, 2022, 9, 3343–3360 RSC.
- G. A. Evtugyn and T. Hianik, Curr. Anal. Chem., 2011, 7, 8–34 CrossRef CAS.
- X. Hu, Y. Zhang, T. Ding, J. Liu and H. Zhao, Front. Bioeng. Biotechnol., 2020, 8, 990 CrossRef PubMed.
- K. M. Mayer and J. H. Hafner, Chem. Rev., 2011, 111, 3828 CrossRef CAS PubMed.
- L. Martinez Maestro, P. Haro-González, J. Coello and D. Jaque, Appl. Phys. Lett., 2012, 100, 201110 CrossRef.
- X. Zan and Z. Su, Langmuir, 2009, 25, 12355 CrossRef CAS PubMed.
- M. E. Martínez-Hernández, X. Sandúa, P. J. Rivero, J. Goicoechea and F. J. Arregui, Chemosensors, 2022, 10(2), 77 CrossRef.
- R. A. Ghostine, R. M. Jisr, A. Lehaf and J. B. Schlenoff, Langmuir, 2013, 29, 11742 CrossRef CAS PubMed.
- E. Guzmán, R. G. Rubio and F. Ortega, Adv. Colloid Interface Sci., 2020, 282, 102197 CrossRef PubMed.
- X. Huang and M. A. El-Sayed, J. Adv. Res., 2010, 1, 13–28 CrossRef.
- C. C. Chuang, C. C. Cheng, P. Y. Chen, C. Lo, Y. N. Chen, M. H. Shih and C. W. Chang, Int. J. Nanomed., 2019, 14, 181–193 CrossRef CAS PubMed.
- F. Annesi, A. Pane, M. A. Losso, A. Guglielmelli, F. Lucente, F. Petronella, T. Placido, R. Comparelli, M. G. Guzzo, M. L. Curri, R. Bartolino and L. De Sio, Materials, 2019, 12, 1530 CrossRef CAS PubMed.
- H. Zhang, H.-J. Chen, X. Du and D. Wen, Sol. Energy, 2014, 100, 141–147 CrossRef CAS.
- J. Lin and D. Shi, Appl. Phys. Rev., 2021, 8, 011302 CAS.
- J. Lin, Y. Zhao and D. Shi, MRS Commun., 2020, 10, 155–163 CrossRef CAS.
- A. Guglielmelli, F. Pierini, N. Tabiryan, C. Umeton, T. J. Bunning and L. De Sio, Adv. Photonics Res., 2021, 2, 2000198 CrossRef.
- L. M. Maestro, Q. Zhang, X. Li, D. Jaque and M. Gu, Appl. Phys. Lett., 2014, 105, 181110 CrossRef.
- T. d L. Pedrosa, S. Farooq and R. E. de Araujo, Nanomaterials, 2022, 12, 4188 CrossRef CAS PubMed.
- J. W. Strutt, Philos. Mag., 1871, 41, 447–454 Search PubMed.
- C. F. Bohren and D. R. Huffman, Absorption and scattering of light by small particles, 1983 Search PubMed.
- T. Yamaguchi, S. Yoshida and A. Kinbara, Thin Solid Films, 1974, 21, 173–187 CrossRef CAS.
- P. Royer, J. L. Bijeon, J. P. Goudonnet, T. Inagaki and E. T. Arakawa, Surf. Sci., 1989, 217, 384–402 CrossRef CAS.
- P. e. a. Radomski, Polish Academy of Science (PAN), Bialystok 2022.
- P. J. Roache, Annu. Rev. Fluid Mech., 1997, 29, 123–160 CrossRef.
- M. O. P. Alvarenga, S. R. M. Veloso, A. Bezerra, B. P. Trindade, A. S. L. Gomes and G. Q. M. Monteiro, J. Photochem. Photobiol., 2022, 9, 100096 CrossRef PubMed.
- T. Dai, M. S. Vrahas, C. K. Murray and M. R. Hamblin, Expert Rev. Anti-Infect. Ther., 2012, 10, 185 CrossRef CAS PubMed.
- S. Kaidzu, K. Sugihara, M. Sasaki, A. Nishiaki, T. Igarashi and M. Tanito, Free Radical Res., 2019, 53, 611 CrossRef CAS PubMed.
- California Air source board, Hazardous Ozone-Generating Air Purifiers https://ww2.arb.ca.gov/our-work/programs/air-cleaners-ozone-products/hazardous-ozone-generating-air-purifiers (accessed 8 June 2023).
- Z. Zhang, J. Wang and C. Chen, Theranostic, 2013, 3(3), 223–238 CrossRef CAS PubMed.
Footnote |
| † Electronic supplementary information (ESI) available. See DOI: https://doi.org/10.1039/d3tb00865g |
| This journal is © The Royal Society of Chemistry 2023 |

