 Open Access Article
Creative Commons Attribution 3.0 Unported Licence
Novel systematic approach for produced water volume quantification applicable for beneficial reuse†
Stella I.
Eyitayo
 *a,
Marshall C.
Watson
a,
Oladoyin
Kolawole
 b,
Pei
Xu
 c,
Kazeem A.
Lawal
d,
Marshal E.
Wigwe
e and
Alberto
Giussani
a
aBob L. Herd Department of Petroleum Engineering, Texas Tech University, 807 Boston Avenue, Lubbock, TX 79409, USA. E-mail: stella.eyitayo@ttu.edu
bJohn A. Reif, Jr. Department of Civil and Environmental Engineering, New Jersey Institute of Technology, Newark, NJ 07102, USA
cDepartment of Civil Engineering, New Mexico State University, Las Cruces, NM 88003, USA
dFIRST Exploration and Petroleum Development Company, Lagos, Nigeria
eTRC Consultants, LC (PHDWin), 5806 Mesa Dr #215, Austin, TX 78731, USA
First published on 14th February 2023
Abstract
Produced water (PW) is an undesirable product generated during oil and gas production. More than 56% of the PW volume generated in the United States is disposed of either into the subsurface non-productive water-bearing reservoir (referred to as Saltwater Disposal well, SWD) or through other means. In the Permian Basin, 38–50% of the PW water volume generated is disposed of into SWD. Using SWDs comes with challenges such as overpressure, loss of injectivity, seismicity, and groundwater contamination. As such, it has become imperative to consider the beneficial reuse of produced water outside the oil and gas industry. Besides the PW volumetric data available in the public domain or some companies' repositories, not much attention is given to the potential volume that will be accessible for beneficial reuse or prediction of future values. Usually, the water–oil ratio (WOR) or water–gas ratio (WGR) is used for this projection (often a generalization of the accurate picture). However, a critical question remains on how much of the PW will be available for beneficial reuse in the coming years. This requires a rigorous method for quantifying and predicting PW obtainable over the long term. As an improvement over existing techniques, this study employs decline-curve analysis (DCA), type-curves method, and historical drilling and production data to develop a new systematic method for quantifying and predicting PW volumes at the basin and other aggregate levels. The applicability and robustness of the proposed method are demonstrated using Permian Basin (in West Texas, US) as a case study due to its uniqueness. The results indicate that the remaining PW in Permian is expected to peak at about 8–16 MMbbl per day in the period 2023–2027, while a total of 34–149 Bbbl of PW would be available for export to external industries over the next 38 years. A retrospective review of PW rates predicted for Permian in previous studies suggests that the approach and results of this new study are improvements over the previous ones. The new method and findings from this work should find relevance in predictions and sustainable management of PW in other petroleum basins in the United States and elsewhere.
Environmental significanceNotably, 60% of the states in the US have drought intensity ranging from moderate to worse, based on the National Drought Mitigation Center January 2022 report. Simultaneously, the discussion of recycling and reusing produced water (PW) in various sectors is increasing. Treated PW can reduce fresh water consumption in other industries or be used directly for agriculture, domestic purposes, etc. The question remains as to how much PW is accessible from the petroleum industry. Accurate quantification of PW is critical for beneficial reuse in the non-petroleum industry. A workflow that can be applied to any field/basin developed using decline curve analysis-Arp's model and the type curve normalization method. To demonstrate, the Permian Basin is used as an example. Projected PW accessible for external utilization totaled 34–149 billon bbl for the next 38 years with 8–16 bbl per d. |
1 Introduction
Traditionally, produced water (PW) is naturally occurring water found in a petroleum reservoir and produced as a byproduct during the exploitation and production of oil and natural gas from the subsurface system. However, owing to advances in the depth of knowledge and diversity of sources, the foregoing definition has recently been expanded to describe other types of water usually generated as waste during petroleum production operations1 these include, water produced because of water breakthrough during water injection or flooding and flowback water from hydraulic fracturing. PW is the most significant waste stream in the petroleum industry by volume. For instance, in the United States (US), cumulative production was estimated at 1.8 trillion bbl (75.6 trillion gallons) from 1933–2022 using the combination of the percentage volume reported by the Ground Water Research and Education Foundation (GWREF) Report of 2017 and Enverus-prism databases, as shown in Fig. 1a (Veil, 2020). The yearly production in the US from different reports ranges from 14 to 24.4 Bbbl‡ between 1985 and 2017, as shown in Fig. 1b.2–9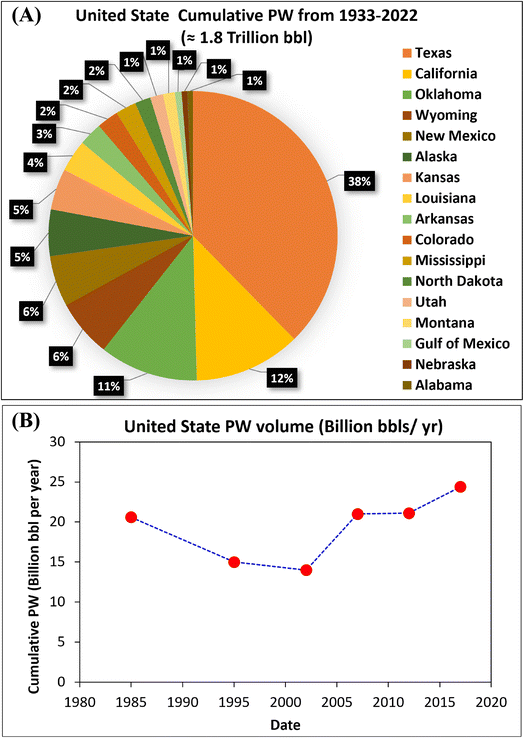 | ||
| Fig. 1 (a) Produced water volume from the United States from 1933–2022 using the Enverus prism database and 2017 GWPC report10 (b) US PW yearly production from 1985 to 2017.3–6,8–11 | ||
A reasonable fraction of PW is currently being managed using it for secondary and tertiary recovery processes, i.e., enhanced oil recovery (EOR). At the same time, the balance amount is being disposed of in salt-water disposal (SWD) wells, evaporation ponds, rivers, lakes, etc. after pre-treatment, or transported to a private centralized industrial wastewater plant for treatment.12–15 According to the Ground Water Protection Council (GWPC) report in 2015, of the total amount of the produced water generated from oil and natural gas development onshore and offshore in the US, some 45% of the produced water was used within the standard oil and gas enhanced-recovery operations, while 55% was reportedly disposed of by other means.3 In 2017, 91.5% of the produced water in the US was reused with 43.6% injected for enhanced recovery, 38.0% injected at the disposal wells operated by the oil and gas companies, and the remaining 9.9% injected at the offsite commercial disposal facilities. 5.5% of the produced water was discharged to the surface water. 0.4% was evaporated, primarily in several arid western states, from onsite ponds and pits and at several commercial disposal facilities. 1.4% was reused within the oil and gas industry other than injection for enhanced recovery.2
Texas state is the largest producer of produced water with about 38% of the cumulative volume from 1933–2022 (Fig. 1a). There are several basins in the State of Texas, US, which include the Permian Basin, Western Gulf Coast, Fort Worth, and East Texas Basin (Haynesville Bossier shale play), which straddles the three states of Arkansas, Louisiana, and East Texas, as well as Anadarko and Ardmore (Fig. 2). Fig. 2 presents a breakdown of the PW volume in Texas, split by the source basins and disposal outlets. The Permian Basin is the highest water producer with about 290 Bbbl cumulative PW from 1933–2022. Some 46% and 54% of the Permian's PW volume are used for EOR and injected in SWD wells either by non-commercial or commercial disposal facilities (36% and 17%), respectively.2 Other databases show that the volume injected for EOR is 33% of PW, while others are disposed of by SWD or other means, as shown in Fig. 2.
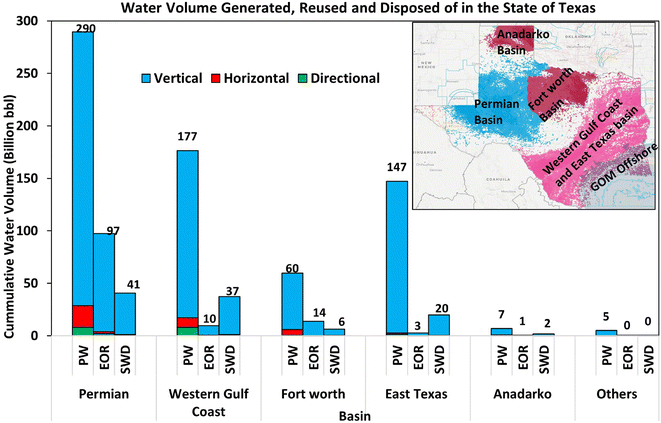 | ||
| Fig. 2 Historic PW volumes with producing basins in the State of Texas, US (data source: Enverus-drilling info and Prism). | ||
The foregoing indicates that the major means of disposal is SWD, which, unfortunately, has raised some other environmental issues. Such concerns include groundwater contamination, and induced seismicity causing earthquakes.16,17 Over the years, these challenges have not been addressed or eliminated, hence the search for alternative means is paramount. Another challenge is increasing PW volume due to an increase in oil and gas production, resulting in increased PW injection volume into SWD wells, which can lead to overpressure and constrained reservoir volume (especially in the case of a closed boundary system). As of 2015, it was reported that several SWD wells were approaching full reservoir volume capacity constraint in the Permian, thus leading to loss of injectivity or overpressure.18 Aside from the challenges facing PW treatment and disposal, Scanlon et al. (2022) noted that the subsurface disposal capacity for accommodating PW is a concern.19 Addressing this concern may require some intervention at the well or stimulation or, in the worst case, drilling of another SWD. The management of PW in the Permian is expected to become increasingly expensive and problematic, aggravating the stresses on the environment and some other indices of sustainable development. Other options include paying a fee to a commercial company to treat and dispose of excess PW that cannot be handled by non-commercial disposal facilities.
Dahm et al. (2014) showed that the cost of transportation of such facilities ranges from $0.5–8 per barrel depending on distances, the cost of treatment ranges from $0.2–8.5 per barrel and the cost of disposal is in the range of $0.07–1.6 per barrel. This totals a range of $0.77–18.1 per barrel.20 On the other hand, the beneficial reuse has gained importance in reducing the consumption of fresh water and aiding water conservation. Therefore, beneficial reuse is one-way of repurposing the PW injected in SWDs or the remaining water disposed of by other means. Considering the foregoing background and statistics from the Permian Basin, as an example, the pertinent question is: how much the produced water can be used for the beneficial reuse in years to come and how do we achieve robust predictions of PW volumes to aid proper planning for the beneficial reuse in Texas and elsewhere across the world. In other words, the objective of this paper is the long-term prediction of the profiles of net produced water obtainable from oil and gas production activities in the Permian Basin (West Texas) that may be accessible for beneficial reuse.
In the active lifetime of any petroleum field development and management, profiles of PW volumes expected from a green field are generated either from rigorous reservoir-simulation models or estimated from performance data available from nearby brownfields as analogs. These insights are important in designing the capacity of water-handling facilities. Usually, these reservoir models are periodically calibrated based on actual well-test data from the field of interest to enable reliable predictions of oil, gas, and accompanying water. Depending on the state, regulatory body historic PW volumes are available on online sources, e.g., New Mexico's Oil and Gas Conservation Division (NMOCD), and the Texas Railroad Commission (RRC), while others are not publicly available but in in-house repositories of oil and gas companies.
Comparison of the PW volume published by the Texas Alliance of Energy Producers (the Alliance) and the Independent Petroleum Association of America (IPAA),21 GWREF, GWPC,4,7,8,10 and Enverus Drilling info database in the state of Texas is shown in Fig. 3. There is a variability of more than 20% between the upper and lower bounds of these reported data. The sources of these data are responsible for this variability. For example, the value reported by Sourcewater, Inc. is multiple information from the PW database, which are integrated to ascertain the most precise and accurate PW data possible, while that from the B3 insight is from the Railroad Commission's (RRC's) H-10 Annual Disposal/Injection Well Monitoring Report.21
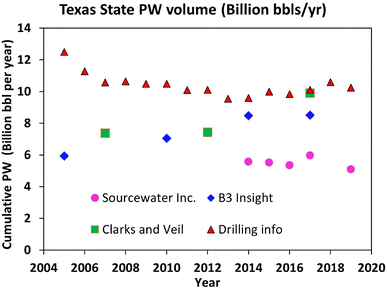 | ||
| Fig. 3 PW volume variability from available reports.4,10,21 | ||
To predict PW volumes, different researchers have estimated the current and future WOR (Table 1). Their results vary widely, underscoring a limited understanding of the key controls of WOR and how these controls would evolve in the future. Contrary to the view that produced water volume will increase rapidly year-on-year due to the aging of wells, this is not the case, as shown in Table 1 and Fig. 3. A review of these results suggests that there is neither consistency nor a logical trend in these WOR estimates, and the assumption of a continuous increase in WOR may have been an overestimation of the true picture. Arowoshola et al. (2011) predicted that global WOR values will increase from 3.0 to 12.0 within 9 years. However, as reported by Nair et al. (2019), the WOR has remained largely at about 3.0 in the same prediction period. These inconsistent estimates may be attributed in part to differences in underlying data sources used as well as methods of evaluation employed in the different studies.
| S/N | WOR (bbl/bbl) | WGR (bbl/MMcf) | Premises (reference) |
|---|---|---|---|
| 1 | 7.0 | — | Onshore average in 2002 in the United States22 |
| 2 | 9.5 | — | Onshore average in 2004 in the United States9 |
| 3 | 7.6 | 260 | Onshore average in 2007 in the United State4,23 |
| 4 | 12 | — | Global production WOR increase in 15 years for the onshore field24 |
| 5 | 9.2 | 97.0 | Onshore average in 2011 in the United States8 |
| 6 | 4.8 | 76.4 | A weighted average of some states in 2017 in the United10 |
| 7 | 3.0 | — | Global production WOR 2019 (ref. 25) |
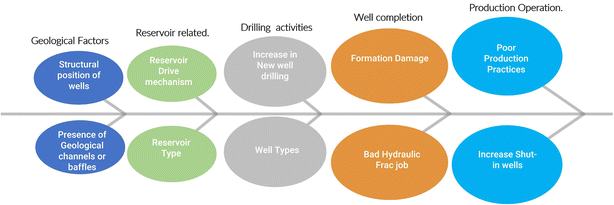
This is because many factors drive water production (Fig. 4), as in the case of oil production where some are controllable and others are not.26 The controllable factors are operation-related, while uncontrollable ones are reservoir and fluid properties based. Generally, water production occurs when hydrocarbon is produced; hence, the PW projection is tied to accompanying petroleum production. Usually, the WOR and WGR parameters are volumetric ratios of water to either oil or gas used to the approximate associated PW volume. WOR/WGR can be calculated at different levels, which include well, reservoir, field, county, district, and region. Understanding the drivers of PW at various individual and aggregate levels is crucial to generating realistic predictions of future rates and volumes for technical and business planning.
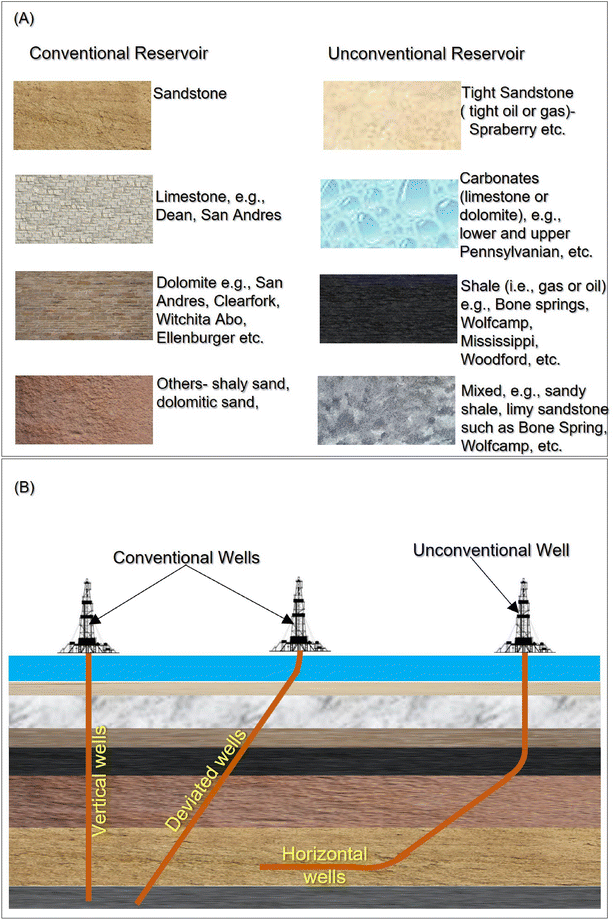
Most of these PW-controlling factors are usually dynamic and difficult to predict in practice, limiting the robustness of WOR and WGR as the primary predictive variables. This limitation notwithstanding, the use of WOR and WGR is readily illustrative, as evident in the following example. For illustration, Fig. 5 depicts the examples of reservoir and well types evaluated in this paper. Unconventional reservoir refers to tight sand, shale oil, gas, or vuggy carbonates while conventional reservoirs include sandstone, limestone, dolomite, or mixed sands. Conventional wells are vertical and deviated wells, while unconventional wells are horizontal and highly deviated (inclination > 70°). All these reservoirs and well types produce water but in different proportions and exhibit varied characteristics in terms of WOR, WGR, and water production profiles. As shown in Fig. 6, a typical reservoir production profile indicates that a well completed in a conventional reservoir is characterized by a reasonably predictive water-production profile after the water breakthrough. Conversely, the water-production characteristics of a similar well completed in an unconventional reservoir are relatively more complex and less predictive. Most importantly, any type of the well produced in an unconventional reservoir typically exhibits water production from inception, which increases more aggressively with time than its counterpart draining a conventional reservoir. In this paper, the discussion is focused on unconventional reservoirs with vertical and horizontal well completion.
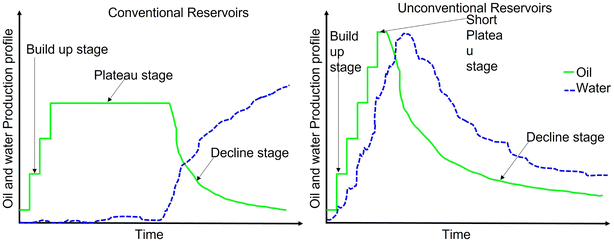 | ||
| Fig. 6 Typical well oil and water production profiles for conventional and unconventional reservoirs. | ||
Different scenarios of the variations of reservoir and field WOR with well trajectory effects are illustrated in Fig. 7. Despite the wells being completed in the same reservoir, the impact of differences in the well trajectory is high. The horizontal wells have much less aggressive WOR evolution compared to the counterpart vertical wells. The lower drawdown and higher productivity of the former enable it to delay water influx and mitigate post-breakthrough profile compared to the latter well type. With the recent increase in horizontal drilling, water production per unit of oil and gas recovery is most likely to be reduced.
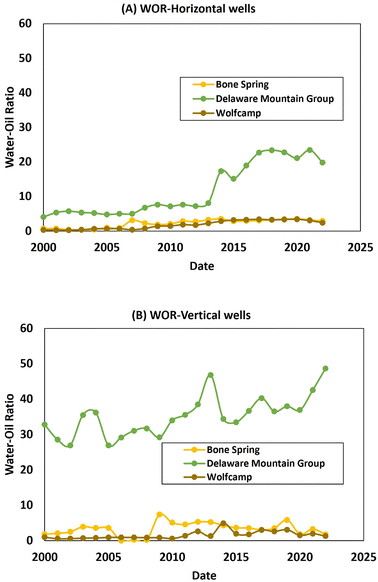 | ||
| Fig. 7 Comparison of the WOR historical profile for (a) horizontal and (b) vertical well producing from similar reservoir systems for selected examples (data source Enverus drilling info). | ||
Whereas an increase in drilling activities and successful well completion increase the production of hydrocarbons and water, a shut-in, abandonment, or repurposing of high water-producing wells would reduce water production though this may be at the expense of some oil and gas production. In essence, the foregoing shows how careful selection of the well type, completion target, production practices, and in-field optimization efforts can forestall and mitigate undesirable PW challenges.
As an improvement over existing techniques (which primarily use WOR to estimate PW), this paper employs decline-curve analysis, type curves, and historic drilling and production data to develop a new systematic method for quantifying and predicting PW volumes at the basin and other aggregate levels. Using Permian Basin (in West Texas, US) as a case study, the applicability and robustness of the proposed method are demonstrated.
1.1 Background
To the best of our knowledge, there is a paucity of materials on the rigorous quantification of PW volume in the open literature. However, there are several studies on oil and gas production forecasting methods used in the past. One of these methods is the Arps' function. The Arps' empirical model was introduced in 1945.27 It is a hyperbolic function with three dependent variables to describe how hydrocarbon production declines with time during the decline phase, i.e., after the water or gas breakthrough. Mathematically, the general form of the Arps' model is expressed as follows: | (1) |
q(t) = qi![[thin space (1/6-em)]](https://www.rsc.org/images/entities/char_2009.gif) exp(Dit) exp(Dit) | (2) |
 | (3) |
Fetkovich (1980) proved the scientific basis of the Arps' function and introduced the concept of type curves using several published sources, producing a set of type curves for production, forecasting under both transient and boundary-dominated flow conditions.29,30 The use of type curves ensures reliable boundary-dominated reserves estimates.31 Fetkovich's type curves have been modified for various reservoir systems such as dual-porosity,32 naturally fractured, multilayered, or similar shale reservoirs.33–36 Fraim et al. (1987) developed a normalized time that linearizes the rate decline vs. normalized time for a gas reservoir, producing against constant wellbore pressure during (external) boundary-dominated flow to improve the Fetkovich method. This allows type-curve matching of the exponential decline curve for a reservoir with any shape. It was determined that the gas reservoir depletion plotted vs. the actual time does not match exponential, harmonic, or hyperbolic decline curves, and future performance can lead to the overestimation of the reserves and future rates.37–39 Blasingame et al. (1991) introduced the pseudo-pressure normalized production and the material balance pseudo-time to improve the type-curve, which considered the production at variable bottom hole flowing pressure and the gas properties changing with the formation pressure.40 Agarwal et al. (1999) combined the decline-curve and type-curve analysis concepts to evaluate the volumes of oil and gas in place as well as to estimate reservoir permeability, skin effect, fracture length, conductivity, etc41. Type curve-analysis methods have become popular during the last 30 years, hence they are integrated into the method used in our current evaluation. Specifically, we apply normalized curves and Arps' functions in our predictions for new wells.
Some researchers modified the Arps' equation for a better forecast of oil and gas production, while others used a combination of different types of evaluation. For instance, Valkó and Lee (2010) proposed a Stretched Exponential Production Decline (SEPD) that enables the prediction of the production rate taking into consideration the two-phase flow behavior observed in the production of shale gas.42 Although the initial production behavior for SEPD is like a hyperbolic decline, it is possible to consider a decline exponent greater than 1 and appropriately apply it without modifying large amounts of data. Jongkitfnarykom et al. (2020) modified the Arps' model for multi-layered wells,43 while Gorditsa et al. (2020) used a modified Bessel function to improve the results of a stretched/power law exponential model(s) at the intermediate and late times.44 Hong et al. (2019) combined probability and statistical methods with the Arps' model.45 Xi et al. (2019) used geo-statistics (co-kriging of decline-curve parameter values) to determine the Arps' model parameters to give the best linear unbiased prediction of parameter values at undrilled locations.46 Blasingame (2022) used the type curve groupings based on productivity indices in combination with the modified hyperbolic and power-law exponential DCA models.47 Tadjer et al. (2022) incorporated Arps' model with an automated machine learning (ML) method for supervised learning and a Bayesian neural ordinary differential equation framework for time-series modeling to forecast the oil production rate.48 Kim et al. (2014) compared the probabilistic results of Arps' hyperbolic decline and SEPD and reduced the uncertainty due to low permeability or hydraulic fracturing by incorporating Monte Carlo simulation and combined multiple-well decline analysis for the shale gas reservoir.49 The result indicated that for gas reservoirs, SEPD yields better results because it captures the long transient flow exhibited by a reservoir in which hydraulic fractures are being applied and reduces the uncertainty related to the time at which boundary-dominated flow commences.49 Terminiello et al. (2020) compared the use of four different DCAs for unconventional resource evaluation-the Arps' modified hyperbolic model, Duong modified model, Stretch exponential, and power exponential methods. The Arps' model gave a similar result as the two latter methods.50 Despite various types of modifications to the Arps' model, a combination of different methods, the Arps' model has proven to give relatively similar results. When the number of wells is large, the use of the Arps' model to get reliable production forecasts is usually laborious, cumbersome, time-consuming, and error-prone due to a large amount of data processing, hence efforts have been made to automate this process.51
Several approaches have been developed for oil and gas production forecasting. These range from a computerized statistical approach to arrive at unbiased interpretations,29,30 and other statistical approaches such as standard principal component analysis and regression.52 The use of fuzzy pattern recognition and neural networks, which integrate DCA, type-curve matching, and reservoir simulation or history matching also gained recognition,53 however, the training of such a model is equally laborious and time-consuming. The probabilistic approach is also a common method that provides a measure of uncertainty in reserve estimates. An example of a probabilistic method used mostly is the Bayesian theorem or computation.54–58 Patzek et al. (2013) proposed the use of a simple scaling theory and growth model for forecasting the production of hydraulic fracture wells completed in gas reservoirs.59,60 Recently, the applications of supervised ML, deep learning (DL), and artificial intelligence (AI) have been implemented.51,61–66 While these methods provide automated, improved uncertainty of the distribution of forecasts, and various optimizing methods, it is important for the model to be “well calibrated-biased”. Hagoort (2003) proposed an automatic, computer-aided analysis using nonlinear regression in gas reservoirs where the production rate vs. time is matched without working through an elaborate processing stage.63 This relatively simple physical model of the production behavior was studied using vertical wells and may not be applicable to horizontal wells. Kianinejad et al. (2019) developed an AI-based DCA model to generate an estimated ultimate recovery (EUR) by creating a predictive model using part of the data and using the remaining dataset to train the model. While it is a fast automated method,51 limitations such as the generation of non-physical results over a long-term forecast have been reported.
More recently, Jiang et al. (2021) used ML algorithms to predict PW volume in the New Mexico section of the Permian Basin. One shortcoming of their work is that machine learning does not account for the three major phases (i.e., early, middle, and late) in the production lifecycle of a typical petroleum field.67 When a trained ML model is based on the combined historical data, there is a high chance that the ML method will either overestimate or underestimate the PW volume. Usually, a large amount of data is involved, and the solution is to group the wells by the types of well, reservoir, fluid, field, or county to quantify the PW volume. If an ML algorithm is used, such grouping will require a different model rendering the predictive process and results cumbersome and less efficient for practical applications.
The reliance on AI-based DCA for statistical analysis is a detriment to reservoir engineering principles. This often leads to unrealistic and unreliable forecasts and reserve estimates. The type curves are difficult to generalize for unconventional reservoirs. In addition, there are issues related to scaling, for example, a model that works for one well may be suboptimal in detecting similar production trends in different wells, leading to large forecast errors.64 Additionally, these methods follow a curve-fitting optimization algorithm and clustering/pattern recognition techniques, which still found their basis in the Arps' model and could be more expensive in implementation. As an alternative to the use of ML, AI, or DL to quantity PW volume on an aggregate level, Arps' DCA is a worthwhile technique and ideally suited for quantifying the associated PW volumes of an oil and gas field. Coincidentally, the analytical techniques and tools for executing DCA are mature and well-recognized in the petroleum industry as well as affiliated sectors such as finance and relevant government agencies.28,68,69
The Arps' model remains the simplest, easiest, and most common method to use for forecasting production hence it is applied in our current evaluation. Therefore, given its relative simplicity, proven predictive capability, and popularity, this paper invokes the traditional Arps' DCA model to quantify PW volumes to aid the disposal and applications of produced “wastewater” streams for beneficial reuse. Most importantly, we explore the applicability of Arps' models at different scales of interest, which include well, reservoir, field, and the country as deemed appropriate to the problem at hand on a case-by-case basis.
2 Materials and methods
2.1 DCA and type-curve techniques
In this paper, we employed a hyperbolic decline function of the Arps' model to forecast the production rates of oil, gas, and water during the hydrocarbon decline phases for both conventional and unconventional wells. Furthermore, a normalized type-curve was exploited to generate production forecasts for horizontal wells and then it was applied to the new drills. In essence, we have taken a fundamental assumption that new production wells would be mainly horizontal, hence our proposed application of current horizontal-well prediction results to future new wells. Another underlying assumption, which is fundamental to any DCA application, is that the factors that influenced historic performances would continue to drive future performances.Against the foregoing background, this paper developed a new systematic approach for predicting water production in the Permian Basin at the county level using the Arps' DCA technique. The proposed systematic approach includes the evaluation of existing producing wells and future development wells, which led to a robust prediction of the produced-water rates and volumes for the Permian Basin aggregated at the county level. Furthermore, the workflow and case study presented consider extensive drilling for the next 38 years in the petroleum industry within the Permian Basin. We expect that the proposed workflow and findings can be readily extended to other basins and geographical locations across the world to quantity PW volumes at any aggregate level of interest.
2.2 Data source, software, and workflow
The dataset used in this evaluation was obtained from Enverus (drilling info and Prism database). The production history, including produced oil, water, gas, and water-injection volumes were extracted and loaded into PHDwin, a commercial DCA software. Because DCA is very sensitive to the quality and appropriateness of the underlying historic production data, the robustness of the results obtained is subject to the accuracy and reliability of the reported historic produced-water volumes. Fig. 8 outlines the workflow employed in this study.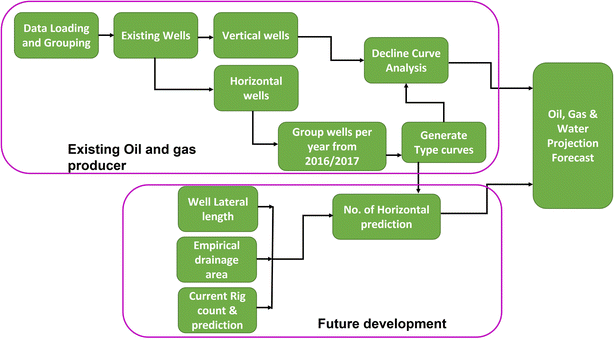 | ||
| Fig. 8 Workflow for a new systematic approach of forecasting net water production that can potentially be exported for beneficial reuse. | ||
2.3 Permian Basin as a case study for evaluating produced water
The Permian Basin, which straddles Southeastern New Mexico and West Texas, is one of the largest and most prolific petroleum basins in the US.70,71 As a result, this basin generates an enormous volume of PW, making it suitable for this study as an appropriate PW benchmark for other basins in the US and elsewhere. Focusing on the West Texas area, the Permian consists of the Midland and Delaware, the Central Basin Platform, Eastern Shelf, Northwest Shelf, and Val Verde basins. In total, the subject basin comprises 58 producing counties and over 147![[thin space (1/6-em)]](https://www.rsc.org/images/entities/char_2009.gif) 374 wells, both vertical and horizontal (data source: Enverus-Drilling info).
374 wells, both vertical and horizontal (data source: Enverus-Drilling info).
In terms of the disposed water volume to date, most counties have a large volume that is significant for beneficial reuse potential (Fig. 9a). For clarity, conventional wells in this context refer to vertical wells and low-deviation (<50° inclination) wells, while unconventional wells are strictly horizontal and highly deviated wells.
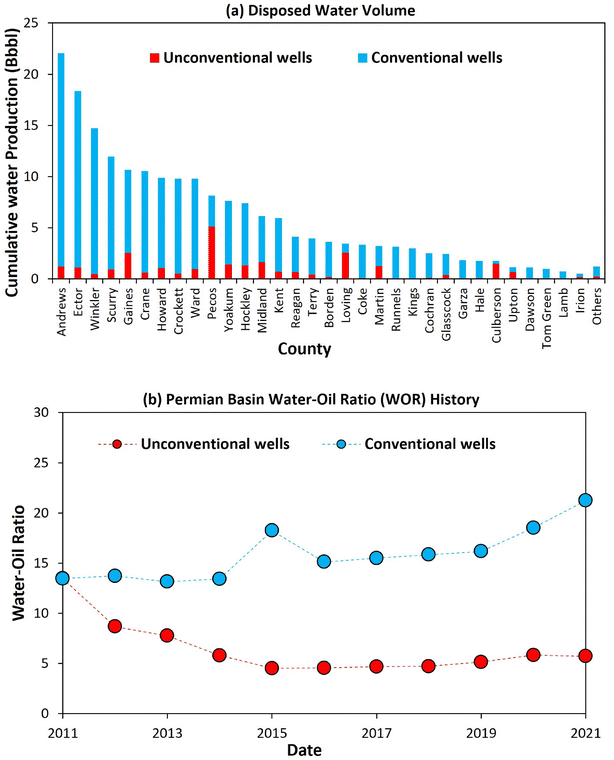 | ||
| Fig. 9 (a) Disposed water volumes from conventional and unconventional wells by county as of December 2021. (b) Historic produced WOR of the Permian Basin. | ||
From available records (Fig. 9b), the historically produced WOR in the Permian exhibits a wide variation of 13.1 to 21.2, with an arithmetic average of 15.9 for conventional wells and 4.5–13.5, with an arithmetic average of 6.4 for unconventional wells. Between the years 2011–2021. Most importantly, there is no clear and consistent WOR trend. Indeed, the absence of a clear historic WOR trend in Fig. 9b makes the use of WOR as the basis of predicting future PW profiles very challenging and non-unique, especially at the basin level as required for the target applications. Conversely, as it would be demonstrated shortly, such a wide variation in WOR does not affect the applicability of the systematic predictive approach introduced because this new approach is not premised on WOR, which is a ratio of the two different quantities, i.e., water and oil production rates in the decline phase. Therefore, our proposed utilization of the Arps' model to evaluate each of the oil and water phases during the decline phase is inherently more robust because it tracks individual phases, rather than their individual trends being obscured in the use of volumetric ratios such as WOR. Although it was originally developed for predicting oil production, the applicability of the Arps' model for forecasting the accompanying water production during the oil-decline phase is well established.72
3 Theoretical calculations
3.1 Analysis of existing wells
A reliable production forecast is dependent on Arps' parameters and the assumptions used. The b-factor of 0–1 in Arps' model is acceptable when the reservoir is sandstone, limestone, etc. For instance, Ambastha and Wong (1995) showed that the b-factor of a hyperbolic function is in the range 0 < b < 1 when considering the oil production from a sedimentary basin (sandstone and limestone) with a waterflood recovery mechanism. However, in practice, we often observe values much greater than 1.0, especially before the onset of the true boundary-dominated flow.60,73 For unconventional reservoirs, the b-factor is not easy to determine because it depends on the degree of data scatter.74 Long et al. (1987) demonstrated that the decline curves of the wells characteristically exhibit b > 1 using the hyperbolic-overlay technique for rocks that are fractured and tight or relatively tight. The hyperbolic b exponents (with an average of 1.7) characterizing thousands of producing wells were determined, and it was concluded that b exponents exceeding 1.0 are typical for the production performance character of wells in many areas of the US.75 Given that the production data in our case do not exhibit such high variation from the fitted trend, the b-factors are considered reliable for each forecast. Extrapolation of the hyperbolic declines over long periods of time frequently results in unrealistically high reserves hence a minimum decline rate must be specified to convert the curve fitting from the hyperbolic function to the exponential. Typically, values in the range 0–10% are used for the minimum decline rate.Different types of plots can be used to represent the data ranging from rate/time, rate/cumulative, log–log plots of water/oil cut versus time/cumulative, etc.76 Duong (2011) proposed the use of a log–log plot of rate vs. cumulative production for fracture-dominated wells in unconventional-reservoir. However, the rate/time DCA is the most reliable technique and presents typical decline curves based on the production data gathered from an unconventional reservoir.36,77 Other methods complement the traditional decline rate, such as the rate integral method, which smoothens the time–rate curve without the introduction of an external smoothening mechanism.78 For this evaluation, the rate–time curve was used in the representation of each forecast. Both existing horizontal and vertical wells were analyzed, however, the workflow for horizontal wells is detailed below.
Leveraging the available production history, a projection was made for each of the existing horizontal wells in the Permian Basin. The general premises and assumptions for the existing wells in the DCA conducted are:
•Wells classified as either shut-in or drill uncompleted (DUC) were excluded.
•All wells drilled before the year 2016 were evaluated with one aggregate decline curve per county.
•Type curves were established using only the wells drilled in the year 2017 for each county because the majority of the horizontal drilling started around that year.
•Wells drilled from the year 2017 to 2021 were evaluated as a group every year. This is because the wells drilled in different years have different initial decline rates.
•Specifically, the b-factor values of the type curves were used for all cases. For the year 2021 forecast, due to the paucity of data, both the b-factors and an initial nominal decline rate from the type curves were used.
•A 5% minimum decline rate was assumed for the projection, i.e., the rate at which the curves change from using a hyperbolic model to the exponential model.
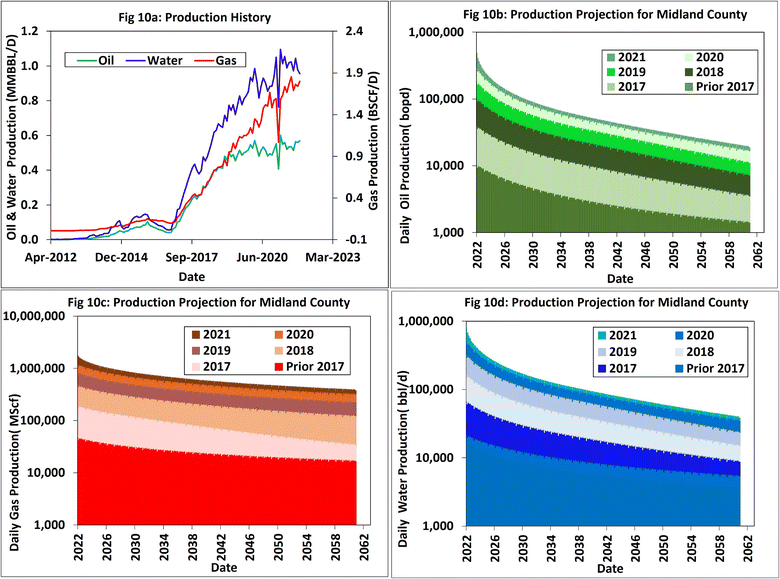
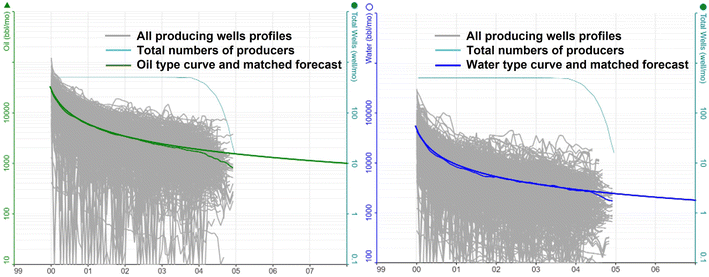
Most of the production data at the county level do not exhibit decline trends because new wells are being drilled concurrently (Fig. 10a), especially for the horizontal well production profiles. To capture the varying decline rates, i.e., 2017–2021, we analyzed individual forecasts (Fig. 10b–d).
For future drills, projection is based on the area available within the target basins while considering the areas, existing well spacing, well count, rig count, and lateral lengths of wells. However, the analysis does not include conventional wells because horizontal-well drilling has been predominant recently and is expected to be sustained far into the foreseeable future. Furthermore, for simplicity, the potential effects of the parent–child interactions are ignored in this work.
3.2 Target areas for drilling and well count
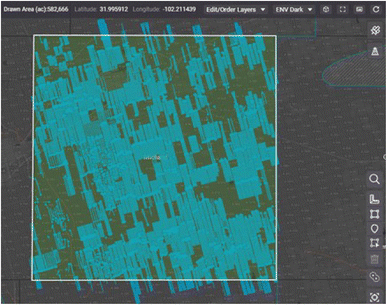
A polygon drawn around the target area of the existing horizontal wells was used to estimate the total development area considered in this evaluation (Fig. 11). In this assessment, we had to deal with more than 10 different layers of development (such as Bone Spring, Spraberry, Wolfcamp A, B, C, and D), as shown in Fig. 12, for the horizontal well development. From the geologic map, there may be a high density of horizontal wells, but they are not landed within the same layer, hence it is difficult and tedious to determine the number of horizontal wells per layer. The relatively simple approach undertaken in this work informed the decision not to explore the details of the well density and the potential impacts on a layer-by-layer basis.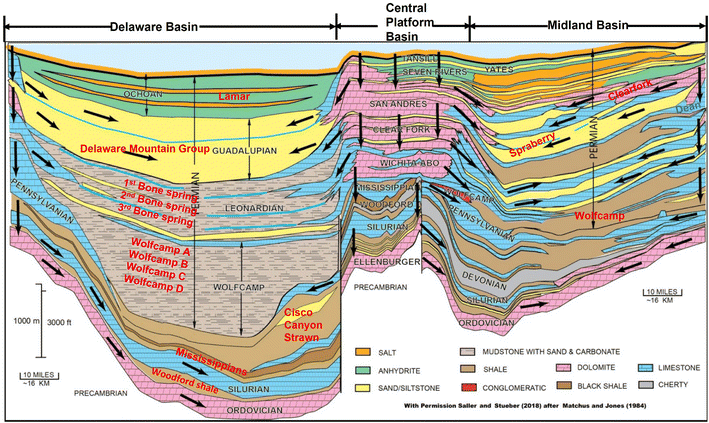 | ||
| Fig. 12 A cross-section of the Delaware, Central Platform, and Midland sub-basins.79 | ||
A reasonable assumption was made to handle the development of multiple layers by estimating a general well density that encompasses drilling all horizons. On average, these well densities range from 4–20 wells per section. This was assessed by focusing on the area with the greatest concentration of the horizontal wells to estimate the well density for all the combined layers. In building scenarios in terms of the well density, we have (i) the high cases are based on the maximum number of the well densities observed; (ii) the base case is premised on the number of the predominant well density per section, and (iii) the low case refers to either the minimum or average minimum well density per section.
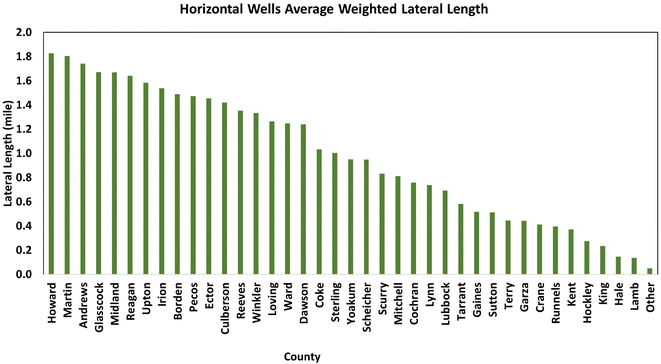
Additionally, we utilized the weighted average lateral length combined with the well density noted in the foregoing to ascertain an empirical drainage area per well (Fig. 13), i.e., width × length = empirical drainage area. The target area, number of wells per section, total drainage area, undrained area, and the required well number to drain these regions were calculated. For example, if we have 20 wells per section, that will give about 264 ft spacing between wells (i.e., 5280 ft/20). Combined with a 10![[thin space (1/6-em)]](https://www.rsc.org/images/entities/char_2009.gif) 000 ft lateral length, this gives an empirical drainage area of 2
000 ft lateral length, this gives an empirical drainage area of 2![[thin space (1/6-em)]](https://www.rsc.org/images/entities/char_2009.gif) 640
640![[thin space (1/6-em)]](https://www.rsc.org/images/entities/char_2009.gif) 000 ft2 (60 acres). The total number of wells that can be drilled to drain the target area was determined, and then the number of wells for future drilling was estimated by removing the number of existing wells from the total. For instance, if the target area is 120
000 ft2 (60 acres). The total number of wells that can be drilled to drain the target area was determined, and then the number of wells for future drilling was estimated by removing the number of existing wells from the total. For instance, if the target area is 120![[thin space (1/6-em)]](https://www.rsc.org/images/entities/char_2009.gif) 000 acres and the existing number of wells is 1200, the total number of wells is estimated to be 2000 (120
000 acres and the existing number of wells is 1200, the total number of wells is estimated to be 2000 (120![[thin space (1/6-em)]](https://www.rsc.org/images/entities/char_2009.gif) 000/60), while the future drilling is 800 wells.
000/60), while the future drilling is 800 wells.
3.3 Rig count and drilling rate
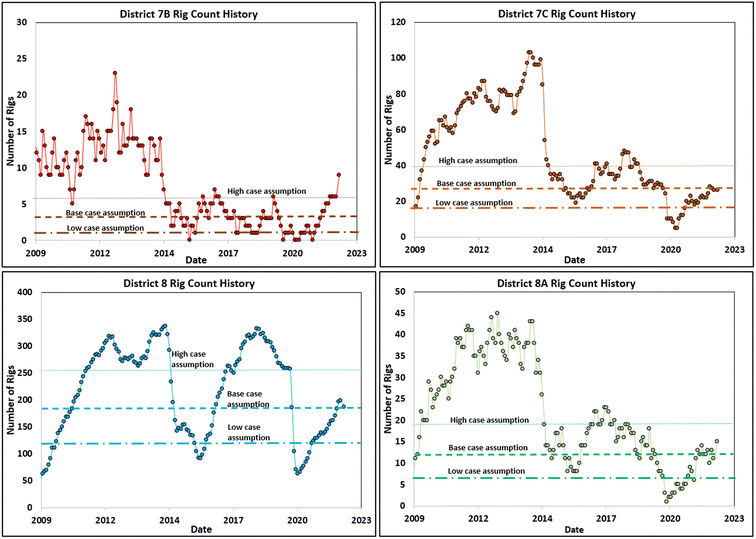
Three scenarios (low, base, and high cases) were considered to capture the changes associated with the rig count over time. Based on Baker Hughes' data, the rig count for the four districts 7B, 7C, 8, and 8A was estimated as 48, 103, 337, and 45, respectively.Based on history, the higher end of the rig count was not used because of constraints related to the current availability of rig personnel to handle rig operations, drilling, and completion materials, as well as several other controlling factors. Therefore, the current rig count (as of June 2022) was used as the base-case projection, while the low and high-case assumptions were based on the rig-count history from 2016 to date (Fig. 14). Table 2 summarizes the rig-count assumptions for counties' low, base, and high cases. For the drilling-rate assumptions, industry information revealed that the drilling-and-completion time of an average of 3-mile-long horizontal wells ranged from 15 to 20 days. As a result of this empirical information, a baseline average drilling time of 18 days was used for each 3-mile horizontal well considered in the present study.
| District | County | Rig count assumption | Number of production wells per year (at an estimated drilling and completion rate of 18 days per well) | ||||
|---|---|---|---|---|---|---|---|
| Low case | Base case | High case | Low case | Base case | High case | ||
| 7B | Coke | 3 | 5 | 6 | 60 | 95 | 120 |
| Irion | 2 | 3 | 3 | 40 | 60 | 60 | |
| Reagan | 3 | 6 | 7 | 60 | 120 | 140 | |
| Upton | 12 | 21 | 25 | 240 | 420 | 500 | |
| Sub-total | 20 | 35 | 41 | 400 | 695 | 820 | |
| 7C | Fisher | 2 | 4 | 6 | 40 | 80 | 120 |
| Sub-total | 2 | 4 | 6 | 40 | 80 | 120 | |
| 8 | Andrews | 6 | 9 | 12 | 52 | 168 | 240 |
| Crane | 3 | 4 | 5 | 60 | 80 | 100 | |
| Culberson | 3 | 4 | 6 | 60 | 80 | 120 | |
| Ector | 1 | 2 | 3 | 20 | 40 | 60 | |
| Glasscock | 7 | 11 | 15 | 140 | 220 | 300 | |
| Howard | 16 | 25 | 34 | 320 | 500 | 680 | |
| Loving | 16 | 25 | 34 | 320 | 500 | 680 | |
| Martin | 23 | 35 | 43 | 460 | 700 | 860 | |
| Midland | 19 | 28 | 38 | 36 | 560 | 760 | |
| Mitchell | 1 | 1 | 20 | 20 | |||
| Pecos | 5 | 8 | 11 | 100 | 160 | 220 | |
| Reeves | 15 | 22 | 30 | 300 | 440 | 600 | |
| Ward | 5 | 7 | 10 | 100 | 140 | 200 | |
| Winkler | 4 | 6 | 8 | 80 | 120 | 160 | |
| Sub-total | 123 | 187 | 250 | 2048 | 3728 | 5000 | |
| 8A | Borden | 1 | 2 | 20 | 40 | ||
| Cochran | 1 | 2 | 20 | 40 | |||
| Dawson | 2 | 3 | 4 | 60 | 60 | 80 | |
| Gaines | 1 | 2 | 20 | 40 | |||
| Garza | 1 | 2 | 3 | 20 | 40 | 60 | |
| Hockley | 1 | 2 | 20 | 40 | |||
| Kent | 1 | 2 | 20 | 40 | |||
| King | 1 | 2 | 20 | 40 | |||
| Lubbock | 1 | 2 | 20 | 40 | |||
| Scurry | 2 | 3 | 4 | 60 | 60 | 80 | |
| Yoakum | 2 | 3 | 4 | 42 | 60 | 80 | |
| Sub-total | 7 | 18 | 29 | 182 | 360 | 580 | |
| Total | 152 | 244 | 326 | 2670 | 4863 | 6520 | |
3.4 Decline-rate predictions
The type curves generated are based on the weighted-average lateral length of existing wells drilled in the period 2016–2017 for each county. The concept of normalized type curves is not new80–82 and it is usually suitable to define the production of prospective wells in which details of the subsurface characterizations are not yet well established or for the purpose of scoping studies. In this study, a type-curve represents the reservoir, field, or county's typical well behavior, which is calculated by gathering production volumes from the child cases and initializing them to a common starting point in time. From that starting point, all the well's volume is averaged for each month, and a single representative curve is generated with a known initial nominal decline and b-factor. The initial decline rate is the curve's steepness, while the b-factor determines the rate of change in the decline rate. This was accomplished for each county (Table 3). In principle, this approach assumes that the weighted average lateral length of the existing wells would also be the lateral length of the new drills. Table 3 summarizes the type curve parameters underlining the forecasts. The primary objective was to determine the quantities Di and b-factor, which are important parameters to invoke the Arps' model.| County | Horizontal wells | |||||
|---|---|---|---|---|---|---|
| b-Factors | Initial decline rate, Di (/yr) | |||||
| Gas | Oil | Water | Gas | Oil | Water | |
| Andrews | 0.5 | 1.0 | 1.0 | 0.8 | 3.9 | 2.6 |
| Borden | 2.5 | 1.7 | 1.2 | 3.8 | 14.2 | 8.4 |
| Cochran | 1.0 | 1.9 | 1.4 | 2.4 | 4.4 | 3.2 |
| Coke | 1.5 | 1.0 | 1.5 | 2.1 | 1.2 | 8.1 |
| Crane | 2.5 | 1.4 | 0.5 | 6.1 | 2.8 | 0.2 |
| Culberson | 1.9 | 1.2 | 0.6 | 2.1 | 2.4 | 1.1 |
| Dawson | 1.0 | 1.7 | 1.7 | 2.5 | 7.6 | 14.7 |
| Ector | 0.7 | 1.4 | 1.8 | 0.3 | 4.2 | 6.4 |
| Fisher | 0.6 | 0.8 | 1.9 | 0.6 | 2.2 | 2.3 |
| Gaines | 0.5 | 1.3 | 2.5 | 0.1 | 0.3 | 0.9 |
| Garza | 1.6 | 1.8 | 0.4 | 3.3 | 13.1 | 0.2 |
| Glasscock | 2.2 | 1.1 | 1.2 | 1.0 | 5.0 | 6.3 |
| Hockley | 0.2 | 1.5 | 0.5 | 1.9 | 3.0 | 0.6 |
| Howard | 2.8 | 1.3 | 1.4 | 2.5 | 6.3 | 5.6 |
| Irion | 2.7 | 1.0 | 1.0 | 0.7 | 6.9 | 8.4 |
| Kent | 0.6 | 0.9 | 1.4 | 0.7 | 0.9 | 0.6 |
| King | 0.5 | 1.5 | 1.8 | 2.1 | 0.2 | 0.3 |
| Loving | 1.2 | 1.2 | 1.2 | 2.8 | 5.2 | 3.0 |
| Lubbock | 1.4 | 2.5 | 1.3 | 0.8 | 0.8 | 0.0 |
| Martin | 1.9 | 1.1 | 1.1 | 1.3 | 4.7 | 3.5 |
| Midland | 1.9 | 1.1 | 1.1 | 1.1 | 4.7 | 5.4 |
| Mitchell | 0.5 | 1.4 | 1.1 | 0.8 | 13.3 | 11.9 |
| Pecos | 1.6 | 1.2 | 1.1 | 2.3 | 3.5 | 2.7 |
| Reagan | 3.0 | 1.1 | 1.0 | 0.6 | 5.0 | 2.3 |
| Reeves | 1.0 | 0.8 | 0.4 | 1.0 | 1.5 | 1.0 |
| Scurry | 2.5 | 1.5 | 0.8 | 1.8 | 2.7 | 4.5 |
| Upton | 0.5 | 1.1 | 1.1 | 2.0 | 4.5 | 6.8 |
| Ward | 2.4 | 2.1 | 1.5 | 5.8 | 10.0 | 4.3 |
| Winkler | 1.4 | 1.6 | 1.0 | 1.5 | 2.9 | 1.7 |
| Yoakum | 2.5 | 1.9 | 1.5 | 0.1 | 3.1 | 3.0 |
4 Results and discussion
4.1 Application to Midland County
Midland County in Texas has a target area of 594![[thin space (1/6-em)]](https://www.rsc.org/images/entities/char_2009.gif) 171 acres to be drilled. It has more than 19
171 acres to be drilled. It has more than 19![[thin space (1/6-em)]](https://www.rsc.org/images/entities/char_2009.gif) 815 wells drilled and completed to date. This well count includes production, injection, and disposal wells. About 8710 wells were active with 96% hydrocarbon producers. The DCA of the existing horizontal and vertical wells was based on the number of active hydrocarbon producers, while new drills are premised on the assumptions stated earlier. Fig. 15, 16 and Table 4 present a detailed outlook of the target area, the number of wells per section or the reservoir layer, lateral length, and well count per layer, as well as the corresponding type curves generated for this county. Fig. 17 depicts the overall production projections for vertical, horizontal, and new drills under the low, base, and high-case scenarios.
815 wells drilled and completed to date. This well count includes production, injection, and disposal wells. About 8710 wells were active with 96% hydrocarbon producers. The DCA of the existing horizontal and vertical wells was based on the number of active hydrocarbon producers, while new drills are premised on the assumptions stated earlier. Fig. 15, 16 and Table 4 present a detailed outlook of the target area, the number of wells per section or the reservoir layer, lateral length, and well count per layer, as well as the corresponding type curves generated for this county. Fig. 17 depicts the overall production projections for vertical, horizontal, and new drills under the low, base, and high-case scenarios.
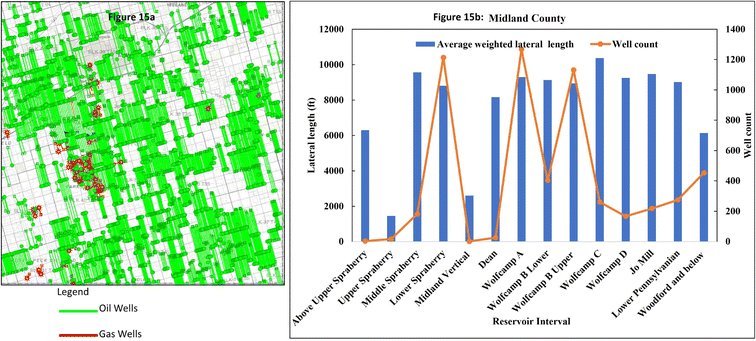 | ||
| Fig. 15 (a) Map of Midland County area, Texas, showing the distribution of horizontal wells. (b) Reservoir interval with the lateral-length distribution per layer and well count. | ||
| Reservoir interval | Number of wells per section | |
|---|---|---|
| Minimum | Maximum | |
| Above Upper Spraberry | 1 | 1 |
| Upper Spraberry | 1 | 1 |
| Middle Spraberry | 3 | 3 |
| Lower Spraberry | 4 | 5 |
| Midland vertical | 1 | 1 |
| Dean | 2 | 2 |
| Wolfcamp A | 12 | 13 |
| Wolfcamp B | 6 | 7 |
| Wolfcamp C | 12 | 13 |
| Wolfcamp D | 4 | 5 |
| Jo Mill | 5 | 5 |
| Lower Pennsylvanian and Mississippi | 6 | 7 |
| Woodford and below | 10 | 10 |
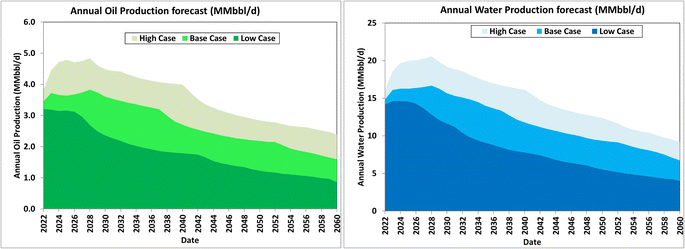
For each county in the Permian Basin, a similar analysis was carried out to project future production profiles in the low, base, and high cases. The combination of all the production forecasts from these counties is presented in Fig. 18. This represents production from existing vertical and horizontal wells, in addition to expected future wells. At a maximum annual average rate of 5 MMbbl per day§ of oil and 20 MMbbl per day of water, the cumulative producible volumes of oil and water expected over the next 38 years are 51.4 and 211 Bbbl, respectively.
In terms of cumulative WOR over the next 38 years, this work projects a range of 3.8–4.2 bbl/bbl for the Permian Basin (conventional and unconventional wells). It is noteworthy that the projected cumulative WOR range of 4.7–5.0 bbl/bbl¶ for vertical wells does not agree with the widespread predictions of 7.0 and 12.0 bbl/bbl published by previous researchers.22,24 The overestimation can partly be explained by the effects of the shale boom and the advent of drilling long lateral or horizontal wells; hence, the premises of Lee et al. (2002) and Arowoshola et al. (2011) work must be considered and rationalized before applying their WOR predictions. Apart from the differences in the predictive methods accounting for the variances in projected cumulative WOR estimates, other controlling factors include differences in the statistics and types of wells and reservoirs underlying the various studies. Based on field data recorded since the publication of the works of Lee et al. (2002) and Arowoshola et al. (2011), the WOR of the Permian Basin was established to be less than 5.0 bbl/bbl (Fig. 9b). Thus, in the period 2012 to 2022, the predictions made by these workers overestimated the actual WOR values in that period by a factor of 1.4–2.4. Given their relatively poor performance in the period under review, it is considered that the predictions of Lee et al. (2002) and Arowoshola et al. (2011) deserve to be treated with serious caution and relatively low confidence, especially for the Permian Basin.
However, it is worthy of note that a more recent study conducted by Wright (2022), who was quoting James (2022), reported a WOR of 3.6 bbl/bbl as being more representative.15,83 The closeness of the WORs reported by Wright (2022) and our current work, coupled with the non-satisfactory agreement between the predictions of previous workers and the actual WOR of the Permian Basin in 2012–2022, underscore the robustness and appropriateness of the new systematic method that we have proposed in this paper as well as its potential for practical applications.
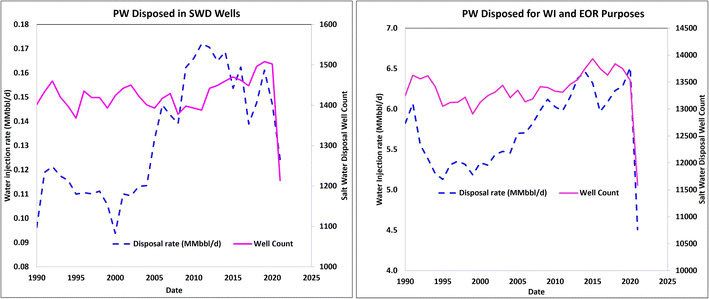
4.2 Estimated volume of the produced water disposed
One of the ways PW is managed in the petroleum industry is by reusing for secondary and tertiary recovery processes, such as water injection, chemical and polymer flooding, and steam flooding. Some are injected into the dedicated wells drilled to dispose of PW into non-productive zones (i.e., SWD). Fig. 19 shows the reported water-injection rates in the Permian Basin for oil recovery and disposal between 1990 and 2021. The dataset indicates that the range of volume/rate disposed of SWD wells is 0.1–0.17 MMbbl per day, irrespective of the varying number of active wells, while that employed for the purpose of improved oil recovery ranges from 4.4–6.3 MMbbl per day. These historic statistics suggest that the total PW rate managed within the industry in the period under review was 4.5–6.5 MMbbl per day.From the database, it is estimated that low, base, and high cases of 6.5, 5.8, and 4.5 MMbbl per day of PW, respectively, were used. On deducting these estimated PW utilization rates from the “combined PW rate forecast” as shown in Fig. 19, we arrived at the net rate of the remaining PW that needs to be disposed of by other means. This is the net amount that would be available for productive uses or beneficial reuse in the future.
4.3 Projection of produced water
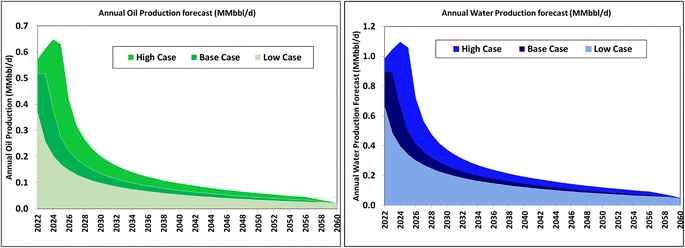
Based on this work, the maximum-projected water production rate that will be accessible for beneficial reuse, such as agricultural and manufacturing industries as well as municipal uses is estimated as 8–16 MMbbl per d. Fig. 20 shows the production forecasts of the different realizations. For proper planning, it is noteworthy that these peak net PW rates are expected to occur in the period 2023–2027, regardless of the scenario (low, base, or high case) under consideration. In summary, the cumulative net volumes of PW available for beneficial reuse over the next 38 years are estimated as 34, 89, and 149 Bbbl in the low, base, and high cases, respectively.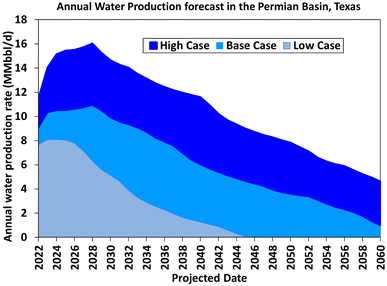 | ||
| Fig. 20 Forecasts of PW rates expected from the Permian Basin for potential utilization by external industries. | ||
5 Scope for further studies
Despite the large range of uncertainties associated with several input data and assumptions in this work, the resulting production profiles are reasonable. However, potential threats to the stability of these results include (i) disruptive effects of the energy transition on oil, and gas development and production; (ii) impacts of operational uptimes, and integrated system capacities, which are at risk of erosion as the various producing fields mature and facilities age; as well as (iii) disruptive effects of new technologies, which may improve recovery efficiencies, and reduce well count per unit recovery. Therefore, it is recommended that future studies on this subject should monitor the foregoing factors and other considerations. Based on new insights and updates, enhancements to the present work should be explored to generate improved upstream production profiles of PW that would potentially be available for beneficial reuse in the Permian Basin, Texas, and elsewhere.6 Conclusion
Following a critical review of the existing techniques and limitations of previous works, a new systematic method has been developed for quantifying and predicting the net amount of the produced water obtainable from the development and production activities in a petroleum basin for potential utilization of such wastewater in other (external) industries. Based on the coarse-level subsurface and well information, statistics of drilling activities, and historic performance datasets, the new method is predicated on the well-established Arps' DCA model and normalized type curves. While this method is fairly time-consuming in data preparation and quality check, it offers simple and easy steps for the prediction of PW profiles that may be available for beneficial reuse at aggregate scales. Taking the Permian Basin as a case study, the applicability and robustness of the proposed method were demonstrated. The following are the specific concluding remarks for the Permian Basin:(a) Due to the lack of consistent historic trends, WOR is not robust for predicting produced-water profiles. In retrospect, the outlook of PW rates from Permian was significantly overestimated by previous workers.
(b) The PW rate is expected to peak at about 8–16 MMbbl per day in the period 2023–2027.
(c) Some 34–149 Bbbl of PW is expected to be available to external industries over the period 2022–2060.
(d) As more data and increased insights become available, scope exists to reduce underlying uncertainties and refine the forecasts of PW generated for the Permian Basin in this study.
Conflicts of interest
The authors declare that they have no known competing financial interests or personal relationships that could have appeared to influence the work reported in this paper.Acknowledgements
The authors thank the Texas Produced Water Consortium for the support provided for this study. Additionally, we would like to acknowledge Enverus for providing access to data used for research, and TRC Consultants, LC, for providing free access to PHDwin Software through their Academic Program.References
- T. A. Blewett, A. M. Weinrauch, P. L. M. Delompré and G. G. Goss, The effect of hydraulic flowback and produced water on gill morphology, oxidative stress and antioxidant response in rainbow trout (Oncorhynchus mykiss), Sci. Rep., 2017, 7, 1–11, DOI:10.1038/srep46582.
- J. Veil, U. S. Produced Water Volumes and Management Practices, Ground Water Research and Education Foundation, 2020 Search PubMed.
- J. Baza, S. Chard, M. Dunkel, S. Kell, K. Harris and N. Saunders, Groundwater Protection Council Produced water report: Regulations, current practices, and research needs, WEFTEC 2019 - 92nd Annual Water Environment Federation's Technical Exhibition and Conference. 2019 Search PubMed.
- C. E. Clark and J. Veil, Produced Water Volumes and Management Practices in the United States. Report No ANL/EVS/R-09/1, Contract No. DE-AC02-06CH11357, US DOE/National Energy Technology, 2009 Search PubMed.
- C. M. Cooper, J. Mccall, S. C. Stokes, C. Mckay, J. Matthew, J. S. Rosenblum and et al, ., Oil and Gas Produced Water Reuse : Opportunities , Treatment Needs , and Challenges_supporting Information, ACS ES&T Engg, 2022, 1–16 Search PubMed.
- D. O'Rourke and S. Connolly, Just oil? The distribution of environmental and social impacts of oil production and consumption, Annu. Rev. Environ. Resour., 2003, 28, 587–617 CrossRef.
- J. Veil, US Produced Water Volumes and Management Practices in 2012; Report Prepared for the Groundwater Protection Council. Groundw Prot Counc, 2015, vol. 119. Available from: http://www.gwpc.org/sites/default/files/ProducedWaterReport2014-GWPC_0.pdf Search PubMed.
- J. A. Veil and C. E. Clark, Produced-water-volume estimates and management practices-Groundwater protection council(GWPC), SPE Prod. Oper., 2011, 26(3), 234–239 CAS . Available from: http://www.veilenvironmental.com/publications/pw/final_report_CO_note.pdf.
- J. A. Veil, M. G. Puder, D. Elcock, and R. J. Redweik, A White Paper Describing Produced Water from Production of Crude Oil, Natural Gas, and Coal Bed Methane, Prepared by: Argonne National Laboratory. Prepared for: U.S. Department of Energy National Energy Technology Laboratory under Contract W-31-109-Eng-38. Argonne Natl Lab Report, Prep US Dep Energy Natl Energy Technol Lab, 2004, vol. 1–87 Search PubMed.
- J. Veil, U. S. Produced Water Volumes and Management Practices in 2017, 2020 Search PubMed.
- J. Veil, U. S. Produced Water Volumes and Management Practices, 2015 Search PubMed.
- R. B. Jackson, A. Vengosh, J. W. Carey, R. J. Davies, T. H. Darrah, F. O'Sullivan and et al, ., The environmental costs and benefits of fracking, Annu. Rev. Environ. Resour., 2014, 39, 327–362 CrossRef.
- B. D. Lutz, A. N. Lewis and M. W. Doyle, Generation, transport, and disposal of wastewater associated with Marcellus Shale gas development, Water Resour. Res., 2013, 49(2), 647–656 CrossRef CAS.
- M. Medina, T. Willis, A. Onukwu and S. Schon, Technology Challenges, Opportunities of Next 25 years, The Way Ahead, 2011, 07(03), 15–17 CrossRef.
- B. Wright, The Produced Water Conundrum, Water grows across unconventional, J. Pet. Technol., 2022, 1–14 Search PubMed.
- D. A. Cypser and S. D. Davis, Induced seismicity and the potential for liability under U.S. law, Tectonophysics, 1998, 289(1–3), 239–255 CrossRef.
- B. K. Darling, Fracturing and Natural Gas in Groundwater: Is There a Connection?, J. Pet. Technol., 2015, 67(07), 22–23 CrossRef.
- S. Whitfield, Water Management for Enhanced Oil Recovery Projects, vol. 4, Oil and Gas Facilities, 2015 Search PubMed.
- B. R. Scanlon, R. C. Reedy and B. D. Wolaver, Assessing cumulative water impacts from shale oil and gas production: Permian Basin case study, Sci. Total Environ., 2022, 811, 152306, DOI:10.1016/j.scitotenv.2021.152306.
- K. Dahm and M. Chapman, Produced Water Treatment Primer: Case Studies of Treatment Applications, US Dep Inter Bur Reclam Prog Rep, 2014, 1–70 Search PubMed.
- B. Lyons, J. Tintera and K. Wright, Sustainable Produced Water Policy , Regulatory Framework , and Management in the Texas Oil and Natural Gas Industry, 2019, pp. 1–47. Available from: https://texasalliance.org/white-paper/ Search PubMed.
- R. Lee, R. Seright, M. A. Hightower, M. Sattler, B. Cather, L. McPherson, et al.Strategies for Produced Water Handling in New Mexico- Ground Water Protection Council Produced Water Conference, Colorado Springs, CO, 2002. Available from: http://www.gwpc.org/Meetings/PW2002/Papers-Abstracts.htm Search PubMed.
- J. A. Veil and C. E. Clark, Produced-water-volume estimates and management practices, SPE Prod. Oper., 2011, 26(3), 234–239 CAS.
- L. Arowoshola, G. Cope, V. David, C. Gasson, M. Gonzalez, M. Kelleher, et al., Produced Water Market - Opportunities in the Oil, Shale and Gas Sectors in North America-Global Water Intelligence, 2011 Search PubMed.
- R. R. Nair, E. Protasova, T. Bilstad and S. Strand, Evaluation of nanofiltration membrane process for smartwater production in carbonate reservoirs from deoiled produced water and seawater, SPE Prod. Oper., 2019, 34(2), 409–420 CAS.
- R. W. Gentry and A. W. McCray, Effect of Reservoir and Fluid Properties on Production Decline Curves, Soc. Pet. Eng. AIME, 1978, 30, 1327–1341 Search PubMed.
- J. J. Arps, Analysis of Decline Curves, Trans. AIME, 1945, 160, 228–247 CrossRef.
- E. Shirman, Universal approach to the decline curve analysis, J. Can. Pet. Technol., 1998, 38(13), 1–4 Search PubMed.
- M. J. Fetkovich, Decline Curve Analysis Using Type Curves - Fractured Wells, Soc. Pet. Eng., 1980, 1065–1077 Search PubMed.
- M. J. Fetkovich, M. E. Vienot, M. D. Bradley and U. G. Kiesow, Decline-Curve Analysis Using Type Curves - Case Histories, SPE Form. Eval., 1987, 2(4), 637–656 CrossRef.
- M. C. Ng and R. Aguliera, Decline NFR - A computerized process for decline curve analysis of reservoirs with single and dual porosity behaviour, Annu Tech Meet 1992 Pet Soc Canada, 1992 Search PubMed.
- D. P. Giovanni, H. Cinco-Ley and H. J. Ramey, Decline Curve Analysis Using Type Curves for Two-Porosity Systems, Soc. Pet. Eng. AIME, 1981, 21(3), 354–362 CrossRef.
- R. Camacho-Velázquez, G. Fuentes-Cruz and M. Vásquez-Cruz, Decline-curve analysis of fractured reservoirs with fractal geometry, SPE Reserv. Eval. Eng., 2008, 11(3), 606–619 CrossRef.
- K. Li and R. N. Horne, An analytical model for production decline-curve analysis in naturally fractured reservoirs, SPE Reserv. Eval. Eng., 2005, 8(3), 197–204 CrossRef CAS.
- J. Rodríguez-Román and R. Camacho-Velázquez, Decline-curve analysis considering nonlaminar flow in dual-porosity systems, SPE Reserv. Eval. Eng., 2005, 8(6), 478–490 CrossRef.
- C. R. Vanorsdale, Evaluation of Devonian Shale Gas Reservoirs, SPE Reservoir Eng., 1987, 2(2), 209–216 CrossRef.
- L. F. H. Ayala and Y. Peng, Unified decline type-curve analysis for natural gas wells in boundary-dominated flow, SPE J., 2013, 18(1), 97–113 CrossRef CAS.
- H. Y. Chen and S. W. Poston, Application of a pseudotime function to permit better decline-curve analysis, SPE Form. Eval., 1989, 4(3), 421–428 CrossRef.
- M. L. Fraim and R. A. Wattenbarger, Gas Reservoir Decline-Curve Analysis Using Type Curves With Real Gas Pseudopressure and Normalized Time, SPE Form. Eval., 1987, 671–682 CrossRef.
- T. A. Blasingame, T. L. McCray and W. J. Lee, Decline Curve Analysis for variable Pressure Drop/Variable Flowrate Systems, SPE Gas Technol. Symp., 1991, 1–17 Search PubMed.
- R. G. Agarwal, D. C. Gardner, S. W. Kleinsteiber and D. D. Fussell, Analyzing well production data using combined type curve and decline curve analysis concepts, SPE Proc. Gas Technol. Symp., 1999, 2, 47–60 Search PubMed.
- P. P. Valkó and W. J. Lee, A better way to forecast production from unconventional gas wells, Proc. – SPE Annu. Tech. Conf. Exhib., 2010, 3, 1860–1875 Search PubMed.
- K. Jongkitfnarukom, N. Last, F. Humbertoescobcr and K. Maneeintr, A New Decline-Curve-Analysis Method for Layered Reservoirs, SPE J., 2020, 25(4), 1657–1669 CrossRef.
- M. Gorditsa, E. Bryan, G. J. Moridis and T. A. Blasingame, Mechanistic model validation of decline curve analysis for unconventional reservoirs, Proc. – SPE Annu. Tech. Conf. Exhib., 2020, 1–53 Search PubMed.
- A. Hong, R. B. Bratvold, L. W. Lake and L. M. Ruiz Maraggi, Integrating model uncertainty in probabilistic decline-curve analysis for unconventional-oil-production forecasting, SPE Reserv. Eval. Eng., 2019, 22(3), 861–876 CrossRef CAS.
- Z. Xi and E. Morgan, Combining decline-curve analysis and geostatistics to forecast gas production in the Marcellus shale, SPE Reserv. Eval. Eng., 2019, 22(4), 1562–1574 CrossRef CAS.
- T. A. Blasingame. Multiwell Decline Curve Analysis Using a Type Curve Approach, Unconv Resour Technol Conference, 2022, pp. 1–19 Search PubMed.
- A. Tadjer, A. Hong and R. Bratvold, Bayesian Deep Decline Curve Analysis: A New Approach for Well Oil Production Modeling and Forecasting, SPE Reserv. Eval. Eng., 2022, 25(3), 568–582 CrossRef CAS.
- J. S. Kim, H. J. Shin and J. S. Lim, Application of a probabilistic method to the forecast of production rate using a decline curve analysis of shale gas play, Proc. Int. Offshore Polar Eng. Conf., 2014, 3, 100–105 Search PubMed.
- A. Terminiello, P. Crespo and M. Nasca, Evaluating the performance of decline curve analysis equations during the early life of a well through the quantification of the uncertainty associated with the estimated ultimate recovery in a shale oil and gas formation, SPE/AAPG/SEG Lat Am Unconv Resour Technol Conf 2020, LURT 2020, 2020, (Figure 1) Search PubMed.
- A. Kianinejad, R. Kansao, A. Maqui, R. Kadlag, G. Hetz, F. Ibrahima, et al., Artificial-intelligence-based, automated decline curve analysis for reservoir performance management: A giant sandstone reservoir case study. Soc Pet Eng – Abu Dhabi Int Pet Exhib Conf 2019, ADIP 2019, 2019 Search PubMed.
- S. Bhattacharya and M. Nikolaou, Analysis of production history for unconventional gas reservoirs with statistical methods, SPE J., 2013, 18(5), 878–896 CrossRef.
- R. Gaskari, S. D. Mohaghegh and J. Jalali, An integrated technique for production data analysis (PDA) with application to mature fields, SPE Prod. Oper., 2007, 22(4), 403–416 CAS.
- B. Can and S. Kabir, Probabilistic production forecasting for unconventional reservoirs with stretched exponential production decline model, SPE Reserv. Eval. Eng., 2012, 15(1), 41–50 CrossRef CAS.
- Y. Cheng, Y. Wang, D. A. McVay and W. J. Lee, Practical application of a probabilistic approach to estimate reserves using production decline data, SPE Econ. Manag., 2010, 2(1), 19–31 CrossRef.
- X. Gong, R. Gonzalez, D. A. McVay and J. D. Hart, Bayesian probabilistic decline-curve analysis reliably quantifies uncertainty in shale-well-production forecasts, SPE J., 2014, 19(6), 1047–1057 CrossRef.
- A. Korde, S. D. Goddard and O. O. Awoleke, Probabilistic decline curve analysis in the permian basin using Bayesian and approximate Bayesian inference, SPE Reserv. Eval. Eng., 2021, 24(3), 536–551 CrossRef CAS.
- M. Paryani, O. O. Awoleke, M. Ahmadi, C. Hanks and R. Barry, Approximate Bayesian computation for probabilistic decline-curve analysis in unconventional reservoirs, SPE Reserv. Eval. Eng., 2017, 20(2), 478–485 CrossRef CAS.
- T. W. Patzek, F. Male and M. Marder, Gas production in the Barnett Shale obeys a simple scaling theory, Proc. Natl. Acad. Sci. U. S. A., 2013, 110(49), 19731–19736 CrossRef CAS PubMed.
- A. J. Clark, L. W. Lake and T. W. Patzek, Production forecasting with logistic growth models, Proc. – SPE Annu. Tech. Conf. Exhib., 2011, 1, 184–194 Search PubMed.
- S. A. Alarifi and J. Miskimins, A new approach to estimating ultimate recovery for multistage hydraulically fractured horizontal wells by utilizing completion parameters using machine learning, SPE Prod. Oper., 2021, 36(3), 468–483 CAS.
- D. S. Fulford, B. Bowie, M. E. Berry, B. Bowen and D. W. Turk, Machine learning as a reliable technology for evaluating time-rate performance of unconventional wells, SPE Econ. Manag., 2016, 23–39 CrossRef.
- J. Hagoort, Automatic decline-curve analysis of wells in gas reservoirs, SPE Reserv. Eval. Eng., 2003, 6(6), 433–440 CrossRef CAS.
- B. Li, T. C. Billiter and T. Tokar, Rescaling method for improved machine-learning decline curve analysis for unconventional reservoirs, SPE J., 2021, 26(4), 1759–1772 CrossRef CAS.
- H. H. Liu, J. Zhang, F. Liang, C. Temizel, M. A. Basri and R. Mesdour, Incorporation of Physics into Machine Learning for Production Prediction from Unconventional Reservoirs: A Brief Review of the Gray-Box Approach, SPE Reserv. Eval. Eng., 2021, 24(4), 847–858 CrossRef CAS.
- C. T. Temizel, U. Odi, N. Al-Sulaiman, K. Reddy, D. Putra, M. Yurukcu and et al, ., Production Forecasting in Conventional Oil Reservoirs Using Deep Learning, SPE West Reg Meet Proc, 2022,(Ml) Search PubMed.
- W. Jiang, B. Pokharel, L. Lin, H. Cao, K. C. Carroll, Y. Zhang and et al, ., Analysis and prediction of produced water quantity and quality in the Permian Basin using machine learning techniques, Sci. Total Environ., 2021, 801, 149693, DOI:10.1016/j.scitotenv.2021.149693.
- A. K. Ambastha and K. H. Wong, Decline curve analysis for canadian oil reservoirs under waterflood conditions, J. Can. Pet. Technol., 1995, 1–7 Search PubMed.
- A. N. Duong, A New Approach for Decline-Curve Analysis, Conf. Proc. SPE Prod. Oper. Symp., 1989, 1, 327–332 Search PubMed.
- W. Saputra, W. Kirati and T. Patzek, Generalized Extreme Value Statistics , Physical Scaling and Forecasts of Oil Production from All Vertical Wells in the Permian Basin, 2022 Search PubMed.
- B. R. Scanlon, R. C. Reedy, F. Male and M. Walsh, Water Issues Related to Transitioning from Conventional to Unconventional Oil Production in the Permian Basin, Environ. Sci. Technol., 2017, 51(18), 10903–10912 CrossRef CAS PubMed.
- K. A. Lawal, E. Utin and K. Langaas, A didactic analysis of water cut trend during exponential oil-decline. Soc Pet Eng – Niger Annu Int Conf Exhib, 2007, NAICE, 2007, p. 2007 Search PubMed.
- D. Ilk, J. A. Rushing, A. D. Perego and T. A. Blasingame, Exponential vs. hyperbolic decline in tight gas sands -understanding the origin and implications for reserve estimates using arps' decline curves, Proc. - SPE Annu. Tech. Conf. Exhib., 2008, 7, 4637–4659 Search PubMed.
- S. Varma, S. H. Tabatabaie, J. Ewert and L. Mattar, Variation of hyperbolic-b-parameter for unconventional reservoirs, and 3-segment hyperbolic decline, Unconv. Resour. Technol. Conf., 2018, 23–25 Search PubMed.
- D. R. Long and M. J. Davis, A new approach to the hyperbolic curve, J. Pet. Technol., 1987, 909–912 Search PubMed.
- P. Ye, F. Luis and H. Ayala, Straightline analysis of flow rate vs. cumulative-production data for the explicit determination of gas reserves, J. Can. Pet. Technol., 2013, 52(4), 296–305 CrossRef CAS.
- M. J. Fetkovich, E. J. Fetkovich and M. D. Fetkovich, Useful concepts for decline curve forecasting, reserve estimation, and analysis, SPE Reservoir Eng., 1996, 13–22 CrossRef CAS.
- E. W. Bryan, D. Symmons, D. Ilk and T. A. Blasingame, The Utilization of the “Rate-Integral” to Assist with Decline Curve Analysis of Poor-Quality Unconventional Time-Rate Data, Proc.-Unconv. Resourc. Technol. Conf., 2021, 3(1989), 1–46 Search PubMed.
- S. R. Robichaud and N. W. Robichaud, Lithium - Recovery from Naturally Occurring Permian Basin Waste Water, Miner. Resour., 2019, 42475 Search PubMed.
- M. J. Fetkovich, Decline curve Analysis Using Type Curves, Soc. Pet. Eng. AIME, 1973,(1973), 1–28 Search PubMed.
- T. Marhaendrajana and T. A. Blasingame, Decline Curve Analysis Using Type Curves - Evaluation of Well Performance Behavior in a Multiwell Reservoir System, SPE Annu. Tech. Conf. Exhib. Louisiana, 2001, 1–15 Search PubMed.
- J. D. Wright, Introduction to Advanced Decline Curve Analysis, in Oil and Gas Property Evaluation. 2021 edn, Thompson-wright, LLC, Colorado, 2021, pp. 265–308 Search PubMed.
- R. James, Production Forecast, 2022. Available from: https://www.naturalgasintel.com/u-s-oil-production-hits-new-2022-peak-but-more-runway-ahead-for-growth/?v=SD_PopPosts Search PubMed.
Footnotes |
| † Electronic supplementary information (ESI) available. See DOI: https://doi.org/10.1039/d2va00282e |
| ‡ Bbbl – billion barrels. |
| § MMbbl/d – million barrel per day. |
| ¶ bbl/bbl – barrel/barrel. |
| This journal is © The Royal Society of Chemistry 2023 |

