 Open Access Article
Creative Commons Attribution 3.0 Unported Licence
Highly active and selective Li/MgO catalysts for methane transformation to C2 hydrocarbons: experimental and DFT study†
Rohan Singh
Pal
ab,
Swati
Rana
a,
Souvik
Sadhu
a,
Tuhin Suvra
Khan
ab,
Mukesh Kumar
Poddar
a,
Rajib Kumar
Singha
a,
Suman
Sarkar
c,
Rahul
Sharma
d and
Rajaram
Bal
 *ab
*ab
aLight Stock Processing Division, CSIR-Indian Institute of Petroleum, Dehradun, 248005, India. E-mail: raja@iip.res.in; Fax: +91 135 2660202; Tel: +91 135 2525917
bAcademy of Scientific and Innovative Research (AcSIR), Ghaziabad, 201002, India
cIndian Institute of Technology, Jammu, NH-44, PO Nagrota, Jagti, Jammu and Kashmir, 181221, India
dGAIL (India) Ltd, GAIL Training Institute Plot No. 24, Sector 16-A, Noida, Uttar Pradesh, India
First published on 20th December 2022
Abstract
The development of energy-efficient and economically attractive ways of utilization of methane for the production of chemicals/liquid fuels remains one of the long-standing challenges in catalysis. Li/MgO catalysts synthesized by a successive deposition–sublimation method show high activity and stability during the oxidative conversion of methane to olefins. A surfactant-assisted solvothermal method was used to synthesize the MgO support and then Li was deposited onto the support MgO by applying a successive deposition–sublimation method, where the initially deposited Li was sublimated and stabilized at 900 °C and this process was done for two consecutive times to prepare the final Li-doped MgO catalyst. For comparison purposes, several Li loaded catalysts were also prepared by the deposition method only. Different analytical techniques were used to characterise the prepared catalysts in order to understand and relate their physico-chemical properties to their catalytic activity. The catalyst prepared by the deposition–sublimation method (3.6Li/MgODep–Sub) showed high methane conversion and C2 selectivity compared to the catalysts prepared by only deposition method. The 3.6Li/MgODep–Sub catalyst showed ∼38% CH4 conversion with 55% ethylene selectivity and 23% ethane selectivity with a total C2 selectivity of 78% at 700 °C, and the catalyst was highly stable without losing its activity even after 24 h time on stream. It was found that the catalyst prepared by the deposition method deactivates rapidly with time and the activity is also low. DFT studies showed that Li doping to MgO has a significant promotional effect on the methane C–H activation. The C–H activation barrier was reduced by nearly 85 kcal mol−1 over the Li-doped MgO surface, Li2–MgO(100), compared to the undoped MgO(100) surface.
1. Introduction
Methane, a primary component of natural gas, is an abundant resource of hydrocarbons mainly used as an inexpensive and clean-burning fuel. Because of the abundance of natural gas globally, it is economically beneficial to convert methane into more valuable products. Natural gas reserves are sometimes located far from the place of being used. Because it is not always cost-effective to transport liquefied natural gas, efficient methods for converting methane into transportable liquid products are required. Oxidative dimerization of methane followed by oligomerization of C2 products becomes a positive approach for this. For more than a decade, scientists around the globe have been trying to develop suitable methods to convert methane to ethane, ethylene, methanol, etc. Methane can be transformed into value-added C2 hydrocarbons like ethane and ethylene by heating it in two conventional ways.1 One is called “oxidative coupling of methane” (OCM), where heat treatment of methane is performed in the presence of oxygen, and the other one is called “non-oxidative coupling of methane” (NOCM), where methane is heat-treated in the absence of oxygen.2 The non-oxidative process involves the coupling of methane to olefins, and the process is thermodynamically limited and hence requires higher energy for large-scale applications. Therefore, most of the research for direct conversion is focused on the OCM process.2 OCM in the presence of an oxidant is an exothermic process. The OCM is expressed by the following chemical reaction:| 2CH4 + 1/2O2 → C2H6 + H2O |
| C2H6 + 1/2O2 → C2H4 + H2O |
Spectroscopic studies conducted by several researchers have confirmed the presence of different surface oxygen species present in the catalysts, such as peroxide (O22−), lattice oxygen (O2−), carbonate (CO32−), superoxide (O2−), and hydroxide ions (OH−).3,4 Among all these, surface lattice oxygen (O2−) and superoxide anions (O2−) play an important role in the selective C2 hydrocarbon formation.4 On the other hand, surface electrophilic anions usually result in the overoxidation of alkane to COX products.5,6 After the pioneering work by Keller and Bhasin,7 a large number of catalysts were tested for the OCM reaction. But none of the catalysts has yet to find a successful path in the industry due to a failure to suppress combustion reactions at relatively high CH4 conversions.8–12 Nanowire catalysts by the Siluria group are the only catalysts that have gained some popularity, reaching a pilot plant level.13,14 Earlier studies were carried out to maximize C2 yield by varying the composition of the catalyst and reaction parameters, but economic evaluation revealed that the selectivity of C2 hydrocarbons is more important than C2 yields.8,15 Studies say that catalysts play the primary role in producing C2 hydrocarbons that affect methane conversion and C2 selectivity in OCM. To date, several catalysts have been developed; including lanthanide series oxides,16–18 Na–W–Mn mixed metal oxides,19 and alkaline-earth metal oxides20–22 for OCM reaction. It is reported that the surface basicity of the catalysts, especially intermediates and strong basic sites, contributes to better C2 hydrocarbon selectivity by a synergistic effect.16,21,23 The Li–MgO catalysts were extensively studied for OCM, but their low stability due to the vaporization of Li is a major concern.24–30 Recently, Huang et al. reported that a single-site Li–MgO catalyst exposes fourfold-coordinated Mg2+ sites (i.e., Mg4C2+) of MgO (110) facets which efficiently catalyze methane activation by the methyl radical route.31 They have reported 35.2% methane conversion and 58.2% C2 selectivity but the drawback is that the catalyst is stable for only 5 hours. Weaver et al. investigated the OCM reaction using rare earth oxide catalysts supported on nanoparticle magnesium oxide doped with alkali and alkaline earth metals (Li, Na) (Mg, Ca), where it was found that Li–TbOx/MgO performed better than all other combinations of rare earth oxide.21 There are recent reports that indicate that the amount of Li in Li–MgO catalysts affects the MgO microstructure, which can be demonstrated by measuring the methyl radical intermediates during catalysis.24,32–34 The Li+ ions were incorporated into the MgO lattice as substitutional ions on magnesium sites with oxygen vacancies for charge compensation. As a result, lithium promotion does not create additional active sites but increases the concentration of defect sites in MgO. This is in agreement with previous work that lithium cations (Li+) and oxygen vacancies at the MgO surface tend to separate at steps and corners, improving the number of low-coordinated Mg2+O2− sites. As a result, catalyst activity and selectivity can be improved.35 Sweeney et al. proposed that there were two forms of Mg: Mg2+ at a Li site and a Mg+ complex.36
In the present work, we have prepared a stable Li/MgO catalyst via a successive deposition–sublimation method and the catalyst shows ∼38% conversion with 55% ethylene selectivity and 23% ethane selectivity and by combining them a total C2 selectivity of 78%, and the catalyst was highly stable without losing its activity even after 24 h time-on-stream.
2. Experimental section
2.1. Materials
LiNO3 (99.8%) and Mg(NO3)2·6H2O were purchased from Alfa Aesar, and cetyltrimethylammonium bromide (CTAB) was purchased from Sigma Aldrich. All chemicals were used without further purification.In a similar manner, 10% and 15% Li/MgO catalysts were synthesized by varying the LiNO3 amount and the catalysts are denoted as 3.8Li/MgODep and 7.4Li/MgODep.
2.2. Catalyst characterizations
All the synthesized fresh and spent catalysts were characterized by various analytical techniques. Details of characterization techniques are given in the ESI.†2.3. Catalytic activity study
Details of the catalytic activity measurements are given in the ESI.†3. Results and discussion
3.1. BET surface area and ICP-AES analysis
The Li amounts present in the catalysts were determined from the ICP-AES analysis of all the fresh and spent catalysts and the results are shown in Table 1. The MgO support showed a surface area of 62.8 m2 g−1 and the surface area was decreased after Li loading due to the surface coverage of Li.37 The ICP analysis shows that during high-temperature heat treatments, a significant amount of Li loss was also noticed (Table 1). All the samples (1.9Li/MgODep, 3.8Li/MgODep, 7.4Li/MgODep) show a considerable decrease in Li amount after high temperature heat treatment in air. From the ICP analysis, 1.9Li/MgODep contains only 1.9% Li, i.e. 3.1% (∼62%) loss from the actual loaded Li% (5%) was noticed during the calcination process, while 3.8Li/MgODep contains 3.8 wt% Li, and 7.4Li/MgODep has 7.4 wt% of Li after the calcination from the actually loaded Li (10%, 15% respectively). The catalyst prepared by deposition–sublimation (Li/MgODep–Sub) contains 3.6% Li. It has to be noted that the 3.6Li/MgODep–Sub catalyst showed almost negligible loss of Li (0.1% loss after 24 h reaction) after the OCM reaction as compared to the catalysts prepared by the deposition method, suggesting that the Li species are stable for the 3.6Li/MgODep–Sub catalyst as compared to the higher loading Li catalyst (3.8Li/MgODep and 7.4Li/MgODep catalyst) prepared by the deposition method.| Catalyst | Li% | BET surface area (m2 g−1) | ||
|---|---|---|---|---|
| After calcination | After reaction at 700 °C | After calcination | After reaction at 700 °C | |
| MgO | — | — | 62.8 | 48.6 |
| 1.9Li/MgODep | 1.9 | 1.1 | 23.4 | 22.1 |
| 3.8Li/MgODep | 3.8 | 2.6 | 16.6 | 13.1 |
| 3.6Li/MgODep–Sub | 3.6 | 3.6 | 13.3 | 13.2 |
| 7.4Li/MgODep | 7.4 | 4.8 | 5.3 | 3.4 |
3.2. XRD analysis
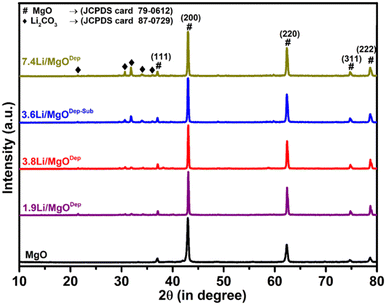
Fig. 1 shows the XRD patterns of the synthesized MgO support and Li/MgO catalysts. All the XRD patterns exhibited sharp peaks with the highest intensity peak at a 2θ value of 42.88° for the (200) plane of MgO (JCPDS Card 79-0612) indicating higher crystalline nature of the catalysts. The XRD pattern of all the lithium supported on MgO catalysts shows additional peaks corresponding to Li2CO3 (JCPDS Card 87-0729). This is because Li is highly basic in nature and Li2O decomposed from LiNO3 reacted quickly with acidic CO2 in air to generate Li2CO3 at room temperature. Above 500 °C, Li2CO3 dissociates into Li2O and CO2,38 implying that Li2O should be in the predominant state at reaction temperatures above 600 °C.39 The XRD pattern also showed that as the Li loading increases, the peaks corresponding to Li2CO3 were intensified, showing the higher Li2CO3 formation. In addition, the peak width of all Li-supported catalysts decreases slightly compared to the parent MgO.It was noticed that the peak for the [200] plane of MgO at 42.88° shifted to a higher value at 43.00°. Vegard's law states that if the doping element (Li) is smaller than the replaced element (Mg), the lattice parameter will decrease for the parent material (MgO). In fact, a decrease in the lattice parameter from 2.1037 Å for pure MgO to 2.0987 Å for all Li doped samples confirms Li substitution in the MgO matrix.40,41 This observation revealed that some of the Li atoms replaced Mg atoms in the MgO crystal lattice and decreased the lattice size of MgO.42,43
XRD of the spent catalysts were also analysed (Fig. S1, ESI†) and all the spent catalysts have similar XRD patterns to that of the fresh catalysts. All the spent catalysts show peaks corresponding to Li2CO3, which suggests that Li is still present in the catalyst in the form of Li2CO3 after the catalysis; however, a decrease in the intensity of Li2CO3 peaks in all the catalysts except the 3.6Li/MgODep–Sub catalyst was observed, indicating Li sublimation during catalysis. We also calculated the crystallite size of the catalyst and tabulated the results in Table S1 (in ESI†).
3.3. STEM-EELS analysis
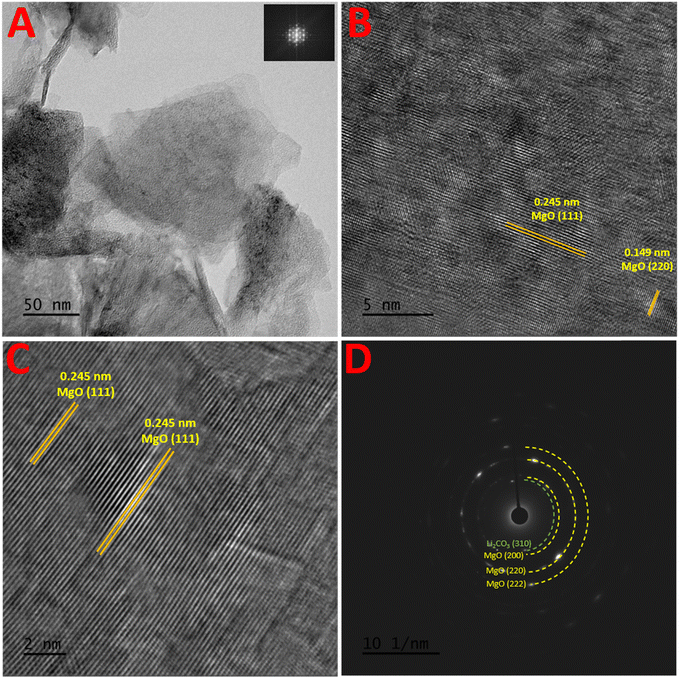
Using STEM, the morphologies of the prepared 3.6Li/MgODep–Sub catalyst were examined, and the images obtained from the direct beam contrast bright field image STEM analysis (This is high magnification bright field image) are provided in Fig. 2A. The FFT image is also shown in the inset of Fig. 2A. The high-resolution phase contrast images of the same region are also included in Fig. 2B and C. Lattice fringes with d spacing value of 0.245 nm, corresponding to MgO [111] facets can be seen. Additionally, 0.149 nm lattice fringes can also be observed in the catalyst, which correspond to the MgO [220] plane.The d spacing (2.25 Å) calculated from the SAED pattern (Fig. 2D) confirms the presence of lithium corresponding to the (310) plane of Li2CO3. Also, the EELS spectra have been obtained from the region and shown in Fig. S9 (in the ESI†). The low loss region of the spectrograph confirms the presence of lithium in the 3.6Li/MgODep–Sub catalyst where the signature of 55.1 eV energy loss for Lithium is observed.
3.4. CO2-TPD analysis
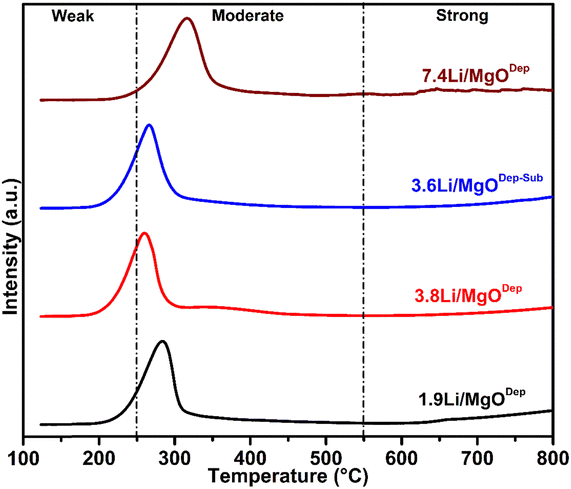
According to XPS measurement (discussed later), there was a carbonate species present on the catalyst surface and hence carbon dioxide was strongly adsorbed on the catalyst surface, suggesting that the catalyst surface is basic. That's why surface basic properties of catalysts were investigated by CO2-TPD analysis. Fig. 3 represents the CO2 desorption profiles of catalysts with different Li-loaded MgO catalysts. There is almost no difference in the shape of the desorption peak in the temperature range between 50 and 800 °C for all the prepared catalysts. The temperature interval at which the CO2 chemisorbed on the basic sites is desorbed can be used to describe the strength of a certain group of basic sites. The area under the TPD curve of the basic sites was used to estimate their basic strength. Furthermore, the CO2-TPD profile of the Li/MgO catalysts (Fig. 3) shows only two types of peaks, mostly known as weak and moderate basic sites, whereas the third kind of site (strong basic sites) appeared to be absent or present only in negligible amounts. The peak in the temperature range below 250 °C, which corresponds to weak basic sites, might be assigned to the metal–oxygen pair, i.e. Mg–O in this case, as well as surface oxygen anions. The higher temperature peak (between 250 and 550 °C) corresponding to moderate basic sites may be ascribed to the presence of unsaturated oxygen (O2−) ions and the lattice oxygen anions.18,44 The amounts of different basic sites are tabulated in Table 2. It was found that the total amount of basic sites was maximum in the case of the 7.4Li/MgODep catalyst. The strength of basic sites is found to vary with the substitution of Mg2+ with the alkali metal cation Li+. As previously stated, low-coordination oxygen anions are responsible for the high amount of basic sites; the greater the electron-donating ability of anionic oxygen, the stronger its basicity.45,46 It has to be noted that alkali metal cations such as Li+ have a lower electronegativity than alkaline earth metal ions like Mg2+, so by introducing alkali metal cations Li+ to the vicinity of Mg2+, the electron-donating properties of oxygen anions adjacent to Mg2+ increases, which increases the basic strength.| Catalyst | Amount of basic sites (cm3 g−1) | ||
|---|---|---|---|
| Weak basic sites | Medium basic sites | Total basic sites | |
| 1.9Li/MgODep | 1.09 | 8.81 | 9.90 |
| 3.8Li/MgODep | 3.36 | 10.71 | 14.07 |
| 3.6Li/MgODep–Sub | 4.84 | 11.84 | 16.68 |
| 7.4Li/MgODep | 2.30 | 17.50 | 19.80 |
CO2-TPD study could provide useful information on catalytic performance because the generation of methyl radicals is likely related to the basicity of the catalyst. As shown in Fig. 3 and Table 2, the CO2-desorption signals and the amount of moderate as well as total basic sites of the 3.6Li/MgODep–Sub catalyst are greater than those of the catalyst prepared by the deposition method (1.9Li/MgODep and 3.8Li/MgODep). The OCM activity is closely correlated with the number of basic sites derived from CO2-TPD data (Table 2). Despite its significantly stronger basicity than other prepared catalysts, the 7.4Li/MgODep catalyst was shown to be less OCM active than the other catalysts. We believe that the competitive deep oxidation or larger crystallite size could be responsible for the 7.4Li/MgODep catalyst's poor OCM performance showing less C2 selectivity. Furthermore, the lack of activity and selectivity of this catalyst would be explained by the loosely bound surface active oxygen species and lattice oxygen.
In the case of the 3.6Li/MgODep–Sub catalyst, a sufficient amount of moderate basic sites is responsible for its high activity and selectivity. In addition, the active oxygen species (O2− and lattice oxygen) responsible for the basicity of the catalyst are tightly bound to its surface due to high temperature heat treatment during the synthesis procedure, explaining why it shows stable activity during the reaction.
3.5. XPS analysis
Fig. 4 shows Mg 2p, Mg 1s, Li 1s and O 1s peaks of all the prepared catalysts. The position of the Mg 1s peaks is similar in all samples at approximately 1303.3 eV, which is the typical B.E for Mg 1s,31 this implying that the status of Mg–O bonds is unaffected by the doping of Li. The Mg 1s peak in the Li–MgO catalysts becomes weaker with increasing Li loading, and a similar pattern is also observed with the Mg 2p peak at 49.9 eV.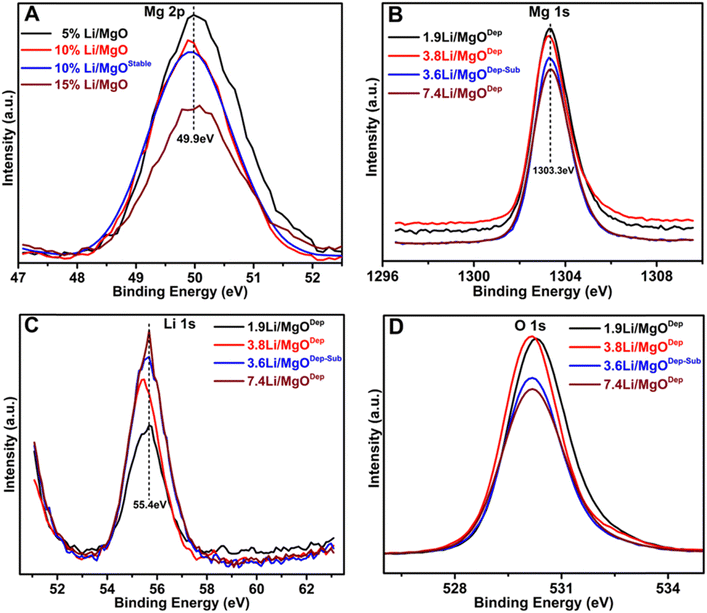 | ||
| Fig. 4 XPS analysis of the fresh catalyst: (A) Mg 2p spectra, (B) Mg 1s spectra, (C) Li 1s spectra and (D) O 1s spectra. | ||
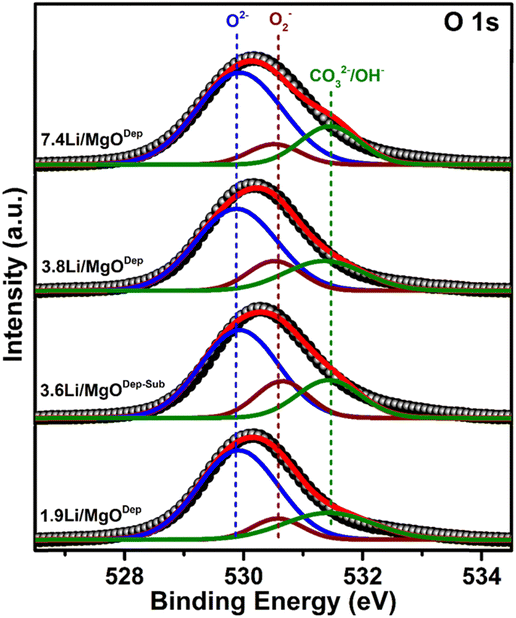
Furthermore, in all the catalysts, the peak of Li 1s appears at around 55.4 eV, which is almost around the typical B.E for Li.31 The deconvoluted O 1s peaks are shown in Fig. 5. It was found that three types of oxygen species, i.e. superoxide species (O2−), negatively charged oxygen species (lattice oxygen; O2−), and hydroxyl species (OH−) or carbonate species (CO32−) are present over all the catalysts. It was found that the relative superoxide species concentration (O2−) follows the order: 3.6Li/MgODep–Sub > 3.8Li/MgODep > 1.9Li/MgODep > 7.4Li/MgODep. So, it is evident that the formation of superoxide species (O2−) is higher in the case of the 3.6Li/MgODep–Sub catalyst and this species is responsible for activating methane by showing higher activity than all others.
If we look at the O 1s peak in all the prepared catalysts, we observe that all show the O 1s peak between 528 and 533 eV and that the intensity of the O 1s peak is highest for the 3.8Li/MgODep catalyst as compared to the 1.9Li/MgODep, 7.4Li/MgODep and 3.6Li/MgODep–Sub catalyst, which may be due to higher Li loading on the MgO support.
Furthermore, Fig. 5 shows the deconvoluted spectra of O 1s peaks for all the prepared catalysts, which shows the peak at B.E ∼ 529.8 eV which corresponds to lattice oxide O2−, ∼530.5 eV corresponding to the superoxide species (O2−) and ∼531.7 eV which may correspond to carbonates (CO32−) or may be hydroxide species (OH−).47,48 Formation of carbonate species might be due to carbon dioxide adsorbed from the atmosphere and also it is indicative of the highly basic nature of the prepared material, which is also shown by CO2-TPD analysis. The presence of significant hydroxide species from the XPS analysis could be explained by the fact that Li and MgO are very hygroscopic in nature and formed hydroxide species by adsorbing water from the air.
Moreover a slightly positive shift from 529 eV to 529.8 eV of the metal oxide peak (O2−) is observed in the deconvoluted O 1s XPS spectra. This shift has been determined to be a true chemical effect, rather than a result of charging or instrumental error. Such a shift represents the slightly more oxidised environment of oxygens existing in the near-surface region.49 This chemical effect, which may arise due to the different metal to oxygen bond environment, appeared after Li loading.
3.6. Raman analysis
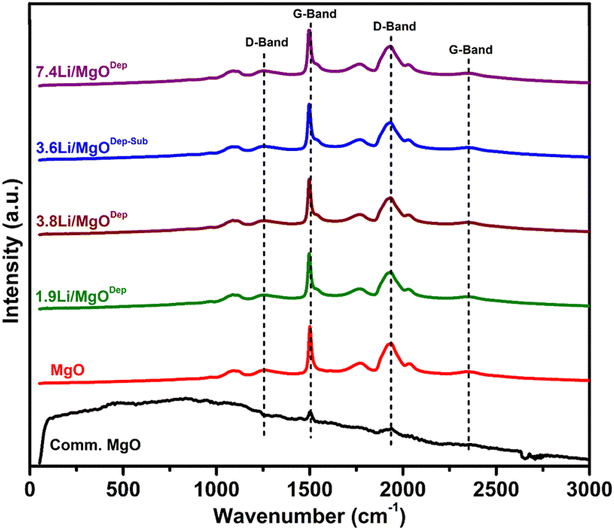
Raman analysis results are shown in Fig. 6. The results show that pure MgO has a Raman-active mode due to surface effects, which can lead to surface modes, and these are expected in nanostructured catalysts, as proven by DFT experiments on MgO nanotubes.50 When the Raman spectrum of commercial MgO was compared with the prepared MgO support, it was observed that the commercial MgO has only minor G-band at around 1500 cm−1 and a D-band at 1931 cm−1 which could be due to the lack of Raman activity in the commercial MgO. Literature reports also suggest that crystal symmetry is responsible for the inactivity of Raman for bulk MgO.51,52Fig. 6 reveals that all the Li doped samples have essentially identical Raman spectra to the pure MgO support, which could be owing to the lack of active Raman modes for Li2O or Li2CO3. For all samples, a weak peak is observed around 1088 cm−1 and surface phonon modes are responsible for this peak.52,53 For all the prepared catalysts, a broad peak at 1261 cm−1 is due to the D-band and additionally there is also a sharp peak at about 1500 cm−1 due to the presence of the G-band.54,55 Similarly, a broad band at about 2360 cm−1 represents a G-band and a strong D-band can also be seen at lower frequencies at ∼1931 cm−1. It is reported that these peaks appear because carbon is bonded to MgO forming MgCO3.55 The Raman spectra of all Li-doped catalysts are nearly identical to those of pure MgO, although the D and G bands shift slightly to lower wavelengths as the Li loading increases.We also conducted an in situ Raman investigation of the 3.6Li/MgODep–Sub catalyst in CH4 + O2 flow at various temperatures to obtain information about any structural changes in the catalyst during reaction. As can be observed in Fig. 7, the intensity or integrated peak area of the peaks corresponding to the D and G bands decreased as the temperature increased. Increased disorder in the structure of MgO and partial decomposition of MgCO3 present in the catalyst at higher temperatures could explain this decrease in peak intensity with increasing temperature.56 It is noteworthy that in the reaction environment (CH4 + O2) at 800 °C, the same bands with comparable peak shapes but with a decreased intensity still exist, indicating that some changes are occurring in the catalyst, but these changes do not affect its catalytic activity.
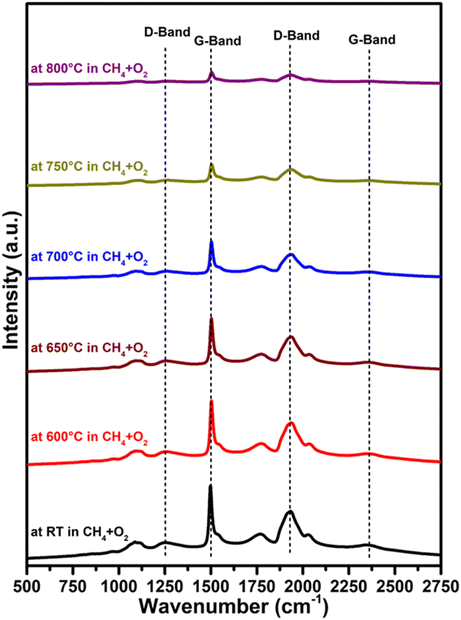 | ||
Fig. 7
In situ Raman spectra of the 3.6Li/MgODep–Sub catalyst at the indicated temperature in CH4 + O2 flow in 2![[thin space (1/6-em)]](https://www.rsc.org/images/entities/char_2009.gif) : :![[thin space (1/6-em)]](https://www.rsc.org/images/entities/char_2009.gif) 1 ratio. 1 ratio. | ||
3.7. In situ DRIFTS analysis
Fig. 8 shows the in situ DRIFTS spectra for the pure MgO support and 3.6Li MgODep–Sub catalysts under N2 + CH4 + O2 conditions. The spectral bands attributed to carbonate species and CO2 species have variations in the DRIFTS spectra (associated by reaction feed) (Fig. 9). It was found that a band at around 1620 cm−1 (between 1530 and 1650 cm−1) is present on the 3.6Li/MgODep–Sub catalyst and this peak is missing over support MgO. This band is due to the C![[double bond, length as m-dash]](https://www.rsc.org/images/entities/char_e001.gif) C stretching frequency of olefinic species formed during reaction.57 Peaks at 1304 and 3016 cm−1 are attributed to free CH4, whereas a peak at 1343 cm−1 is assigned to bidentate carbonate species. Three additional peaks at 1080, 1435 and 1495 cm−1 are found over the 3.6Li/MgODep–Sub catalyst due to the formation of monodentate carbonate species.58,59 Monodentate carbonate species are generated by the presence of basic O2− ions, which are not present in the case of support MgO. When methane is chemisorbed in a dissociative manner, the stronger O2− ions cause the C–H bond to break.58 So, in the case of the 3.6Li/MgODep–Sub catalyst, the presence of stronger O2− ions helps to break the C–H bond of methane easily compared to the MgO support. The band at 3770 cm−1 in Fig. 8 is the OH stretching vibration region implying the existence of hydrogen bound hydroxyl species on the catalyst surface under the reaction conditions.59 It was also noticed that the band at 3770 cm−1 is prominent in the case of the 3.6Li/MgODep–Sub catalyst indicating the formation of hydroxyl species compared to the MgO support. It has to be noted that water is formed during the OCM reaction.
C stretching frequency of olefinic species formed during reaction.57 Peaks at 1304 and 3016 cm−1 are attributed to free CH4, whereas a peak at 1343 cm−1 is assigned to bidentate carbonate species. Three additional peaks at 1080, 1435 and 1495 cm−1 are found over the 3.6Li/MgODep–Sub catalyst due to the formation of monodentate carbonate species.58,59 Monodentate carbonate species are generated by the presence of basic O2− ions, which are not present in the case of support MgO. When methane is chemisorbed in a dissociative manner, the stronger O2− ions cause the C–H bond to break.58 So, in the case of the 3.6Li/MgODep–Sub catalyst, the presence of stronger O2− ions helps to break the C–H bond of methane easily compared to the MgO support. The band at 3770 cm−1 in Fig. 8 is the OH stretching vibration region implying the existence of hydrogen bound hydroxyl species on the catalyst surface under the reaction conditions.59 It was also noticed that the band at 3770 cm−1 is prominent in the case of the 3.6Li/MgODep–Sub catalyst indicating the formation of hydroxyl species compared to the MgO support. It has to be noted that water is formed during the OCM reaction.
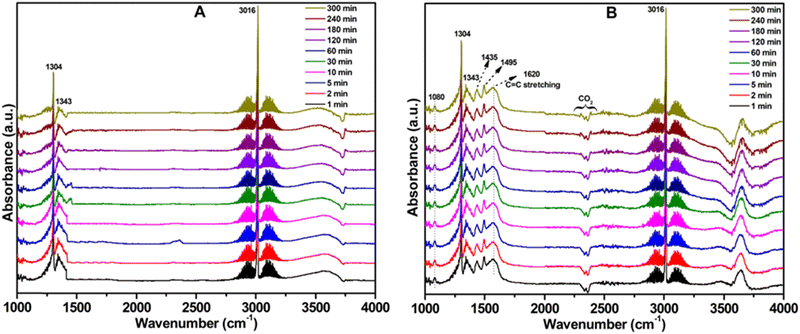 | ||
Fig. 8
In situ DRIFTS analysis: (A) MgO support and (B) 3.6Li/MgODep–Sub catalyst. Reaction conditions: temperature = 450 °C, N2![[thin space (1/6-em)]](https://www.rsc.org/images/entities/char_2009.gif) : :![[thin space (1/6-em)]](https://www.rsc.org/images/entities/char_2009.gif) CH4 CH4![[thin space (1/6-em)]](https://www.rsc.org/images/entities/char_2009.gif) : :![[thin space (1/6-em)]](https://www.rsc.org/images/entities/char_2009.gif) O2 = 7 O2 = 7![[thin space (1/6-em)]](https://www.rsc.org/images/entities/char_2009.gif) : :![[thin space (1/6-em)]](https://www.rsc.org/images/entities/char_2009.gif) 2 2![[thin space (1/6-em)]](https://www.rsc.org/images/entities/char_2009.gif) : :![[thin space (1/6-em)]](https://www.rsc.org/images/entities/char_2009.gif) 1, pressure = 1 bar, GHSV = 11 1, pressure = 1 bar, GHSV = 11![[thin space (1/6-em)]](https://www.rsc.org/images/entities/char_2009.gif) 250 mL h−1 gcat.−1. 250 mL h−1 gcat.−1. | ||
It was also noticed that in the case of the 3.6Li/MgODep–Sub catalyst an additional peak at 2350 cm−1 is observed, which is characteristic of adsorbed CO2,59 and this peak is absent in the case of MgO.
Bands near 3000 cm−1 can also be found due to the gas-phase methane adsorbed over the catalysts.59
3.8. Electron paramagnetic resonance (EPR) analysis
An Electron Paramagnetic Resonance (EPR) spectrum recorded at room temperature (Fig. S7 in ESI†) characterized the freshly prepared 3.6Li/MgODep–Sub catalyst showing g values at 2.07, 2.04, 2.00 and 1.99. It has to be noted that EPR is an amenable method to detect species having unpaired electrons, such as O2− and O− species and electrons trapped by oxygen vacancies. The g values obtained from the spectrum of the 3.6Li/MgODep–Sub catalyst can be compared well with O2− signals reported by Lunsford et al. at gxx = 1.994, gyy = 2.006, gzz = 2.040 on La2O3;60 and Wang et al. at gxx = 2.0001, gyy = 2.0045, gzz = 2.0685 on SrF2/La2O3.61 Thus signals on the 3.6Li/MgODep–Sub catalyst in this investigation can be attributed to surface electrophilic O2− species. A signal that appeared at a g value of 2.07 can also be attributed to the superoxide species coordinated to Mg2+ ions as reported by Lunsford et al.62 Additionally, some researchers attribute the signal that appeared at a g value of 2.00 to anionic vacancies or oxygen vacancies.63,64 Earlier reports suggest that oxygen-centred radicals (such as ˙O2−, ˙OH, and ˙OOH) can be formed on the surfaces of metal oxides having oxygen vacancies and could be detected by EPR and owing to the coordinatively unsaturated character of metal oxides, oxygen vacancies on the catalyst surface might act as sites for molecular oxygen activation via adsorption.63,644. Catalytic activity
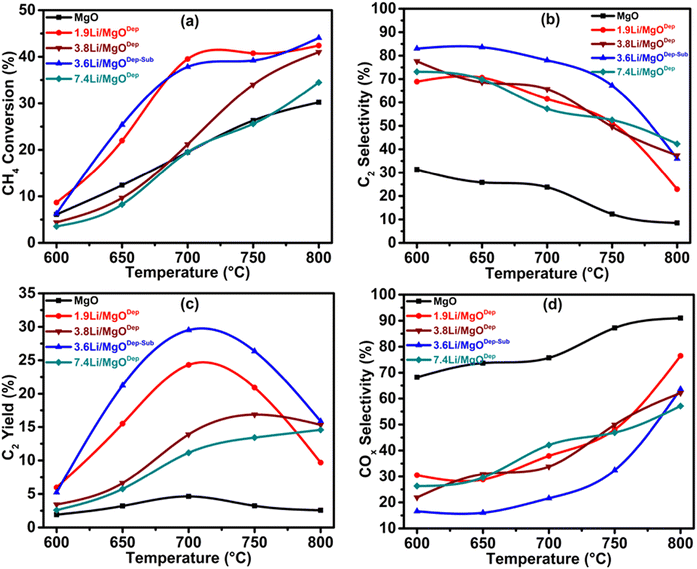
The conversion of methane to ethane and ethylene is carried out at temperatures ranging between 600 and 800 °C for all the prepared catalysts including the support MgO. It was found that the synthesized MgO showed negligible activity, where the C2 selectivity was only 23.8% at 700 °C and this activity was due to the presence of defects in the MgO crystals.65Fig. 9(b) shows that methane conversion increases after Li loading, and the selectivity of the C2 products also increases. It has to be noted that various Li doping catalysts resulted in the displacement of Mg2+ by Li+, leading to the formation of a negatively charged O centre and formation of the defect in the MgO matrix, which accounts for the increased activity of the different Li–MgO catalysts compared to pure MgO.22 The activity of our prepared Li–MgO catalyst is high compared to the earlier reported catalysts in the literature (see Table S2, ESI†). Fig. 9 shows the activity of the catalysts at different temperatures. At 700 °C, a higher methane conversion was observed for Li-doped MgO than for undoped MgO, and the C2 selectivity was greater than 80%. These findings show the generation of active species resulting from Li doping on MgO for the OCM reaction. In the case of methane conversion, all the Li-doped catalysts show low conversion at 600 °C and conversion increases with increasing temperature up to 800 °C. It was found that the activity of the catalyst follows the order: 3.6Li/MgODep–Sub > 1.9Li/MgODep > 3.8Li/MgODep > 7.4Li/MgODep catalyst at 700 °C, as shown in Fig. 9. C2 selectivity was high at 600 °C for all Li-doped MgO catalysts and decreases with increasing temperature up to 800 °C, whereas COx (CO and CO2) selectivity increases with increasing temperature indicating that at high temperatures, overoxidation of C2 products into COx occurs.4.1. Effect of GHSV on CH4 conversion, C2 selectivity and C2 yield as a function of temperature
In order to optimize the catalytic system, we tested the effect of GHSV with respect to the temperatures for all the catalysts. The results show that the 3.6Li/MgODep–Sub catalyst is more active and selective than other catalyst systems (Fig. 10). Over the 7.4Li/MgODep catalyst, the high Li content decreases the conversion of methane because of the fact that a high amount of Li could agglomerate resulting in increased particle size. The 3.6Li/MgODep–Sub catalyst provides the highest C2 yield (29.48%) by showing methane conversion of 37.8% with a C2 selectivity of 78% at 700 °C. The effect of GHSV on C2 selectivity and C2 yield with respect to temperature for all the tested catalysts is also shown in Fig. S3 (ESI†).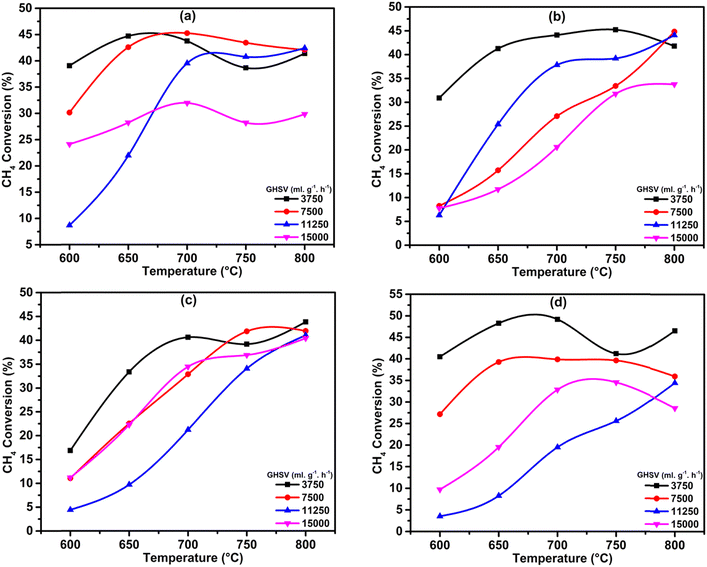 | ||
| Fig. 10 Effect of GHSV (in mL h−1 gcat.−1) on CH4 conversion as a function of temperature: (a) 1.9Li/MgODep, (b) 3.6Li/MgODep–Sub, (c) 3.8Li/MgODep and (d) 7.4Li/MgODep. | ||
As we can see from the graph (Fig. S4, ESI†), at lower temperatures (600 °C), ethane selectivity is higher than ethylene, and with increasing temperature, ethane selectivity decreases and ethylene selectivity increases. This is most probably because at higher temperatures, dehydrogenation of ethane occurs simultaneously on the catalyst surface.
4.2. Stability of the 3.6Li/MgODep–Sub catalyst on TOS
Time-on-stream study of the prepared catalysts at 700 °C is shown in Fig. 11, and it was found that the 3.6Li/MgODep–Sub catalyst is stable even after 24 h reaction time; on the other hand 1.9Li/MgODep catalyst deactivates continuously with time-on-stream. We believe that during high-temperature reactions, loosely bound Li species in the deposition-method catalysts were lost, resulting in a decrease in catalytic activity of the 1.9Li/MgODep catalyst; additionally, the stabilised Li active sites in the 3.6Li/MgODep–Sub catalyst due to its high temperature heat treatment prior to catalytic activity are responsible for its stability and high activity.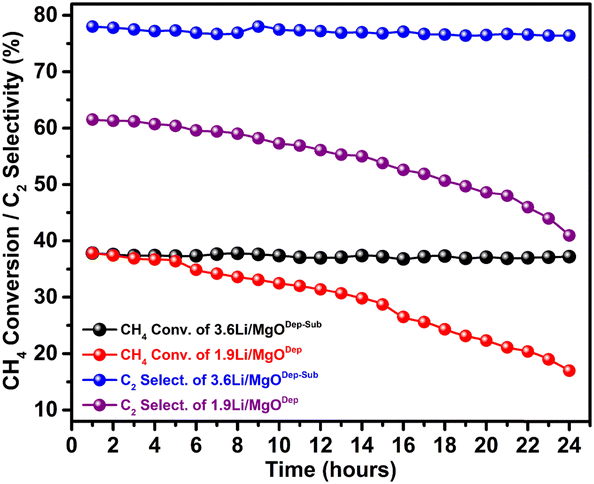 | ||
| Fig. 11 Effect of TOS (Time on stream) on CH4 conversion and C2 selectivity for the 3.6Li/MgODep–Sub and 1.9Li/MgODep catalysts. | ||
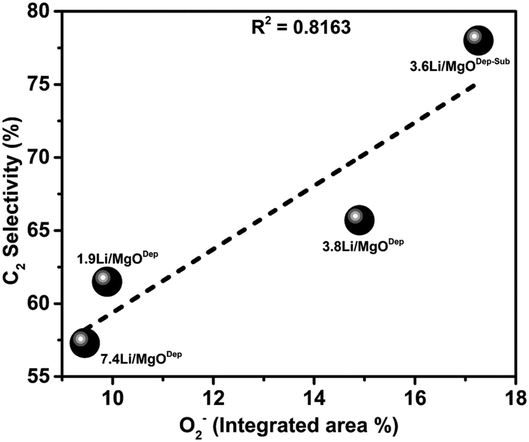
It was observed that the superoxide (O2−) species on the catalyst surface (analysed by XPS analysis) has a linear relationship with the selectivity of C2 hydrocarbons in the OCM reaction. From Fig. 12 it is evident that the catalyst with more O2− species has higher selectivity for C2 hydrocarbons.
4.3. Density functional theory (DFT) study
The DFT optimized geometry of the MgO(100) surface is shown in Fig. 13(a). The Li2–MgO(100) catalyst surface was obtained by replacing two Mg (+2) with two Li (+1) and removing one oxygen (−2) in order to balance the total charge, shown in Fig. 13(b).66 The position of the oxygen vacancy is also shown in Fig. 13(b) with the red designated circle.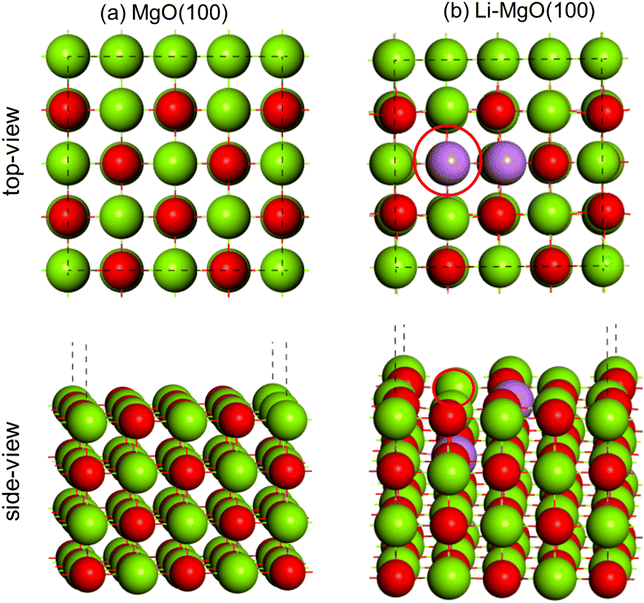 | ||
| Fig. 13 DFT optimized geometry of (a) MgO(100) and (b) Li2–MgO(100) surfaces. Color code: Mg (green), O (red) and Li (purple). | ||
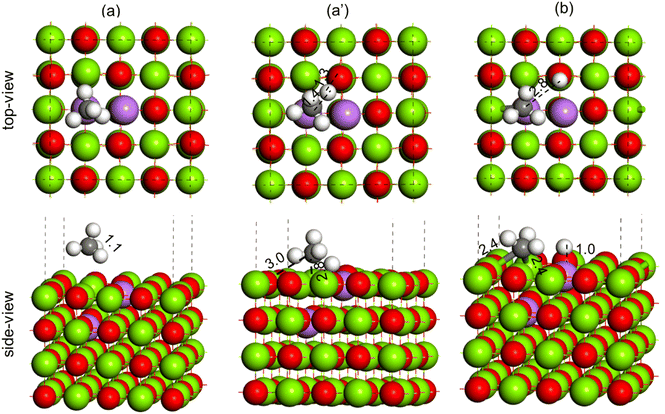
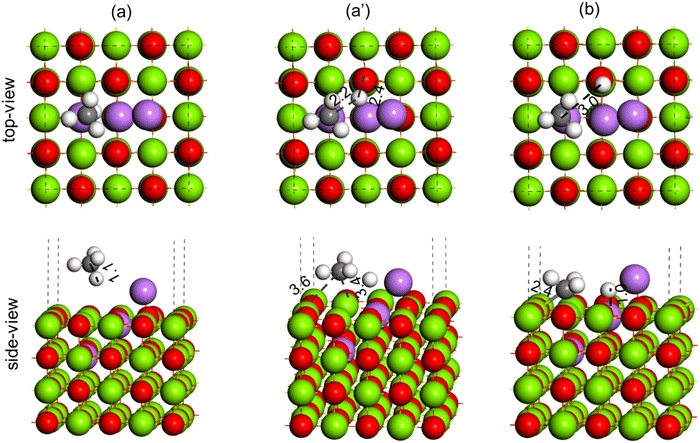
The activation of the methane first C–H bond is known to be the rate limiting step in oxidative methane coupling reaction. To understand the effect of Li doping in the OCM reaction as observed in experiments, the activation of CH4 molecules was studied over the MgO(100) and doped Li2–MgO(100) surfaces, as shown in Fig. 14 and 15, respectively. As shown in Fig. 14(a), the CH4 molecule adsorb physically over the MgO(100) surface. The TS for C–H activation at the MgO(100) surface has been shown in Fig. 14(a′), where the C–H bond elongated from 1.1 Å in the reactant state (Fig. 14(a)) to 3.7 Å in the TS (Fig. 14(a′)). The Mg–C and O–H bond distances at the TS (Fig. 14(a′)) were measured to be 3.3 Å and 2.2 Å, respectively. The activation barrier for methane C–H bond activation over the MgO(100) surface was calculated to be 114.1 kcal mol−1 (Table 3). In the product state, the C–H bond of CH4 is completely dissociated to CH3 + H, as O–H bonds (1.0 Å) and Mg–C (2.2 Å) bonds were formed, as can be seen in Fig. 14(b). Based on our calculation, the CH4 dissociation to CH3 + H has an endothermic reaction energy of 55.5 kcal mol−1 (Table 3).
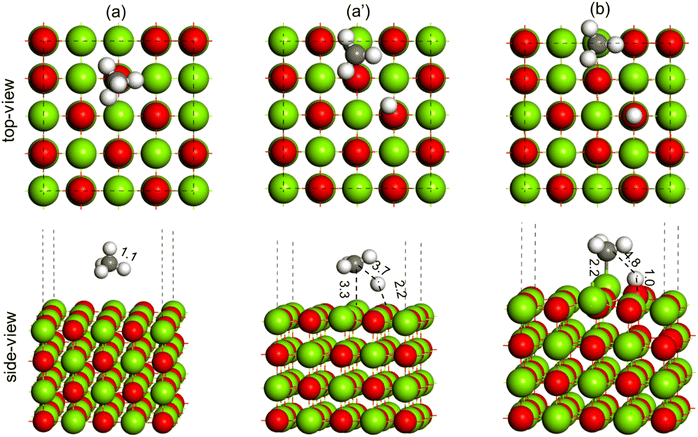 | ||
| Fig. 14 Methane C–H bond activation over the MgO(100) surface, (a) reactant (CH4), (a′) TS (CH3–H) and (b) product (CH3 + H). Color code: Mg (green), O (red), C (black) and H (white). | ||
| Catalytic system | Activation barrier (kcal mol−1) | Reaction energy (kcal mol−1) |
|---|---|---|
| MgO(100) | 114.1 | 55.5 |
| Li2–MgO(100) | 29.0 | 7.6 |
| Li3–MgO(100) | 64.3 | 15.3 |
| Li4–MgO(100) | 86.9 | 25.9 |
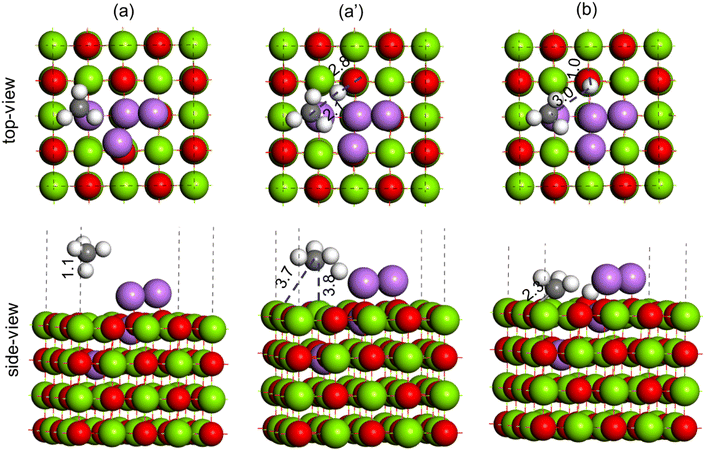
To understand the promotional effect of Li doping to MgO in the OCM reaction, the CH4 dissociation to CH3 + H was performed over the Li2–MgO(100) surface, as shown in Fig. 15. The CH4 molecule physically adsorbs at the Li2–MgO(100) surface, as shown in Fig. 15(a), where the C–H bond length was calculated to be 1.1 Å, similar to the undoped MgO(100) surface. In the TS, the C–H bond was elongated to 1.4 Å, whereas the O–H bond length was calculated to be 1.3 Å (Fig. 15(a′)), much smaller compared to the undoped MgO(100) surface (3.7 Å and 3.3 Å, respectively), indicating higher stabilization of the TS in the Li2–MgO(100) surface. The activation barrier for the CH4 C–H activation over the Li2–MgO(100) surfaces was calculated to be 29.0 kcal mol−1 (Table 3), nearly 85 kcal mol−1 lower compared to the undoped MgO(100) surface. The reaction energy for CH4 dissociation to CH3 + H at the Li2–MgO(100) surface was also calculated to be less endothermic by 7.6 kcal mol−1 (Table 3), nearly 50 kcal mol−1 lower than that of the MgO(100) surface. The lower C–H activation barrier and low endothermic reaction energy indicate the higher OCM activity of the Li2–MgO(100) catalyst surface compared to the undoped MgO(100) surface as seen in the experiments in Fig. 9.
To understand the effect of Li-loading on the OCM reaction, Li–MgO(100) surfaces with three Li atoms (Li3–MgO(100)) and four Li atoms (Li4–MgO(100)) were modelled to represent the MgO catalyst with high Li loading. Two different configurations were studied for the Li3–MgO(100) surface, as shown in Fig. S8 (ESI†), where Li added close to the oxygen vacancy site (Fig. S8(a), ESI†) was found to be more stable by ∼50 kJ mol−1, than where Li was added away from the oxygen vacancy site (Fig. S8(b), ESI†). Following same principle in the Li4–MgO(100) surface the fourth Li atom was also kept near the oxygen vacancy site. Methane C–H activation was studied over Li3–MgO(100) and Li4–MgO(100) surfaces, as shown in Fig. 16 and 17, respectively.
During the C–H bond activation over the Li3–MgO(100) surface, the C–H bond in methane (1.1 Å, Fig. 16(a)) was elongated to 2.2 Å in the TS (Fig. 16(a)), and the O–H bond length was calculated to be 2.4 Å (Fig. 16(a′)), which are much higher compared to the Li2–MgO(100) surface (1.4 Å and 1.3 Å, respectively), indicating destabilization of the TS in the Li3–MgO(100) surface due to the additional Li atom. The activation barrier for C–H activation over the Li3–MgO(100) surfaces was also calculated to be much higher (64.3 kcal mol−1) compared to the Li2–MgO(100) surface (29.0 kcal mol−1), as given in Table 3. The reaction energy for CH4 dissociation to CH3 + H at the Li3–MgO(100) surface was also calculated to be less endothermic by 15.3 kcal mol−1 (Table 3), nearly 8 kcal mol−1 higher than the Li2–MgO(100) surface. Methane C–H activation over the Li3–MgO(100) surface, shown in Fig. 17, shows similar trends. The activation barrier for the CH4 C–H activation over the Li4–MgO(100) surfaces was also calculated to be even higher (86.9 kcal mol−1, Table 3), due to higher deactivation of the TS due to the presence of two extra Li atoms (Fig. 17).
The amount of Li doping was found to be an important factor in determining the OCM activity of the Li/MgO catalyst system, where the methane C–H bond activation barrier was found to decrease on Li doping on the MgO(100) surface; however, higher Li addition lead to an increase in methane activation barrier, which can cause a decrease in the overall OCM activity, as also observed in the experimental findings. The methane C–H bond activation barrier was found to follow the trend: Li2–MgO(100) < Li3–MgO(100) < Li4–MgO(100) < MgO(100). A BEP relationship was also observed for the MgO(100) and Li-doped MgO(100) surfaces, where the activation barrier and the reaction energies of the methane C–H bond dissociation reaction were found to follow a linear relationship, as shown in Fig. 18.
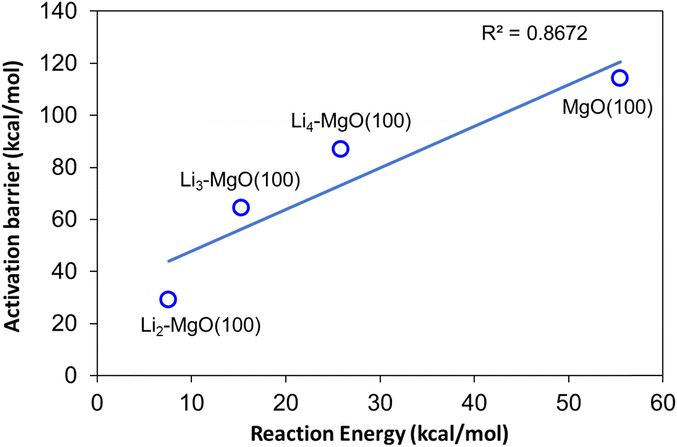 | ||
| Fig. 18 BEP relationship between the activation barriers and reaction energies for methane C–H bond activation over the MgO(100) and Li-doped MgO(100) surfaces. | ||
5. Conclusions
Li/MgO catalysts synthesized by a successive deposition–sublimation method showed high activity and stability during the oxidative conversion of methane to olefins. The XRD analysis of the Li–MgO catalyst showed Mg2+ displacement by Li+ in its crystal lattice and the formation of superoxide species (O2−) and lattice oxygen species (O2−) that trigger the methane activation. The substitution of Li+ by Mg2+ in the crystal lattice of MgO, resulting in the formation of active O negative sites, and the formation of a larger number of these defect sites played a significant role in the methane activation. Higher methane conversion was attributed to surface Li species, but higher C2 selectivity was attributed to Li–MgO defect sites and negatively charged oxygen species. It is found that the amount of Li in the Li/MgO catalyst affects the catalytic activity during the methane oxidative coupling reaction. According to our results, the conversion and selectivity of methane to C2H4 and C2H6 increased as the Li loading increased, reached its highest value at 3.8%, and then decreased further with an increased Li loading. Active site Li+O− dispersion, which results from replacing Mg2+ with Li+ in the magnesium oxide lattice, depends on the amount of Li loaded. On the highly dispersed active sites Li+O−, methane activation is controlled thermodynamically, favouring the production of ethane and ethylene, whereas the kinetic factor dominates when the poorly dispersed Li+O− active sites dominate the reaction, resulting in low selectivity for ethane and ethylene and high selectivity for other by-products such as COX. The activation barrier for the C–H activation of CH4 over the Li2–MgO(100) surfaces was calculated to be 29.0 kcal mol−1, which is nearly 85 kcal mol−1 lower compared to the undoped MgO(100) surface (114.1 kcal mol−1). However, as the Li doping was increased, the activation barrier for CH4 dissociation was increased by 35 kcal mol−1 and 57 kcal mol−1 for Li3–MgO(100) and Li4–MgO(100), respectively. The lower activation barrier and lower endothermicity of the methane C–H activation obtained from DFT indicate the higher OCM activity of the Li–MgO(100) catalyst compared to the undoped MgO(100) surface, as also seen in the experimental catalytic activity studies. The best C2 yield was obtained over our 3.6Li/MgODep–Sub catalyst. Although the C2 selectivity was sufficient above the 3.8% Li-loaded catalyst (7.4Li/MgODep) due to increasing defect sites, methane conversion was reduced due to a decrease in the active surface area of the catalyst.Author contributions
Rohan Singh Pal – design and performing experiments of the research work, manuscript writing; Swati Rana, Souvik Sadhu, Mukesh Kumar Poddar contributed to catalyst characterization; Tuhin Suvra Khan – design and performing DFT studies, manuscript writing and correction; Rajib Kumar Singha contributed to catalyst characterization and manuscript writing; Suman Sarkar – STEM and EELS analysis; Rahul Sharma – funding collaborator; Rajaram Bal – conceptualization and design of the whole study, design of experiments of the research work, manuscript correction.Conflicts of interest
The authors declare no conflicts of interest.Acknowledgements
R. S. P. thanks UGC, New Delhi, India for the fellowship. R. B. and the authors thank GAIL (India) Ltd. for the funding in the form of a collaborative project. The Director, CSIR-IIP, is acknowledged for his help and encouragement. The authors thank the Analytical Science Division, Indian Institute of Petroleum for analytical services.References
- Y. Chen, X. Mu, X. Luo, K. Shi, G. Yang and T. Wu, Energy Technol., 2020, 8, 1900750 CrossRef CAS.
- X. Guo, G. Fang, G. Li, H. Ma, H. Fan, L. Yu, C. Ma, X. Wu, D. Deng and M. Wei, Science, 2014, 344, 616–619 CrossRef CAS PubMed.
- J. T. Grant, J. M. Venegas, W. P. McDermott and I. Hermans, Chem. Rev., 2018, 118, 2769–2815 CrossRef CAS PubMed.
- I. Kim, G. Lee, H. B. Na, J.-M. Ha and J. C. Jung, Mol. Catal., 2017, 435, 13–23 CrossRef CAS.
- J. T. Grant, J. M. Venegas, W. P. McDermott and I. Hermans, Chem. Rev., 2017, 118, 2769–2815 CrossRef PubMed.
- V. Lomonosov and M. Y. Sinev, Kinet. Catal., 2016, 57, 647–676 CrossRef CAS.
- G. Keller and M. Bhasin, J. Catal., 1982, 73, 9–19 CrossRef CAS.
- U. Zavyalova, M. Holena, R. Schlögl and M. Baerns, ChemCatChem, 2011, 3, 1935–1947 CrossRef CAS.
- C. Hammond, S. Conrad and I. Hermans, ChemSusChem, 2012, 5, 1668–1686 CrossRef CAS PubMed.
- P. Schwach, X. Pan and X. Bao, Chem. Rev., 2017, 117, 8497–8520 CrossRef CAS PubMed.
- H. Schwarz, Angew. Chem., Int. Ed., 2011, 50, 10096–10115 CrossRef CAS PubMed.
- P. Wang, G. Zhao, Y. Wang and Y. Lu, Sci. Adv., 2017, 3, e1603180 CrossRef PubMed.
- A. Galadima and O. Muraza, J. Ind. Eng. Chem., 2016, 37, 1–13 CrossRef CAS.
- C. Karakaya, H. Zhu, C. Loebick, J. G. Weissman and R. J. Kee, Catal. Today, 2018, 312, 10–22 CrossRef CAS.
- V. V. Thyssen, V. B. Vilela, D. Z. de Florio, A. S. Ferlauto and F. C. Fonseca, Chem. Rev., 2022, 122, 3966–3995 CrossRef CAS PubMed.
- J. Xu, L. Peng, X. Fang, Z. Fu, W. Liu, X. Xu, H. Peng, R. Zheng and X. Wang, Appl. Catal., A, 2018, 552, 117–128 CrossRef CAS.
- Y. Zhang, J. Xu, X. Xu, R. Xi, Y. Liu, X. Fang and X. Wang, Catal. Today, 2020, 355, 518–528 CrossRef CAS.
- J. Xu, Y. Zhang, Y. Liu, X. Fang, X. Xu, W. Liu, R. Zheng and X. Wang, Eur. J. Inorg. Chem., 2019, 183–194 CrossRef.
- D. Kiani, S. Sourav, J. Baltrusaitis and I. E. Wachs, ACS Catal., 2019, 9, 5912–5928 CrossRef CAS.
- S. Lim, J.-W. Choi, D. J. Suh, U. Lee, K. H. Song and J.-M. Ha, Catal. Today, 2020, 352, 127–133 CrossRef.
- T. W. Elkins, S. J. Roberts and H. E. Hagelin-Weaver, Appl. Catal., A, 2016, 528, 175–190 CrossRef CAS.
- S. Arndt, G. Laugel, S. Levchenko, R. Horn, M. Baerns, M. Scheffler, R. Schlögl and R. Schomäcker, Catal. Rev., 2011, 53, 424–514 CrossRef CAS.
- Istadi and N. A. S. Amin, J. Mol. Catal. A: Chem., 2006, 259, 61–66 CrossRef CAS.
- L. Luo, R. You, Y. Liu, J. Yang, Y. Zhu, W. Wen, Y. Pan, F. Qi and W. Huang, ACS Catal., 2019, 9, 2514–2520 CrossRef CAS.
- Z. Zhang and S. F. Ji, Adv. Mater. Res., 2014, 648–652 Search PubMed.
- S. Arndt, U. Simon, S. Heitz, A. Berthold, B. Beck, O. Görke, J.-D. Epping, T. Otremba, Y. Aksu and E. Irran, Top. Catal., 2011, 54, 1266–1285 CrossRef CAS.
- P. Myrach, N. Nilius, S. V. Levchenko, A. Gonchar, T. Risse, K. P. Dinse, L. A. Boatner, W. Frandsen, R. Horn and H. J. Freund, ChemCatChem, 2010, 2, 854–862 CrossRef CAS.
- V. Alexiadis, J. Thybaut, P. Kechagiopoulos, M. Chaar, A. Van Veen, M. Muhler and G. Marin, Appl. Catal., B, 2014, 150, 496–505 CrossRef.
- U. Simon, S. Arndt, T. Otremba, T. Schlingmann, O. Görke, K.-P. Dinse, R. Schomäcker and H. Schubert, Catal. Commun., 2012, 18, 132–136 CrossRef CAS.
- N. A. S. Amin and S. E. Pheng, Chem. Eng. J., 2006, 116, 187–195 CrossRef CAS.
- K. Qian, R. You, Y. Guan, W. Wen, Y. Tian, Y. Pan and W. Huang, ACS Catal., 2020, 10, 15142–15148 CrossRef CAS.
- L. Luo, X. Tang, W. Wang, Y. Wang, S. Sun, F. Qi and W. Huang, Sci. Rep., 2013, 3, 1–7 CrossRef.
- L. Luo, Y. Jin, H. Pan, X. Zheng, L. Wu, R. You and W. Huang, J. Catal., 2017, 346, 57–61 CrossRef CAS.
- R. You and W. Huang, ChemCatChem, 2020, 12, 675–688 CrossRef CAS.
- K. Kwapien, J. Paier, J. Sauer, M. Geske, U. Zavyalova, R. Horn, P. Schwach, A. Trunschke and R. Schlögl, Angew. Chem., Int. Ed., 2014, 53, 8774–8778 CrossRef CAS PubMed.
- K. Sweeney, L. Halliburton, D. Bryan, R. Rice, R. Gerson and H. Tomaschke, J. Appl. Phys., 1985, 57, 1036–1044 CrossRef CAS.
- U. Zavyalova, M. Geske, R. Horn, G. Weinberg, W. Frandsen, M. Schuster and R. Schlögl, ChemCatChem, 2011, 3, 949–959 CrossRef CAS.
- L. Leveles, K. Seshan, J. A. Lercher and L. Lefferts, J. Catal., 2003, 218, 307–314 CrossRef CAS.
- Y.-m Wu, S. Li and C.-y Li, J. Fuel Chem. Technol., 2016, 44, 1334–1340 CrossRef CAS.
- P. Bera, K. R. Priolkar, P. R. Sarode, M. S. Hegde, S. Emura, R. Kumashiro and N. P. Lalla, Chem. Mater., 2002, 14, 3591–3601 CrossRef CAS.
- S. Adak, R. S. Pal, T. S. Khan, M. K. Poddar, M. S. Ahmad, V. V. D. N. Prasad, M. A. Haider and R. Bal, ChemistrySelect, 2021, 6, 13051–13059 CrossRef CAS.
- M. Rouchdi, E. Salmani, B. Fares, N. Hassanain and A. Mzerd, Results Phys., 2017, 7, 620–627 CrossRef.
- R. Yousefi, A. K. Zak and F. Jamali-Sheini, Mater. Sci. Semicond. Process., 2013, 16, 771–777 CrossRef CAS.
- S. K. Sharma, B. Paul, P. Bhanja, M. K. Poddar, C. Samanta, T. S. Khan, M. A. Haider and R. Bal, ChemCatChem, 2021, 13, 3290–3302 CrossRef CAS.
- H. Wang, M. Wang, S. Liu, N. Zhao, W. Wei and Y. Sun, J. Mol. Catal. A: Chem., 2006, 258, 308–312 CrossRef CAS.
- S. Xia, X. Guo, D. Mao, Z. Shi, G. Wu and G. Lu, RSC Adv., 2014, 4, 51688–51695 RSC.
- S. Jain, J. Shah, N. S. Negi, C. Sharma and R. K. Kotnala, Int. J. Energy Res., 2019, 43, 4743–4755 CrossRef CAS.
- Y.-j Hao, B. Liu, L.-g Tian, F.-t Li, J. Ren, S.-j Liu, Y. Liu, J. Zhao and X.-j Wang, ACS Appl. Mater. Interfaces, 2017, 9, 12687–12693 CrossRef CAS PubMed.
- A. J. Naylor, E. Makkos, J. Maibach, N. Guerrini, A. Sobkowiak, E. Björklund, J. G. Lozano, A. S. Menon, R. Younesi and M. R. Roberts, J. Mater. Chem. A, 2019, 7, 25355–25368 RSC.
- L. Chen, C. Xu, X.-F. Zhang and T. Zhou, Phys. E, 2009, 41, 852–855 CrossRef CAS.
- J. H. Park, Metall. Mater. Trans. B, 2013, 44, 938–947 CrossRef CAS.
- K. Ishikawa, N. Fujima and H. Komura, J. Appl. Phys., 1985, 57, 973–975 CrossRef CAS.
- H. Böckelmann and R. Schlecht, Phys. Rev. B: Solid State, 1974, 10, 5225 CrossRef.
- A. Weibel, D. Mesguich, G. Chevallier, E. Flahaut and C. Laurent, Carbon, 2018, 136, 270–279 CrossRef CAS.
- B. C. Liu, B. Yu and M. X. Zhang, Chem. Phys. Lett., 2005, 407, 232–235 CrossRef CAS.
- J. H. Lunsford, X. Yang, K. Haller, J. Laane, G. Mestl and H. Knoezinger, J. Phys. Chem., 1993, 97, 13810–13813 CrossRef CAS.
- G. Karamullaoglu, S. Onen and T. Dogu, Chem. Eng. Process., 2002, 41, 337–347 CrossRef CAS.
- R. Martins, C. Veloso and M. Schmal.
- S. C. Bhumkar and L. L. Lobban, Ind. Eng. Chem. Res., 1992, 31, 1856–1864 CrossRef CAS.
- J. X. Wang and J. H. Lunsford, J. Phys. Chem., 1986, 90, 3890–3891 CrossRef CAS.
- L. Wang, X. Yi, W. Weng, C. Zhang, X. Xu and H. Wan, Catal. Lett., 2007, 118, 238–243 CrossRef CAS.
- J. Lunsford, Catal. Rev., 1974, 8, 135–157 CrossRef.
- S. Bhandari, R. Khatun, M. K. Poddar, A. C. Kothari and R. Bal, Mol. Catal., 2022, 528, 112473 CrossRef CAS.
- J. Lunsford, Catalysis, 1987, 227–256 Search PubMed.
- V. R. Choudhary, V. H. Rane and R. V. Gadre, J. Catal., 1994, 145, 300–311 CrossRef CAS.
- C. Trionfetti, I. V. Babich, K. Seshan and L. Lefferts, Langmuir, 2008, 24, 8220–8228 CrossRef CAS PubMed.
Footnote |
| † Electronic supplementary information (ESI) available. See DOI: https://doi.org/10.1039/d2ya00096b |
| This journal is © The Royal Society of Chemistry 2023 |

