 Open Access Article
Creative Commons Attribution 3.0 Unported Licence
Rapid sintering of Li6.5La3Zr1Nb0.5Ce0.25Ti0.25O12 for high density lithium garnet electrolytes with current induced in situ interfacial resistance reduction†‡
M. P.
Stockham
 *a,
B.
Dong
 ac,
M. S.
James
a,
P.
Zhu
 bc,
E.
Kendrick
 bc and
P. R.
Slater
 *ac
*ac
aSchool of Chemistry, University of Birmingham, Birmingham B15 2TT, UK. E-mail: mps1r22@soton.ac.uk; P.r.slater@bham.ac.uk
bSchool of Metallurgy and Materials, University of Birmingham, Birmingham B15 2TT, UK
cThe Faraday Institution, Quad One, Harwell Campus, Didcot OX11 0RA, UK
First published on 17th August 2023
Abstract
A primary target of energy storage is the all solid state battery, however finding a suitable solid state electrolyte has proven troublesome. Lithium garnet materials are promising solid state electrolytes with high room temperature conductivity, a wide electrochemical window, high chemical stability with Li metal and have minimal hazards. However, lithium garnets suffer from slow, energy demanding synthesis, rapid proton exchange (leading to high interfacial resistance between the garnet and electrodes), mechanical instabilities with Li metal and require specific handling methods to achieve the highest performing materials (such as full processing under Ar). Here we report a Ti/Ce co-doped high entropy lithium garnet material with four B site dopants, with the formula Li6.5La3Zr1Nb0.5Ce0.25Ti0.25O12. This material benefits from rapid simultaneous sintering and densification directly from the starting materials, allowing formation of dense pellets in <1 hour at 1100 °C using only a standard, cheap, muffle furnace. Li6.5La3Zr1Nb0.5Ce0.25Ti0.25O12 also has high conductivity (0.5 mS cm−1 at 25 °C), scalability and insensitivity to both rapid furnace ramp rates and long dwell times. There is also an indication of unusual behaviour towards limiting lithium dendrite propagation, which is also discussed.
Introduction
Safe, long-lasting portable energy storage is an elusive goal. Lithium-ion batteries (LIB) are the device of choice for use in secondary, rechargeable, batteries, owing to their high energy density, low self-discharge, long life (compared to other options) and extended cycling stability.1,2 Yet LIBs remain far from reaching their theoretical potential and pose serious safety concerns, while a rechargeable lithium metal battery with high cyclability remains elusive. LIB safety problems generally arise from the liquid based electrolytes, such as LiPF6 in ethylene carbonate and dimethyl carbonate. These electrolytes are flammable, toxic, have limited electrochemical windows and are unstable with Li metal.1,3–21 These electrolytes, therefore, require optimisation or replacement for the next leap in energy storage.Solid state batteries (SSB) are thought to overcome most limitations in current LIBs.5,22–26 However, current SSBs remain confined mostly to small scale laboratory work, as finding a suitable solid state electrolyte (SSE) has proved troublesome. The issues primarily relate to either poor ionic mobility or limited electrochemical windows, however are further complicated by long/complex synthesis and poor interfacial contact to the electrodes. This poor interfacial contact leads to a resistance too high for battery operation, abrupt potential changes, and increasingly poorer contact due to volume changes during cell operation.27–35 Therefore, full SSBs have yet to be deployed on a large scale, with the exception of micro-batteries, such as those based upon lithium phosphorus oxynitride, which have been commercially available for some time.36
Of the available SSEs, lithium garnet type materials have received significant attention, owing to their well-established wide electrochemical window and (after considerable work) ionic conductivity rivalling that of current liquid electrolytes at room temperature (0.1–1 mS cm−1).37–41 These materials are also chemically stable with Li metal, but they are susceptible to Li dendrite propagation through grain boundaries, although this can be substantially improved with increased SSE density, high stack pressures and low interfacial resistance.42–48 Lithium garnets, however, often require time consuming synthesis, followed by densification processes, which can take several days. The best performing garnets in the literature also need handling solely within an Ar atmosphere to fully prevent proton exchange, which arises from thermodynamic instabilities in air (associated with the high Li content).37,49 Therefore, synthesis often lacks scalability and is usually confined to the <4 g level.
Ideal garnets have the general formula A3B2X3O12 (e.g. A = Fe, Mg, B = Al, Cr, Fe, and X = Si, Fe, Al, Ga).50–53 In Li3 garnets, e.g. Li3La3Te2O12, lithium fully occupies the 24d tetrahedral site and shows minimal Li ion mobility.52,54 System modifications by addition of lower valent cations permit increased Li content to maintain charge neutrality. This gives increased conductivity with lithium occupying additional interstitial octahedral sites in a disordered fashion.51,53,55,56 Li garnets can accommodate 7 Li per formula unit (pfu), but this results in full Li site occupation and Li ordering (to reduce short Li–Li distances). This gives an elongation of an axis in the cubic cell forming the thermodynamically stable tetragonal system.57–61 Tetragonal garnets have 7 Li pfu and poor conductivity with the I41/acd space group (no. 142)57–60 whereas cubic garnets have <7 Li pfu and show high conductivity commonly with Ia![[3 with combining macron]](https://www.rsc.org/images/entities/char_0033_0304.gif) d (no. 230) symmetry, although I
d (no. 230) symmetry, although I![[4 with combining macron]](https://www.rsc.org/images/entities/char_0034_0304.gif) 3d (no. 220) has been proposed for GaxLi7−3xLa3Zr2O12 (Ga-LLZO).53,62,63 Li6.95La3Zr1.95Nb0.05O12 has also been reported with orthorhombic symmetry, space group Ibca.64 Irrespectively, most lithium garnet reports detail cubic systems where Li content is between ∼6.2–6.6 pfu as this maximises the Li content (and subsequent disorder) while maintaining some vacant interstitial sites for an effective migration pathway.37,45,51,55–57,65–80
3d (no. 220) has been proposed for GaxLi7−3xLa3Zr2O12 (Ga-LLZO).53,62,63 Li6.95La3Zr1.95Nb0.05O12 has also been reported with orthorhombic symmetry, space group Ibca.64 Irrespectively, most lithium garnet reports detail cubic systems where Li content is between ∼6.2–6.6 pfu as this maximises the Li content (and subsequent disorder) while maintaining some vacant interstitial sites for an effective migration pathway.37,45,51,55–57,65–80
Much work has focused on single dopant strategies, such as Al/Ga-LLZO, however only a small number of reports focus upon higher entropy lithium garnets, where multiple cations have been substituted onto a single site (where a high entropy metal oxide is, generally, considered to be a single-phase material with ≥5 elements pfu). Such increased entropic factors could be harmonious with the highly entropic cubic, high Li content garnet systems. This would promote increased disorder which may yield better conductivity, rapid synthesis, or better cell performance, some of which have been shown in recent reports.81–83
Prior work has shown that Ce doping in LLZO enables lower interfacial resistance between the Li metal and the garnet (388 Ω cm2), likely due to partial Ce4+ reduction.61 We also recently reported on some high entropy garnet systems, and the ease at which they can form. We suggested that, with Ga0.2Li5.75La2.5Nd0.5Nb0.35Ta0.3Ce0.1Zr0.75Hf0.25Ti0.25O12, the use of the Ti dopant should be examined further due to prior literature reports of dendrite resistance, high relative density pellets (95%), good ionic conductivity (0.2 mS cm−1 at room temperature) and favourable interfacial wetting between the Li metal and Ti doped garnets.81,84–86 Therefore, the aim of this work was to build upon prior studies and combine the low interfacial resistance afforded by Ce4+ and the favourable performance properties reported for Ti4+ doping into a new dual doped high entropy garnet system, with aims to improve sintering, densification and conductivity.
Herein, an easy to synthesise Li garnet is presented, with the formula Li6.5La3Zr1Nb0.5Ce0.25Ti0.25O12 (LTC). LTC was designed to take advantage of a high entropy type approach via a multi-element doping strategy on the B site (rather than a single dopant for cubic phase stabilisation, such as Nb in a tetragonal LLZO type system). LTC enables a fast synthesis route to a high conductivity garnet, requiring only 15–60 minutes to form dense pellets, directly from the starting materials, and uses only conventional muffle furnaces placed in a dry room. LTC is insensitive to heating rates, forming similar performing SSE membranes when heated at 2 °C min−1 or at 40 °C min−1 (furnace limit). Furthermore, the high ionic conduction in LTC (1.1 mS cm−1 at 45 °C, 88% density) does not noticeably degrade if heated for >1 h. Mostly pure LTC can form in as little as 5 min at 1100 °C, whereas powder synthesis can be accomplished at 950 °C/1 h in air. The rapid simultaneous synthesis and densification results are not mirrored when preparing garnets using Ce or Ti as a single dopant, nor in reports detailing the single dopants elsewhere.86–88 LTC shows excellent cycling stability, and a wide electrochemical window.
LTC was also designed to avoid Li site substituted dopants (such as Al/Ga), which exsolve to the grain boundary during heating and are unstable in contact with Li metal. These have been reported prior to undergo reversible short circuits during cell cycling, whereupon soft short circuits are removed by cell resting. This causes the garnet cations to be reduced via Li metal, which oxidises Li and removes the dendrite/s, with this attributed to the non-negligible electronic conductivity of lithium garnet materials.89 This problem, however, could be tailored towards more rapid removal of lithium metal short circuits via dopant strategies. This could assist in dendrite removal before cell failure, and could be especially helpful if used as an interlayer in an all solid state cell. The reversible short circuit behaviour and in-situ changes to area specific resistance in LTC were, therefore, assessed in this work by time resolved impedance spectroscopy and X-ray absorption near edge structure.
Methods
Synthesis
Li6.5La3Zr1 Nb0.5Ce0.25Ti0.25O12 (LTC) was prepared via the solid-state route from stochiometric quantities of Li2CO3 (≥99%, Sigma), La2O3 (99.9%, Sigma), Nb2O5 (99.9%, Alfa Aesar), ZrO2 (>99% Alfa Aesar), TiO2 (99.6%, Alfa Aesar) and CeO2 (99.9%, Acros Organics) in air. A 40% mol excess of lithium was added to compensate for lithium loss during high temperature sintering. All powders were ball milled for 1 hour with ZrO2 balls (350 rpm) with hexane. The powders were heated to 950 °C (powder) or pelletised and heated 1100 °C (1 h) at the fastest possible ramp rate in air (100 °C min−1) and within a dry room (40 °C min−1) in Carbolite ELF11/6 or CWF13/3 furnaces respectively. 10 mm pellets were pressed to 0.5–1 ton for ∼1 min from the starting materials. The dry room had a dewpoint between −45 °C to −64 °C (the elimination of humidity is desirable to prepare good quality garnet samples, as it is well established moisture can be an issue in the synthesis of Li garnet systems).90–92 Singularly Ce, Ti doped Li6.5La3Zr1.25Nb0.5Ce0.25O12 and Li6.5La3Zr1.25Nb0.5Ti0.25O12 were synthesised in the same manner but required two and four hours respectively to obtain similarly dense pellets.All samples were stored in an argon glove box to prevent proton-Li exchange.71,93–96 Scanning electron microscopy (SEM) was performed on a Philips XL30 FEG instrument, with the elemental distribution confirmed by the corresponding Oxford Inca 300 energy dispersive X-ray (EDX) attachment. Pellets were polished with silicon carbide sandpaper from 800 to 4000 grit to form a flat surface. Additional SEM/EDX was performed on unpolished pellets and powder (available in the ESI‡) using a benchtop Hitachi TM4000plus instrument. Here, elemental analysis was undertaken via an AZtecOne X-stream2 energy dispersive X-ray spectrometer. SEM/EDX pellets or powders were secured to the SEM stub by carbon tape. Phase analysis was performed by X-ray diffraction (XRD) using a Bruker D8 diffractometer with a Cu X-ray source. Experimental pellet densities were determined and compared to theoretical values from Rietveld refinement results (performed using GSAS II software).97 3D visualisations of the crystal structure used Vesta.98 X-ray absorption near edge spectroscopy (XANES) data were recorded at Diamond Light Source on beamline B18. XANES data were interpreted via the Athena/Artemis software.142
Impedance spectroscopy
Post-sintering, the pellets were polished and were sputtered with Au using an Agar Automatic Sputter coater with a 40 mA current for 60 seconds, (or until a clearly visible gold coating was present). The pellets were protected from short circuit by adhesive tape. The sputtered pellets were then secured in an MTI split cell for room temperature impedance spectroscopy measurements, which were performed using a Solartron 1260 impedance analyser from 1 Hz to 10 MHz with a 20 mV potential. Variable temperature measurements were undertaken in a Genlab Classic oven from 19–64 °C, with at least 30 minute rest periods once obtaining the set temperature. Temperature accuracy was confirmed via a Fluke 51 II external thermocouple.Cell assembly
All cell tests were performed on a biologic VMP3 or SP50 instrument. Li|LTC|Li symmetric cells (>9 cells) were assembled in an Ar glove box. Firstly, the pellets (∼1 mm thickness) were polished using silicon carbide sandpaper from 240 to 4000 grit, then lithium metal foil was applied to each side of the pellet. The cell was then heated to 175 °C under a constant pressure for 1 h using a commercially and readily available steel 3-way G clamp as reported prior99 and was secured under light pressure via hand tightening the clamp. The cell was subsequently secured within an MTI split test cell. Cells were examined via impedance spectroscopy before (and after) cell testing from 10 MHz to 0.1 Hz with a 20 mV potential on a Solartron 1260 impedance analyser. LTC Cells were analysed on an open lab bench (non-air conditioned) with small temperature fluctuations between 17–23 °C for the critical current density (CCD), in increments of 10 μA cm−2. Cells were also assembled in a similar manner for long term Li stripping and plating analysis at 49 °C, see Fig. S8, ESI.‡Au|LTC|Li cells, for cyclic voltammetry (C.V.), were formed by polishing an LTC pellet as above and hand pressing the pellet into Li foil in an Ar glovebox. The cell was placed in a MTI Split cell with Au foil as the working electrode. Cyclic voltammetry was subsequently run from −0.4 to 10 V at a scan rate of 1 mV s−1.
Results and discussion
X-Ray diffraction results
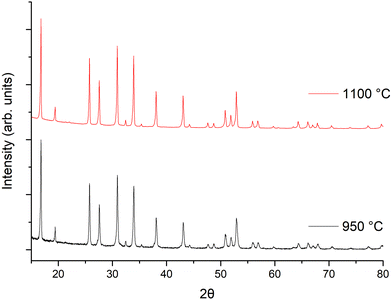
The powder X-ray diffraction (XRD) patterns of the LTC garnet materials sintered at 950 °C (powder) and 1100 °C (pellet) for 1 h are shown in Fig. 1. Both were indexed on the Ia![[3 with combining macron]](https://www.rsc.org/images/entities/char_0033_0304.gif) d space group as per other garnet materials without Ga (or Fe) Li site substitution.62,100 Rietveld refinements were based upon the structural model from Hamao et al.101 Considering the scattering similarities between Zr and Nb these were set to the intended ratios. As Zr and Nb occupancies could not be refined, Ce and Ti occupancies were also set to the intended ratio (which corresponded to the homogeneity seen within the EDX images gathered from the pellet surface, see later). Table 1 reports the calculated lattice parameters and an example refinement is shown in Fig. S1 (ESI‡). Lattice parameters were 12.9389(6) Å for the powder sintered at 950 °C and 12.9477(2) Å for the densified pellet at 1100 °C (88% relative density). This is in line with other garnets with similarly high Li content on the Ia
d space group as per other garnet materials without Ga (or Fe) Li site substitution.62,100 Rietveld refinements were based upon the structural model from Hamao et al.101 Considering the scattering similarities between Zr and Nb these were set to the intended ratios. As Zr and Nb occupancies could not be refined, Ce and Ti occupancies were also set to the intended ratio (which corresponded to the homogeneity seen within the EDX images gathered from the pellet surface, see later). Table 1 reports the calculated lattice parameters and an example refinement is shown in Fig. S1 (ESI‡). Lattice parameters were 12.9389(6) Å for the powder sintered at 950 °C and 12.9477(2) Å for the densified pellet at 1100 °C (88% relative density). This is in line with other garnets with similarly high Li content on the Ia![[3 with combining macron]](https://www.rsc.org/images/entities/char_0033_0304.gif) d type symmetry, and slightly larger than reported for the singly doped garnet Li6.5La3Zr1.5Ta0.5O12,101 which can be attributed to the presence of the larger Ce.
d type symmetry, and slightly larger than reported for the singly doped garnet Li6.5La3Zr1.5Ta0.5O12,101 which can be attributed to the presence of the larger Ce.
| LTC sample (min) | Lattice parameters (Å) | ρ rel (%) | σ (mS cm−1) | C bulk (F cm−1) (pF) | ε r |
|---|---|---|---|---|---|
| Powder | 12.9389(6) | — | — | — | — |
| 5 | 12.9404(7) | 80 | — | — | — |
| 15 | 12.9492(6) | 84 | 0.30 (26 °C) | 4.75 | 54 |
| 30 | 12.9490(4) | 86 | 0.39 (27 °C) | 5.57 | 63 |
| 45 | 12.9507(5) | 83 | 0.35 (24 °C) | 4.69 | 53 |
| 60 | 12.9477(2) | 88 | 0.42 (24 °C) | 5.64 | 64 |
| 180 | 12.9446(2) | 86 | 0.37 (22 °C) | 4.29 | 48 |
| 720 | 12.9539(1) | 87 | 0.38 (22 °C) | 4.87 | 55 |
| LT | 12.9138(9) | 86 | 0.33 (22 °C) | 4.77 | 54 |
| LC | 12.9760(14) | 84 | 0.31 (22 °C) | 5.91 | 66 |
Considering the rapid speed, additional investigations into the optimum sintering/densification time were undertaken. LTC pellets were prepared and heated to 1100 °C for 5, 15, 30, 45 and 60 minutes, see Fig. 2 and Table 1. It was determined that garnet phases form in as little as 5 min, with lattice parameters of 12.9404(7) Å being only slightly reduced compared to 1 h. However, those phases sintered for 5 min had broad peaks, and were not uniformly densified with only a dense inner core surrounded by loose powders. Such pellets had relative densities of 80% but were thin and brittle. Nonetheless, this is an impressive density value for only 5 minutes sintering.
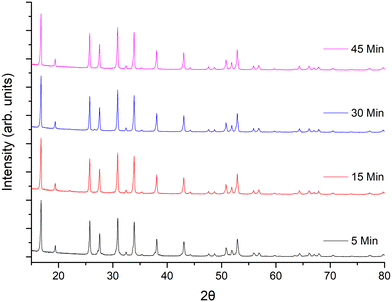 | ||
| Fig. 2 XRD patterns of LTC sintered pellet form at 1100 °C for different time intervals. All patterns demonstrate garnet type symmetry but sharp, crystalline, peaks only appear ≥15 minutes. | ||
Pellets which were heated for ≥15 minutes did not require removal of any excess powder and formed denser membranes. These samples showed sharp, highly crystalline, diffraction peaks and gave lattice parameters similar to sintering for 1 h. The peaks were mostly garnet related; however, some minor unknown impurities were present which could not be fully identified. These are attributed to partial sintering of the starting materials, with some peaks indexed to Li–Nb–O phases of varying stoichiometries. These impurity peaks remained until ≥45 min, after which pure garnet type symmetry was observed. Relative densities for pellets sintered for ≥15 minutes ranged from 83–88%, the maximum of which was obtained at 1 h. Sintering beyond 1 h gave little difference in density, therefore subsequent pellets were sintered for 1 h. Attempts were made to reduce the Li mol excess to 5, 10 or 20%, however pellet densification was much reduced by comparison and only a dense pellet core, encapsulated by less dense powders, was observed. This suggests that the Li excess is also acting as an additional sintering aid.
Therefore, maximal pellet densities for these samples using conventional muffle furnaces is ∼88% at 1100 °C (similar densities were also achieved under N2/O2 and no additional benefits were found when heating >1100 °C). This is in line with our previous work conducted under similar experimental procedures for other garnet systems,68–70,99,102 however these reports required sintering the powder for ∼12 h followed by densification for ∼12 h in either air or N2/O2 (even with comparable Li excess as reported here. Or the addition of other sintering aids, e.g. LiF) and were more sensitive to heating rates. This is also true of the majority of reports elsewhere.37,41,78,87,92,101,103–105 The sintering and densification behaviour of LTC, however, is considerably quicker and LTC has high ionic conductivity compared to similar reports (see later for impedance spectroscopy).68–70,81,99,102,106
It is not clear why LTC has such rapid densification and sintering. It could perhaps rely on the increased disorder of the B site, which is host to four separate elements. This could enable greater entropic contributions to the cubic lithium garnet and thus provide the additional contribution to drive more rapid synthesis. However, it appears that some form of reactive sintering is crucial, as powder synthesis followed by densification was significantly more troublesome (1200 °C for 4–6 hours) and gave marginally poorer room temperature ionic conductivity (∼0.1 mS cm−1). The rapid densification of LTC is reminiscent of liquid sintering, whereby the low melting point of a particular compound (Li2CO3 here, with a 40% excess) can enable formation of a dense ceramic, and this is supported by the poorer densification observed when using a lower Li excess. However, when Ti or Ce is used singularly with Li6.5La3Zr1.25Nb0.5M0.25O12 (M = Ti, Ce) (also with 40% Li excess) the synthesis was quick yet densification took several hours, see later. Therefore, although liquid sintering is a possibility to explain the rapid densification, its dependence on an Li2CO3 excess remains unclear.
LTC was also proven to be scalable to at least 15 g (the volume limit of the milling pot) under the same procedure. Increased Li content beyond 6.5 pfu was attempted, in the form of Li6.6La3Nb0.4Zr1Ti0.35Ce0.25O12 and Li6.7La3Nb0.3Zr1Ti0.45Ce0.25O12. However, this yielded impurities, such as CeO2, which were unable to be removed, see Fig. S2 (ESI‡).
SEM/EDX
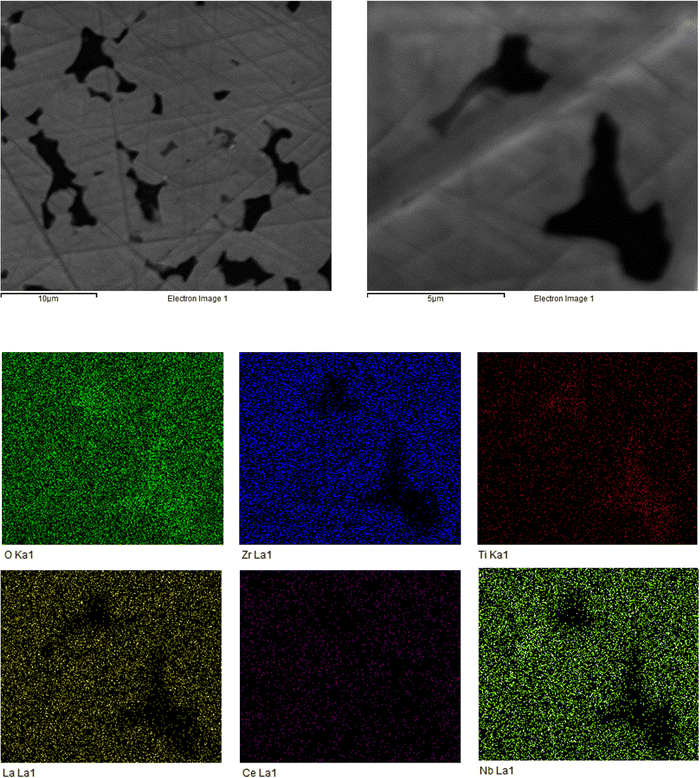
The sintered pellet (1100 °C) was analysed via SEM and EDX to assess the microstructural features and to confirm elemental content. The SEM images show a dense pellet structure with an absence of discernible grain boundaries, with the corresponding EDX indicating the expected elemental distribution (see Fig. 3). Although the pellet has well connected individual grains; clear voids are present. Therefore, magnification was increased to examine these voids more closely. Here, the EDX, while indicating a relatively homogenous distribution of elements, shows higher concentrations of Ti around the grain boundary. It is unclear why this is so, however this could relate to some incomplete synthesis, or dopant exsolution in this region. Additional SEM and EDX images are shown in the ESI,‡ for the unpolished pellet surface (which shows individual grains, see Fig. S3, ESI‡) and of the LTC powder when synthesised at 950 °C (Fig. S4, ESI‡).Conductivity
The room temperature conductivity of LTC was assessed by impedance spectroscopy for each pellet dwell time >5 min. Densities of the pellets ranged from 83–88% and were unable to be improved by times >1 h, higher temperature, slower heating rates or under N2/O2, see Table 1.A typical Nyquist plot with Au blocking electrodes is shown in Fig. 4, with the associated capacitance bode plot available in the ESI.‡ All LTC materials demonstrated a single resistivity contribution which is attributed to overlapping bulk and grain boundary contributions. Therefore, all plots were fit with a single parallel R/CPE element, see Fig. 4. The spectroscopic C plot (see Fig. S5, ESI‡) shows a high frequency plateau corresponding to capacitance in the pF cm−1 range from which dielectric constants of 48–64 were calculated (based on the permittivity of free space of 8.854 × 10⁻¹⁴ F cm−1). This corresponds to the data obtained from the equivalent circuit models and is the expected response for bulk oxide materials.76,107–109 The spike observed at low frequency relates to the Au electrode double layer, which blocks Li diffusion giving capacitive behaviour due to space-charge layers.
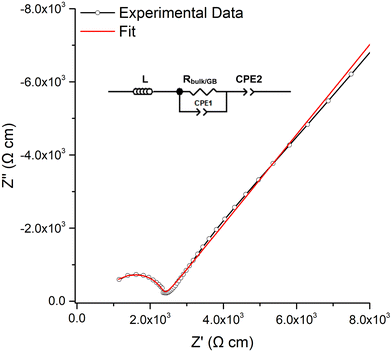 | ||
| Fig. 4 Typical Nyquist impedance plot of LTC, which was fit to the equivalent circuit in the top left. | ||
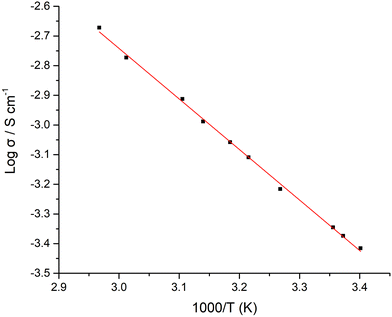
LTC materials sintered for 1 h reached a maximum conductivity of 0.4 mS cm−1 at 21 °C and 1.1 mS cm−1 at 45.5 °C. Those sintered between the 15–60 minutes saw marginal changes in conductivity (the 5 minute membrane was too thin to be studied), see Table 1. Beyond 1 h density was similar, and conductivity degraded only slightly. Therefore, LTC is a garnet system that does not require specific handling requirements to form similarly performing membranes. Variable temperature measurements were also taken on pellets sintered for 1 h, with the Arrhenius plots displayed in Fig. 5. These gave an activation energy of 0.34 eV over the temperature range of 19–64 °C.
Overall LTC is amongst the most conductive garnet system we have obtained within our laboratory and compares favourably to other reports of highly conducting systems elsewhere with similar densities and complex compositions,82,83,86,110,111 but is easy to handle, quick to synthesise/densify and potentially scalable. This, therefore, indicates if this material were able to be synthesised and then sintered fully under Ar (with no intermediate air exposure), which would eliminate any surface Li2CO3 as per work here,37,45 performance could potentially be further improved. However, if the large Li excess is facilitating high membrane porosity, hot pressing during heating may additionally be required for increased density. These approaches were, unfortunately, unable to be tested in the facilities available in our lab.
Electrochemical testing
Low CCDs in lithium garnets have been reported to relate to the number of grain boundaries/larger grains/grain orientation,114,115 grain/grain boundary electrical properties,45,115–119 microstructure120,121 and grain boundary compositional differences (compared to the bulk).45,117,122–124 Whereas high density/low porosity,42,125,126 low Li metal/garnet resistance45,127–129 and high ionic mobility (intrinsically linked with temperature)45,130–132 have been suggested to suppress dendrite growth.
Pristine cells were first analysed by IS to assess the Li/LTC area specific resistance (ASR). This gave values between 320–400 Ω cm2. This is similar to our prior reports on Ce doping, hence confirming the strategic use of Ce in low quantities to reduce interfacial resistance.61 To confirm the correct assignment of the Li/garnet interface in the impedance spectrum, Au sputtered pellets (used for conductivity) are overlaid in Fig. S9 (ESI‡).
CCD measurements were then undertaken, whereupon LTC showed stable ohmic current–voltage behaviour up to 140 μA cm−2, with mostly flat voltage profiles but with some deviation from a square profile. This is attributed to non-uniform current distribution from imperfect interfacial contact between Li and the garnet, see Fig. 7a. However, a small voltage drop occurs at 140 μA cm−2 followed by the onset of an erratic voltage profile, yet no clear/sharp voltage drop (as expected with a soft or a hard short circuit) is observed. This behaviour continued as the current density increased, see Fig. 7a. Therefore, LTC was cycled until 200 μA cm−2 and analysed by IS. The impedance spectrum showed minimal changes to the LTC bulk and grain boundary contributions (compared to the pristine cell), see Fig. 7b. This suggests no short circuit nor any reversible short circuit behaviour, as reported elsewhere.89 However, the low frequency Li/garnet interface region showed a reduced ASR from 380 Ω cm2 (pristine cell) to 250 Ω cm2. As no short circuit was observed, CCD analysis was resumed until 300 μA cm−2. At this point the cell was analysed by IS again, whereupon no changes to the bulk/GB contributions were again observed, but ASR had further reduced to 161 Ω cm2. These data indicate cycling at certain current densities can initiate some form of a current induced ASR reduction in LTC (which could also account for the slightly decreased potential when cycling ≥140 μA cm−2).
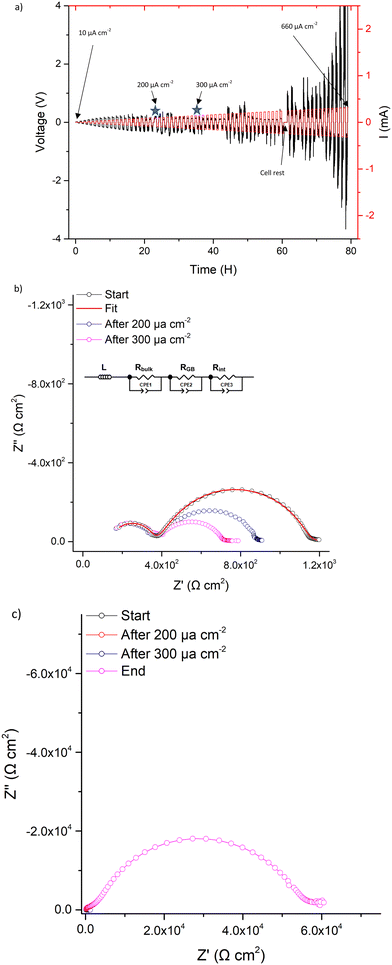 | ||
| Fig. 7 Symmetry cell impedance spectra and CCD measurements where (a) is the CCD data measured in increments of 10 μA cm−2, stars indicate where cell was stopped for impedance analysis. (b) is the overlaid impedance spectrums during the CCD testing at different current densities at room temperature and (c) the same as (b) but with final impedance spectrum showing interfacial degradation upon cell failure (additional long term cycling, at differing current densities, is available in Fig. S8, ESI‡). | ||
CCD measurements were then resumed until a large overpotential occurred (to the maximum tester voltage) at 660 μA cm−2. This automatically terminated the cell testing. Post CCD analysis by IS showed a large interfacial resistance (>29![[thin space (1/6-em)]](https://www.rsc.org/images/entities/char_2009.gif) 000 Ω cm2), which indicates complete interfacial breakdown, see Fig. 7c. This could be dopant related and is discussed more later.
000 Ω cm2), which indicates complete interfacial breakdown, see Fig. 7c. This could be dopant related and is discussed more later.
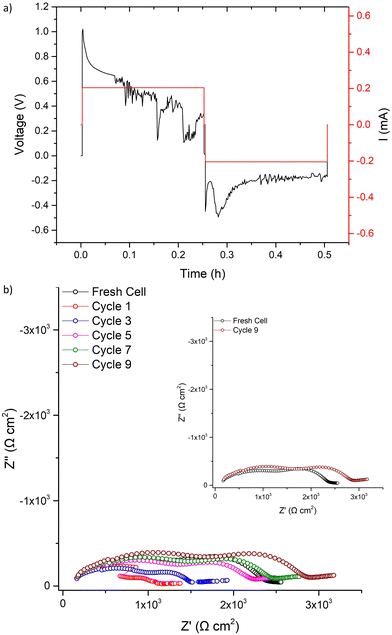
To assess if LTC was susceptible to the reversible short circuit behaviour previously reported by Ping et al., and to confirm if this was a separate reaction from the observed ASR reduction at lower current densities, symmetrical LTC cells were assembled and cycled at 500 μA cm−2, see Fig. 8a. This value was chosen based upon the CCD results in Fig. 7a, as this is prior to complete cell degradation but is where the voltage profile becomes increasingly unstable. During the first 500 μA cm−2 cycle, voltage initially increased before seeing a slow voltage drop, possibly indicative of short circuit behaviour. However, upon Immediate impedance analysis after one 500 μA cm−2 cycle, no large resistance reduction was observed. This contrasts with the work from Ping et al. However, the spectrum does potentially suggest short circuit propagation through the grain boundary, where some decreased resistance was observed, see Fig. 8b. This could indicate LTC had reversible short-circuit behaviour, but that the short circuit recovery process is more rapid compared to the Al–Ta doped LLZO analysed by Ping et al. (effectively removing Li dendrites before the IS measurements could be made). Therefore, IS was repeated continuously over the course of 1 h and the cell gradually increased in resistance, recovering to the pristine cell value in 32 minutes. Within ≈1 h the impedance spectrum of the pellet stabilised with marginally increased resistance, particularly in the Li/Garnet interface region. This suggests similar short circuit reversal trends to those obtained by Ping et al. where the reversibility was ascribed to garnet cation reduction which, thus, oxidises Li and removes the short circuit.89 However, the behaviour observed with LTC still appears to lack a clear indication of a soft or hard short circuit.
The 500 μA cm−2 cell cycling was then restarted for 31 further cycles, see Fig. 9. The voltage profile initially mimicked the first cycle (further indicating LTC had chemically reacted with any Li dendrites), before again dropping to a consistent lower voltage. After 31 cycles, IS analysis was again conducted. Here, a short circuit in the expected manner (large reduction of the bulk/GB components) was observed, with repeated impedance showing only marginal recovery. However, after a 24 h rest the short circuit had been removed. This, therefore, confirms the reversible short circuit behaviour described by Ping et al. for Al, Ta-doped garnets.
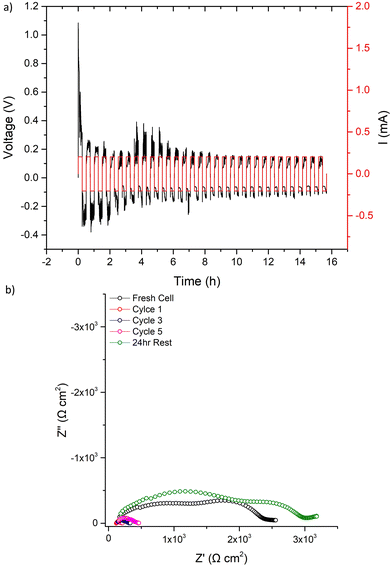 | ||
| Fig. 9 After the first cycle at 500 μA cm−2 and the corresponding impedance analysis in Fig. 8 was complete, LTC cycling was restarted at 500 μA cm−2 and results are shown for (a) 31 cycles with the corresponding impedance analysis in (b) taken as per Fig. 8b. | ||
However, the reversible short circuit in lithium symmetrical cells described by Ping et al. began at 200 μA cm−2 and consistently had a noticeable reduction in the bulk/GB contributions within the impedance spectra after a single cycle. Here, at similar (and higher current densities), the CCD of LTC showed an initial reduction in the ASR with no change in the bulk/GB contribution. Furthermore, direct cycling of pristine cells at 500 μA cm−2 did not show a clear short circuit until >30 cycles (or dendrites were so rapidly removed after a single cycle that IS could not be captured). This, therefore, indicates the unusual electrochemical behaviour of LTC cannot be ascribed solely to the reversible short circuit behaviour described by Ping et al. The dopants in LTC could be increasing the short circuit reversibility kinetics (which could be beneficial as an interlayer in a full solid state cell, where Li dendrites could be neutralised before cell failure). Therefore, to understand the dopant specific effects, the differences between garnet samples, with only Nb + Ce, or Nb + Ti dopants, were investigated further.
Dopant assessment
To assess the electrochemical properties (and the favourable synthesis/densification) of LTC, the Ti and Ce dopants were investigated individually. Firstly, Li6.5La3Zr1.25Nb0.5Ti0.25O12 (LT) and Li6.5La3Zr1.25Nb0.5Ce0.25O12 (LC) were synthesised and characterised as above, see Fig. S6 and S7 (ESI‡). LT and LC were found to rapidly form phase pure powders as for LTC, but neither demonstrated the rapid densification properties of LTC; LT required four hours to form a dense pellet, whereas LC required at least two hours. Irrespective of heating regime, the relative density LT and LC were inferior to LTC, as was conductivity. This suggests both Ti and Ce are required for optimum sintering/densification and conductivity. This is further suggested by reports elsewhere where Ti or Ce was used singularly as cubic stabilising dopant, where long synthesis/densification times were required.70,86,87,110CCD testing of LT showed that the system did not have a low ASR value (observed value was 1000–2000 Ω cm2), see Fig. S10 (ESI‡). This is contradictory to other reports, which reported that Ti based systems enabled a low interfacial resistance. These works, however, employed heating of Li metal beyond 180 °C to melt onto the interface in conditions where proton exchange could be more readily controlled.110 This did not affect the CCD testing of LT in this work as, in all cases, irrespective of ASR, no clear CCD limit was observed. The voltage profile became non-square at 280 μA cm−2, but there was no voltage drop. The voltage continued to increase until the cell tester maximum voltage was reached, see Fig. S10 (ESI‡). At the end, IS showed interfacial breakdown in LT cells. This breakdown relates to the lack of short circuit giving no easy path for higher currents. Therefore, interfacial void formation arises due to Li stripping at higher current densities, which degrades the interfacial contact between the Li and garnet. No indication of current induced ASR was found with LT.
LC gave an ASR of 328 Ω cm2, and was also examined to determine the CCD limit (see Fig. S11, ESI‡). LC obeyed ohmic current–voltage type behaviour up to 120 μA cm−2, whereupon a small voltage drop occurred, similar to LTC cells. Analysis via impedance spectroscopy after the 260 μA cm−2 step showed no short circuit but an ASR reduction from 328 Ω cm2 (pristine) to 90 Ω cm2 was observed. At 360 μA cm−2 a clear short circuit was present (removal of the bulk/GB resistive component). This was further confirmed at 600 μA cm−2. Impedance analysis indicated the short circuit did not recover, with only marginal changes noted over similar timeframes, therefore LC was distinct from LTC. This is further confirmed by the absence of interfacial breakdown at higher current densities.
Considering the analysis on LC and LT, it can be confirmed that both Ce and Ti are required for the rapid synthesis/densification and improved conductivity (compared to the single dopants). Conversely, the reduction in ASR is related to the Ce dopant only. However, results suggest that the pairing of Ti and Ce is still required to prevent a hard short circuit at higher current densities and to enable enhanced short circuit reversibility, although the reasons behind this remain unclear.
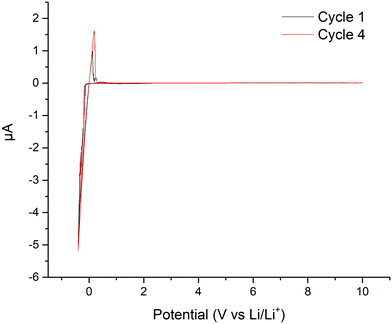
Our previous work using Ce doped LLZO has shown a reduction in ASR in pristine symmetrical Li cells, with this attributed to the formation of interfacial Ce4O7,61 although in situ improvements to ASR were not assessed. Nonetheless, it is logical to conclude a similar reaction could be present with LTC, perhaps forming a mixed Ce–Ti–O phase. This is not demonstrated in the CV results, however, it could be hidden by the large Li stripping and plating peaks, see Fig. 6. Therefore, further analysis of oxidation states was undertaken by XANES on freshly prepared and cycled LTC pellets.
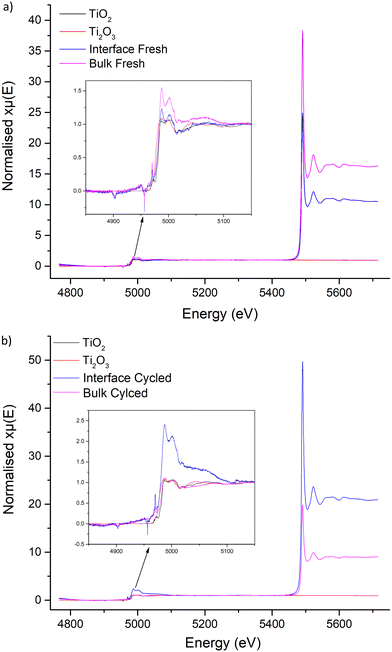
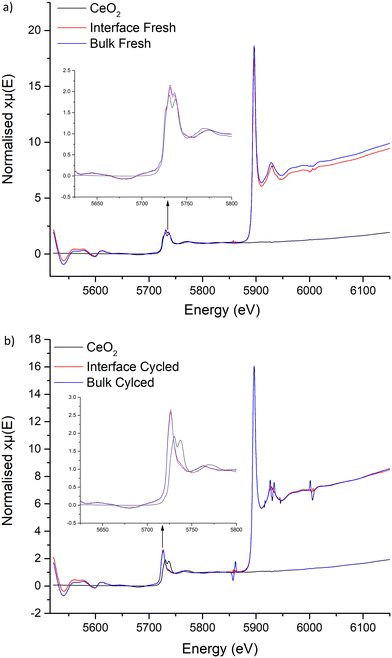
X-ray absorption near edge structure
XANES does not show surface-based phenomena, however no proton-controlled environment was available to analyse the LTC interface by X-ray photoelectron spectroscopy. Nonetheless, powder was obtained from the interface and the bulk of the pellet to ascertain if any clear differences were present based upon proximity to Li metal. Ti2O3, anatase TiO2 and CeO2 references were used for comparison, see Fig. 10 and 11.Data obtained from the Ti K edge in LTC suffered from severe interference from the strong La L3 absorption at 5491 eV, see Fig. 10. This suppressed the LTC Ti K edge peaks considerably, but a doublet is present at 4987 and 5001 eV across all LTC samples. These peaks are consistent in position and characteristics across the cycled and fresh LTC samples. This doublet corresponds more closely to the Ti K edge peak positions of the TiO2 reference. There is also a pre-edge peak in LTC at 4970 eV (absent in Ti2O3), which is similar to reports elsewhere.133–135 This suggests Ti4+ presence in LTC, but it is not conclusive due to the La interference and the difference in peak profiles arising from the comparison to anatase type TiO2, see Fig. 10. However, if the XANES spectra are compared to Ti4+ orthosilicate garnets reported in the literature, such as schorlomite and andradite, LTC has similar peak profiles, positions and pre-edge characteristics.136,137 Irrespectively, the peaks at 4987 and 5001 eV can be identified as the region corresponding to Ti in the LTC samples. Here, it can be seen the Ti peak positions and characteristics do not change between cycled and fresh LTC samples, which indicates no change of Ti during galvanostatic cycling.
Examination of the Ce L edges suffered slightly from La L2 edge interference, however absorption peaks for Ce are much clearer compared to Ti. These show the expected presence of Ce4+ within the freshly sintered materials, with a peak doublet at 5731 and 5736 eV. This corresponds to the CeO2 reference at 5730 and 5737 eV. However, post cycled pellets lacked these peaks, with a singular peak appearing at 5726 eV. This shift to lower energy indicates reduction of Ce4+ to a 3+ state. No Ce3+ reference was available to test, however, Ce3+ reports elsewhere, with compounds such as CeF3 and Ce(NO3)3·6H2O, also show a sharp singular peak in this region that is assigned to a trivalent Ce species.138–141 Therefore, this suggests that Ce is being reduced during Li stripping and plating beyond a surface reaction, penetrating into the bulk and throughout the pellet. This confirms the previous work by Dong et al., whereupon Ce reduction was suggested to occur in Li7La3Zr2−xCexO12 materials.61
The XANES data, therefore, supports the reduction of Ce in the garnet structure during cycling, with experimental evidence also confirming the ASR reduction during CCD analysis requires Ce. Therefore, as Ce is reduced from Ce4+ to Ce3+, a corresponding oxidation to Li metal is likely occurring which neutralises dendrite formation at the Li/garnet interface, which fills voids and reduces the interfacial resistance. However, once the current density reaches a critical point, dendrites will then start to penetrate the pellet. However, the Ce reduction could aid in the recovery process through the bulk/GB and remove dendrites more rapidly than non-Ce doped garnets. This could account for the lack of clear short circuit after cycling pellets at 500 μA cm−2, however the full electrochemical effects of the Ce dopant require further study.
It would appear that that Ti is required to prevent a hard short circuit forming, which then enables interfacial breakdown at high current densities. Therefore, the data suggests that Ti and Ce are both required to give reduced ASR, for low interfacial resistance, and to improve the ability of the lithium garnet to reverse a short circuit during symmetrical cell cycling. However, further studies are needed to confirm the exact mechanisms, for example by in situ symmetrical cycling using SEM and Li sensitive EDS. In particular, a cross section studied during Li dendrite growth would be valuable so that morphological and chemical changes could be monitored once cycling has stopped, and the cell is at rest. This however, is not currently available for our SEM facility.
Conclusions
In summary, a new co-doped Ti/Ce garnet material (Li6.5La3Zr1Nb0.5Ce0.25Ti0.25O12 (LTC)) has been synthesised, and rapidly densified in a single step. LTC demonstrated easy synthesis, requiring only 15–60 minutes to form dense membranes directly from the starting materials, although >45 min was required for increased phase purity. If only the powder is required, a similarly rapid synthesis can be achieved at 950 °C. It is also suggested that much faster heating rates could be employed, yielding more rapid synthesis, allowing the potential for further synthesis scale up into a continuous process. LTC was shown to be somewhat more robust than comparable singly doped garnets, as overall performance does not require specific handling, for example heating rate and/or heating times past 1 h yielded similar results. Such absence of specificity gives the potential for LTC ideal to be used within a commercial environment. We have also demonstrated that single use of Ce or Ti in these garnets does not generate the same properties, and it is the combination of both which enables the ease of handling in LTC.It was also shown that LTC presents somewhat unusual Li dendrite resistance properties during symmetrical cell cycling. Here, medium current densities were shown to initiate an ASR reduction but did not show any reversible short circuit behaviour (under similar cycling regimes), as reported in other work. This is suggested to relate to the reduction of Ce4+ to Ce3+, as confirmed by the XANES data. However, it was also experimentally shown that Ti is required to prevent hard short circuits from which the cell cannot easily recover from, therefore indicating the pairing of Ce and Ti has enabled increased dendrite reversibility kinetics compared to the singular dopants.
This report was primarily aimed at showing a high entropy garnet system which could be formed rapidly using only conventional muffle furnace sintering. However, the as complexity in garnet compositions increase, and interest in highly entropic materials progresses, so does the complexity of the electrochemistry of cell operation. In particular, the effect of the Ti dopant on lithium dendrites requires further work to understand, as does the influence of Ce, Therefore, more work is required to understand the LTC materials such as Li sensitive EDS or by further analysis via surface sensitive techniques (such as XPS). This would require facilities which can transfer samples under vacuum to avoid proton exchange and to allow assessment of the chemomechanical phenomena.
Conflicts of interest
There are no conflicts of interest to declare.Acknowledgements
We would like to thank the University of Birmingham for the studentship funding of Mark Stockham and Matthew James, and the EPSRC for funding the GENESIS project (under EP/ R024006/1) and the EPSRC Capital Award for Core Equipment (EP/T02349X/1). This work is supported by the Faraday Institution funded Nextrode (FIRG015) and CATMAT (FIRG016) Projects. We thank the Diamond Light Source for the award of beam time as part of the Energy Materials Block Allocation Group SP14239.References
- J. M. Tarascon and M. Armand, Nature, 2001, 414, 359 CrossRef CAS PubMed.
- M. Armand and J. M. Tarascon, Nature, 2008, 451, 652 CrossRef CAS PubMed.
- C.-X. Zu and H. Li, Energy Environ. Sci., 2011, 4, 2614–2624 RSC.
- M. Park, X. Zhang, M. Chung, G. B. Less and A. M. Sastry, J. Power Sources, 2010, 195, 7904–7929 CrossRef CAS.
- V. Thangadurai and W. Weppner, Ionics, 2006, 12, 81–92 CrossRef CAS.
- H. Yang, C. Guo, A. Naveed, J. Lei, J. Yang, Y. Nuli and J. Wang, Energy Storage Mater., 2018, 14, 199–221 CrossRef.
- C. Yang, K. Fu, Y. Zhang, E. Hitz and L. Hu, Adv. Mater., 2017, 29, 1701169 CrossRef PubMed.
- T. Kim, W. Song, D.-Y. Son, L. K. Ono and Y. Qi, J. Mater. Chem. A, 2019, 7, 2942–2964 RSC.
- B. Scrosati, J. Hassoun and Y. Sun, Lithium-ion batteries. A look into the future, 2011 Search PubMed.
- W. Xu, J. Wang, F. Ding, X. Chen, E. Nasybulin, Y. Zhang and J.-G. Zhang, Energy Environ. Sci., 2014, 7, 513–537 RSC.
- A. Väyrynen and J. Salminen, J. Chem. Thermodyn., 2012, 46, 80–85 CrossRef.
- C. Julien, A. Mauger, A. Vijh and K. Zaghib, Lithium Batteries: Science and Technology, Springer International Publishing, 2015 Search PubMed.
- J. B. Goodenough and K.-S. Park, J. Am. Chem. Soc., 2013, 135, 1167–1176 CrossRef CAS PubMed.
- N. Nitta, F. Wu, J. T. Lee and G. Yushin, Mater. Today, 2015, 18, 252–264 CrossRef CAS.
- A. Lewandowski and A. Świderska-Mocek, J. Power Sources, 2009, 194, 601–609 CrossRef CAS.
- H. Wu, D. Zhuo, D. Kong and Y. Cui, Nat. Commun., 2014, 5, 5193 CrossRef CAS PubMed.
- Y. Kato, S. Hori, T. Saito, K. Suzuki, M. Hirayama, A. Mitsui, M. Yonemura, H. Iba and R. Kanno, Nat. Energy, 2016, 1, 16030 CrossRef CAS.
- V. A. Agubra and J. W. Fergus, J. Power Sources, 2014, 268, 153–162 CrossRef CAS.
- L. Wang, Z. Zhou, X. Yan, F. Hou, L. Wen, W. Luo, J. Liang and S. X. Dou, Energy Storage Mater., 2018, 14, 22–48 CrossRef.
- V. Etacheri, R. Marom, R. Elazari, G. Salitra and D. Aurbach, Energy Environ. Sci., 2011, 4, 3243–3262 RSC.
- X. Shen, H. Liu, X.-B. Cheng, C. Yan and J.-Q. Huang, Energy Storage Mater., 2018, 12, 161–175 CrossRef.
- H. Duan, H. Zheng, Y. Zhou, B. Xu and H. Liu, Solid State Ion., 2018, 318, 45–53 CrossRef CAS.
- J. Li, C. Ma, M. Chi, C. Liang and N. J. Dudney, Adv. Energy Mater., 2015, 5, 1401408 CrossRef.
- F. Zheng, M. Kotobuki, S. Song, M. O. Lai and L. Lu, J. Power Sources, 2018, 389, 198–213 CrossRef CAS.
- Y. Zheng, Y. Yao, J. Ou, M. Li, D. Luo, H. Dou, Z. Li, K. Amine, A. Yu and Z. Chen, Chem. Soc. Rev., 2020, 49, 8790–8839 RSC.
- J. Fang, Wu, Z. Zou, B. Pu, L. Ladenstein, S. Lin, W. Xie, S. Li, B. He, Y. Fan, W. K. Pang, H. M. R. Wilkening, X. Guo, C. Xu, T. Zhang, S. Shi and J. Liu, Adv. Mater., 2023, 2303730 Search PubMed.
- U. Roy, N. A. Fleck and V. S. Deshpande, Ext. Mech. Lett., 2021, 46, 101307 CrossRef.
- J. A. Lewis, F. J. Q. Cortes, Y. Liu, J. C. Miers, A. Verma, B. S. Vishnugopi, J. Tippens, D. Prakash, T. S. Marchese, S. Y. Han, C. Lee, P. P. Shetty, H.-W. Lee, P. Shevchenko, F. De Carlo, C. Saldana, P. P. Mukherjee and M. T. McDowell, Nat. Mater., 2021, 20, 503–510 CrossRef CAS PubMed.
- J. G. Kim, B. Son, S. Mukherjee, N. Schuppert, A. Bates, O. Kwon, M. J. Choi, H. Y. Chung and S. Park, J. Power Sources, 2015, 282, 299–322 CrossRef CAS.
- W. Luo, Y. Gong, Y. Zhu, Y. Li, Y. Yao, Y. Zhang, K. Fu, G. Pastel, C.-F. Lin, Y. Mo, E. D. Wachsman and L. Hu, Adv. Mater., 2017, 29, 1606042 CrossRef PubMed.
- L. Cheng, C. H. Wu, A. Jarry, W. Chen, Y. Ye, J. Zhu, R. Kostecki, K. Persson, J. Guo, M. Salmeron, G. Chen and M. Doeff, ACS Appl. Mater. Interfaces, 2015, 7, 17649–17655 CrossRef CAS PubMed.
- R. Sudo, Y. Nakata, K. Ishiguro, M. Matsui, A. Hirano, Y. Takeda, O. Yamamoto and N. Imanishi, Solid State Ion., 2014, 262, 151–154 CrossRef CAS.
- B. Chen, C. Xu and J. Zhou, J. Electrochem. Soc., 2018, 165, A3946–A3951 CrossRef CAS.
- Y. Zhu, X. He and Y. Mo, J. Mater. Chem. A, 2016, 4, 3253–3266 RSC.
- G. L. Gregory, H. Gao, B. Liu, X. Gao, G. J. Rees, M. Pasta, P. G. Bruce and C. K. Williams, J. Am. Chem. Soc., 2022, 144, 17477–17486 CrossRef CAS PubMed.
- T. Wu, W. Dai, M. Ke, Q. Huang and L. Lu, Adv. Sci., 2021, 8, 2100774 CrossRef CAS PubMed.
- C. Bernuy-Lopez, W. Manalastas, J. M. Lopez del Amo, A. Aguadero, F. Aguesse and J. A. Kilner, Chem. Mater., 2014, 26, 3610–3617 CrossRef CAS.
- X. Huang, T. Xiu, M. E. Badding and Z. Wen, Ceram. Int., 2018, 44, 5660–5667 CrossRef CAS.
- T. Thompson, J. Wolfenstine, J. L. Allen, M. Johannes, A. Huq, I. N. David and J. Sakamoto, J. Mater. Chem. A, 2014, 2, 13431–13436 RSC.
- A. Ramzy and V. Thangadurai, ACS Appl. Mater. Interfaces, 2010, 2, 385–390 CrossRef CAS PubMed.
- S. Hu, Y.-F. Li, R. Yang, Z. Yang and L. Wang, Ceram. Int., 2018, 44, 6614–6618 CrossRef CAS.
- Y. Ren, Y. Shen, Y. Lin and C.-W. Nan, Electrochem. Commun., 2015, 57, 27–30 CrossRef CAS.
- F. Flatscher, M. Philipp, S. Ganschow, H. M. R. Wilkening and D. Rettenwander, J. Mater. Chem. A, 2020, 8, 15782–15788 RSC.
- R. H. Brugge, F. M. Pesci, A. Cavallaro, C. Sole, M. A. Isaacs, G. Kerherve, R. S. Weatherup and A. Aguadero, J. Mater. Chem. A, 2020, 8, 14265–14276 RSC.
- Federico M. Pesci, R. H. Brugge, A. K. O. Hekselman, A. Cavallaro, R. J. Chater and A. Aguadero, J. Mater. Chem. A, 2018, 6, 19817–19827 RSC.
- W. Chang, R. May, M. Wang, G. Thorsteinsson, J. Sakamoto, L. Marbella and D. Steingart, Nat. Commun., 2021, 12, 6369 CrossRef CAS PubMed.
- X. Zhang, Q. Xiang, S. Tang, A. Wang, X. Liu and J. Luo, Nano Lett., 2020, 20, 2871–2878 CrossRef CAS PubMed.
- H. Yan, K. Tantratian, K. Ellwood, E. T. Harrison, M. Nichols, X. Cui and L. Chen, Adv. Energy Mater., 2021, 2102283 Search PubMed.
- H. Zheng, G. Li, J. Liu, S. Wu, X. Zhang, Y. Wu, H. Zhu, X. Huang, H. Liu and H. Duan, Energy Storage Mater., 2022, 49, 278–290 CrossRef.
- A. F. Wells, Structural inorganic chemistry, Clarendon Press, 1984 Search PubMed.
- V. Thangadurai, S. Adams and W. Weppner, Chem. Mater., 2004, 16, 2998–3006 CrossRef CAS.
- E. J. Cussen and T. W. S. Yip, J. Solid State Chem., 2007, 180, 1832–1839 CrossRef CAS.
- E. J. Cussen, Chem. Commun., 2006, 412–413, 10.1039/B514640B.
- M. P. O'Callaghan, D. R. Lynham, E. J. Cussen and G. Z. Chen, Chem. Mater., 2006, 18, 4681–4689 CrossRef.
- V. Thangadurai, H. Kaack and W. J. F. Weppner, J. Am. Ceram. Soc., 2004, 86, 437–440 CrossRef.
- R. Murugan, V. Thangadurai and W. Weppner, Angew. Chem., Int. Ed., 2007, 46, 7778–7781 CrossRef CAS PubMed.
- C. A. Geiger, E. Alekseev, B. Lazic, M. Fisch, T. Armbruster, R. Langner, M. Fechtelkord, N. Kim, T. Pettke and W. Weppner, Inorg. Chem., 2011, 50, 1089–1097 CrossRef CAS PubMed.
- J. Awaka, N. Kijima, K. Kataoka, H. Hayakawa, K.-I. Ohshima and J. Akimoto, J. Solid State Chem., 2010, 183, 180–185 CrossRef CAS.
- J. Awaka, N. Kijima, H. Hayakawa and J. Akimoto, J. Solid State Chem., 2009, 182, 2046–2052 CrossRef CAS.
- J. Percival, E. Kendrick, R. I. Smith and P. R. Slater, Dalton Trans., 2009, 5177–5181, 10.1039/b907331k.
- B. Dong, S. R. Yeandel, P. Goddard and P. R. Slater, Chem. Mater., 2020, 32, 215–223 CrossRef CAS.
- R. Wagner, G. J. Redhammer, D. Rettenwander, A. Senyshyn, W. Schmidt, M. Wilkening and G. Amthauer, Chem. Mater., 2016, 28, 1861–1871 CrossRef CAS PubMed.
- J. Percival and P. R. Slater, Solid State Commun., 2007, 142, 355–357 CrossRef CAS.
- K. Kataoka and J. Akimoto, Inorg. Chem., 2020, 59, 14376–14381 CrossRef CAS PubMed.
- R. Murugan, V. Thangadurai and W. Weppner, Appl. Phys. A, 2008, 91, 615–620 CrossRef CAS.
- M. A. Howard, O. Clemens, E. Kendrick, K. S. Knight, D. C. Apperley, P. A. Anderson and P. R. Slater, Dalton Trans., 2012, 41, 12048–12053 RSC.
- J. L. Allen, J. Wolfenstine, E. Rangasamy and J. Sakamoto, J. Power Sources, 2012, 206, 315–319 CrossRef CAS.
- B. Dong, L. L. Driscoll, M. P. Stockham, E. Kendrick and P. R. Slater, Solid State Ion., 2020, 350, 115317 CrossRef CAS.
- M. P. Stockham, B. Dong, M. S. James, Y. Li, Y. Ding and P. R. Slater, Dalton Trans., 2021, 50, 2364–2374 RSC.
- B. Dong, M. P. Stockham, P. A. Chater and P. R. Slater, Dalton Trans., 2020, 49, 11727–11735 RSC.
- M. A. Howard, O. Clemens, E. Kendrick, K. S. Knight, D. C. Apperley, P. A. Anderson and P. R. Slater, Dalton Trans., 2012, 41, 12048–12053 RSC.
- S. Narayanan and V. Thangadurai, J. Power Sources, 2011, 196, 8085–8090 CrossRef CAS.
- S. Narayanan, F. Ramezanipour and V. Thangadurai, J. Phys. Chem. C, 2012, 116, 20154–20162 CrossRef CAS.
- M. Botros, R. Djenadic, O. Clemens, M. Möller and H. Hahn, J. Power Sources, 2016, 309, 108–115 CrossRef CAS.
- J.-F. Wu, E.-Y. Chen, Y. Yu, L. Liu, Y. Wu, W. K. Pang, V. K. Peterson and X. Guo, ACS Appl. Mater. Interfaces, 2017, 9, 1542–1552 CrossRef CAS PubMed.
- R. H. Brugge, J. A. Kilner and A. Aguadero, Solid State Ion., 2019, 337, 154–160 CrossRef CAS.
- X. Wang, J. Liu, R. Yin, Y. Xu, Y. Cui, L. Zhao and X. Yu, Mater. Lett., 2018, 231, 43–46 CrossRef CAS.
- J. Gai, E. Zhao, F. Ma, D. Sun, X. Ma, Y. Jin, Q. Wu and Y. Cui, J. Eur. Ceram. Soc., 2018, 38, 1673–1678 CrossRef CAS.
- N. Janani, C. Deviannapoorani, L. Dhivya and R. Murugan, RSC Adv., 2014, 4, 51228–51238 RSC.
- V. Thangadurai and W. Weppner, J. Am. Ceram. Soc., 2005, 88, 411–418 CrossRef CAS.
- M. P. Stockham, B. Dong and P. R. Slater, J. Solid State Chem., 2022, 308, 122944 CrossRef CAS.
- S.-K. Jung, H. Gwon, H. Kim, G. Yoon, D. Shin, J. Hong, C. Jung and J.-S. Kim, Nat. Commun., 2022, 13, 7638 CrossRef CAS PubMed.
- C.-H. Kuo, A.-Y. Wang, H.-Y. Liu, S.-C. Huang, X.-R. Chen, C.-C. Chi, Y.-C. Chang, M.-Y. Lu and H.-Y. Chen, APL Mater., 2022, 10, 121104 CrossRef CAS.
- Y. Zhang, F. Chen, J. Li, L. Zhang, J. Gu, D. Zhang, K. Saito, Q. Guo, P. Luo and S. Dong, Electrochim. Acta, 2018, 261, 137–142 CrossRef CAS.
- C. Shao, Z. Yu, H. Liu, Z. Zheng, N. Sun and C. Diao, Electrochim. Acta, 2017, 225, 345–349 CrossRef CAS.
- J. Gao, J. Zhu, X. Li, J. Li, X. Guo, H. Li and W. Zhou, Adv. Funct. Mater., 2021, 31, 2001918 CrossRef CAS.
- Z. Xu, X. Hu, B. Fu, K. Khan, J. Wu, T. Li, H. Zhou, Z. Fang and M. Wu, J. Materiomics, 2023, 9, 651–660 CrossRef.
- S. Saran, Y. R. Eker, Ş. Ateş, G. Çelik, H. Baveghar, O. M. Özkendir, Ü. Atav and W. Klysubun, Adv. Appl. Ceram., 2023, 1–9, DOI:10.1080/17436753.2023.2167680.
- W. Ping, C. Wang, Z. Lin, E. Hitz, C. Yang, H. Wang and L. Hu, Adv. Energy Mater., 2020, 10, 2000702 CrossRef CAS.
- R. H. Brugge, A. K. O. Hekselman, A. Cavallaro, F. M. Pesci, R. J. Chater, J. A. Kilner and A. Aguadero, Chem. Mater., 2018, 30, 3704–3713 CrossRef CAS.
- G. Larraz, A. Orera and M. L. Sanjuán, J. Mater. Chem. A, 2013, 1, 11419–11428 RSC.
- C. Galven, J. Dittmer, E. Suard, F. Le Berre and M.-P. Crosnier-Lopez, Chem. Mater., 2012, 24, 3335–3345 CrossRef CAS.
- M. A. Howard, O. Clemens, K. S. Knight, P. A. Anderson, S. Hafiz, P. M. Panchmatia and P. R. Slater, J. Mater. Chem. A, 2013, 1, 14013–14022 RSC.
- M. A. Howard, O. Clemens, A. S. Parvathy, P. A. Anderson and P. R. Slater, J. Alloys Compd., 2016, 670, 78–84 CrossRef CAS.
- J. Percival, D. Apperley and P. R. Slater, Solid State Ion., 2008, 179, 1693–1696 CrossRef CAS.
- H. Peng, Y. Zhang, L. Li and L. Feng, Solid State Ion., 2017, 304, 71–74 CrossRef CAS.
- B. Toby and R. Dreele, J. Appl. Crystallogr., 2013, 46, 544–549 CrossRef CAS.
- K. Momma and F. Izumi, J. Appl. Crystallogr., 2011, 44, 1272–1276 CrossRef CAS.
- M. P. Stockham, B. Dong, M. S. James, Y. Li, Y. Ding, E. Kendrick and P. R. Slater, Dalton Trans., 2021, 50, 13786–13800 RSC.
- R. Wagner, G. J. Redhammer, D. Rettenwander, G. Tippelt, A. Welzl, S. Taibl, J. Fleig, A. Franz, W. Lottermoser and G. Amthauer, Chem. Mater., 2016, 28, 5943–5951 CrossRef CAS PubMed.
- N. Hamao, K. Kataoka and J. Akimoto, Li-ion conductivity and crystal structure of garnet-type Li6.5La3M1.5Ta0.5O12 (M = Hf, Sn) oxides, 2017 Search PubMed.
- M. P. Stockham, B. Dong, Y. Ding, Y. Li and P. R. Slater, Dalton Trans., 2020, 49, 10349–10359 RSC.
- Y.-T. Chen, A. Jena, W. K. Pang, V. K. Peterson, H.-S. Sheu, H. Chang and R.-S. Liu, J. Phys. Chem. C, 2017, 121, 15565–15573 CrossRef CAS.
- G. V. Alexander, N. C. Rosero-Navarro, A. Miura, K. Tadanaga and R. Murugan, J. Mater. Chem. A, 2018, 6, 21018–21028 RSC.
- Y. V. Baklanova, A. P. Tyutyunnik, N. V. Tarakina, A. D. Fortes, L. G. Maksimova, D. V. Korona and T. A. Denisova, J. Power Sources, 2018, 391, 26–33 CrossRef CAS.
- B. Dong, A. R. Haworth, S. R. Yeandel, M. P. Stockham, M. S. James, J. Xiu, D. Wang, P. Goddard, K. E. Johnston and P. R. Slater, J. Mater. Chem. A, 2022, 10, 11172–11185 RSC.
- D. Rettenwander, G. Redhammer, F. Preishuber-Pflügl, L. Cheng, L. Miara, R. Wagner, A. Welzl, E. Suard, M. M. Doeff, M. Wilkening, J. Fleig and G. Amthauer, Chem. Mater., 2016, 28, 2384–2392 CrossRef CAS PubMed.
- A. Wachter-Welzl, J. Kirowitz, R. Wagner, S. Smetaczek, G. C. Brunauer, M. Bonta, D. Rettenwander, S. Taibl, A. Limbeck, G. Amthauer and J. Fleig, Solid State Ion., 2018, 319, 203–208 CrossRef CAS.
- S. Narayanan, A. K. Baral and V. Thangadurai, Phys. Chem. Chem. Phys., 2016, 18, 15418–15426 RSC.
- J. Zhu, X. Li, C. Wu, J. Gao, H. Xu, Y. Li, X. Guo, H. Li and W. Zhou, Angew. Chem., Int. Ed., 2021, 60, 3781–3790 CrossRef CAS PubMed.
- Z. Qin, Y. Xie, X. Meng, D. Qian, D. Mao, Z. Zheng, L. Wan and Y. Huang, ACS Appl. Mater. Interfaces, 2022, 14, 40959–40966 CrossRef CAS PubMed.
- S. Ohta, T. Kobayashi and T. Asaoka, J. Power Sources, 2011, 196, 3342–3345 CrossRef CAS.
- Y. Li, J.-T. Han, C.-A. Wang, H. Xie and J. B. Goodenough, J. Mater. Chem., 2012, 22, 15357–15361 RSC.
- A. Sharafi, C. G. Haslam, R. D. Kerns, J. Wolfenstine and J. Sakamoto, J. Mater. Chem. A, 2017, 5, 21491–21504 RSC.
- L. Cheng, W. Chen, M. Kunz, K. Persson, N. Tamura, G. Chen and M. Doeff, ACS Appl. Mater. Interfaces, 2015, 7, 2073–2081 CrossRef CAS PubMed.
- H.-K. Tian, Z. Liu, Y. Ji, L.-Q. Chen and Y. Qi, Chem. Mater., 2019, 31, 7351–7359 CrossRef CAS.
- R. Raj and J. Wolfenstine, J. Power Sources, 2017, 343, 119–126 CrossRef CAS.
- M. D. Tikekar, S. Choudhury, Z. Tu and L. A. Archer, Nat. Energy, 2016, 1, 16114 CrossRef CAS.
- Y. Song, L. Yang, W. Zhao, Z. Wang, Y. Zhao, Z. Wang, Q. Zhao, H. Liu and F. Pan, Adv. Energy Mater., 2019, 9, 1900671 CrossRef.
- R. Hongahally Basappa, T. Ito, T. Morimura, R. Bekarevich, K. Mitsuishi and H. Yamada, J. Power Sources, 2017, 363, 145–152 CrossRef CAS.
- B. Xu, W. Li, H. Duan, H. Wang, Y. Guo, H. Li and H. Liu, J. Power Sources, 2017, 354, 68–73 CrossRef CAS.
- S. Yu and D. J. Siegel, Chem. Mater., 2017, 29, 9639–9647 CrossRef CAS.
- K. Ishiguro, H. Nemori, S. Sunahiro, Y. Nakata, R. Sudo, M. Matsui, Y. Takeda, O. Yamamoto and N. Imanishi, J. Electrochem. Soc., 2014, 161, A668–A674 CrossRef CAS.
- S. Yu and D. J. Siegel, ACS Appl. Mater. Interfaces, 2018, 10, 38151–38158 CrossRef CAS PubMed.
- Y. Lu, X. Huang, Y. Ruan, Q. Wang, R. Kun, J. Yang and Z. Wen, J. Mater. Chem. A, 2018, 6, 18853–18858 RSC.
- M. B. Dixit, M. Regala, F. Shen, X. Xiao and K. B. Hatzell, ACS Appl. Mater. Interfaces, 2019, 11, 2022–2030 CrossRef CAS PubMed.
- A. Sharafi, S. Yu, M. Naguib, M. Lee, C. Ma, H. M. Meyer, J. Nanda, M. Chi, D. J. Siegel and J. Sakamoto, J. Mater. Chem. A, 2017, 5, 13475–13487 RSC.
- R. H. Basappa, T. Ito and H. Yamada, J. Electrochem. Soc., 2017, 164, A666–A671 CrossRef CAS.
- S. Kim, C. Jung, H. Kim, K. E. Thomas-Alyea, G. Yoon, B. Kim, M. E. Badding, Z. Song, J. Chang, J. Kim, D. Im and K. Kang, Adv. Energy Mater., 2020, 10, 1903993 CrossRef CAS.
- A. Sharafi, H. M. Meyer, J. Nanda, J. Wolfenstine and J. Sakamoto, J. Power Sources, 2016, 302, 135–139 CrossRef CAS.
- N. J. Taylor, S. Stangeland-Molo, C. G. Haslam, A. Sharafi, T. Thompson, M. Wang, R. Garcia-Mendez and J. Sakamoto, J. Power Sources, 2018, 396, 314–318 CrossRef CAS.
- G. V. Alexander, M. S. Indu and R. Murugan, Ionics, 2021, 27, 4105–4126 CrossRef CAS.
- J. Kanchanawarin, W. Limphirat, P. Promchana, T. Sooknoi, T. Maluangnont, K. Simalaotao, A. Boonchun, P. Reunchan, S. Limpijumnong and J. T. Thienprasert, J. Appl. Phys., 2018, 124, 155101 CrossRef.
- D. Mardare, A. Yildiz, R. Apetrei, P. Rambu, D. Florea, N. G. Gheorghe, D. Macovei, C. M. Teodorescu and D. Luca, J. Mater. Res., 2012, 27, 2271–2277 CrossRef CAS.
- H. Masai, H. Sakurai, A. Koreeda, Y. Fujii, T. Ohkubo, T. Miyazaki and T. Akai, Sci. Rep., 2020, 10, 11615 CrossRef CAS PubMed.
- A. J. Berry, A. M. Walker, J. Hermann, H. S. C. O'Neill, G. J. Foran and J. D. Gale, Chem. Geology, 2007, 242, 176–186 CrossRef CAS.
- M. R. Ackerson, N. D. Tailby and E. B. Watson, Am. Miner., 2017, 102, 173–183 CrossRef.
- S. Phokha, S. Pinitsoontorn, P. Chirawatkul, Y. Poo-arporn and S. Maensiri, Nanoscale Res. Lett., 2012, 7, 425 CrossRef PubMed.
- C. H. Booth, M. D. Walter, M. Daniel, W. W. Lukens and R. A. Andersen, Phys. Rev. Lett., 2005, 95, 267202 CrossRef CAS PubMed.
- M. Tella, M. Auffan, L. Brousset, E. Morel, O. Proux, C. Chanéac, B. Angeletti, C. Pailles, E. Artells, C. Santaella, J. Rose, A. Thiéry and J. Y. Bottero, Environ. Sci.: Nano, 2015, 2, 653–663 RSC.
- W. Yuan, Q. Ma, Y. Liang, C. Sun, K. V. L. V. Narayanachari, M. J. Bedzyk, I. Takeuchi and S. M. Haile, J. Mater. Chem. A, 2020, 8, 9850–9858 RSC.
- B. Ravel and M. Newville, J. Synchrotron Radiat., 2005, 12, 537–541 CrossRef CAS PubMed.
Footnotes |
| † Raw experimental data can be found at: https://doi.org/10.25500/edata.bham.00000986. |
| ‡ Electronic supplementary information (ESI) available. See DOI: https://doi.org/10.1039/d3ya00123g |
| This journal is © The Royal Society of Chemistry 2023 |

