 Open Access Article
Regulating the size and assembled structure of graphene building blocks for high-performance silicon nanocomposite anodes†
Bo
Nie
a,
David
Sanchez
b,
Mataz
Alcoutlabi
b,
Tengxiao
Liu
*c,
Saurabh
Basu
a,
Soundar
Kumara
a,
Gongkai
Wang
 *d and
Hongtao
Sun
 *ae
*ae
aThe Harold & Inge Marcus Department of Industrial & Manufacturing Engineering, The Pennsylvania State University, University Park, 16802, Pennsylvania, USA. E-mail: hongtao.sun@psu.edu
bDepartment of Mechanical Engineering, The University of Texas, Rio Grande Valley, 78539, Texas, USA
cDepartment of Biomedical Engineering, The Pennsylvania State University, University Park, 16802, Pennsylvania, USA. E-mail: tql5160@psu.edu
dTianjin Key Laboratory of Materials Laminating Fabrication and Interface Control Technology, School of Material Science and Engineering, Hebei University of Technology, Tianjin, 300130, China. E-mail: wang.gongkai@hebut.edu.cn
eMaterials Research Institute (MRI), The Pennsylvania State University, University Park, 16802, Pennsylvania, USA
First published on 14th July 2023
Abstract
Silicon-based composites have received significant interest as a high-capacity anode material for high-performance lithium-ion batteries. However, the large volume change during prolonged charge/discharge cycles, poor electric conductivity, and unstable solid electrolyte interface of the Si electrodes lead to performance degradations, such as fast capacity decay and low coulombic efficiency (CE). It's promising but challenging to fabricate Si-based composite anodes with a high Si active material, which enables high energy density, high-rate capability, and good cycling stability. Herein, the size effect of mechanically robust and highly conductive graphene sheets was investigated to effectively regulate the charge transport kinetics, volume changes, first cycle CE, and stable solid-electrolyte-interphase of the Si-anode for improved electrochemical performance. Specifically, our developed nanocomposite electrode (Si@ULG) consisting of Si nanoparticles (NPs) enveloped by ultra-large graphene sheets (ULG) can deliver a specific capacity of 1478 mA h g−1 even after 200 cycles at C/5, with a low capacity loss of 0.23% per cycle. This outstanding cycling performance surpasses that of electrodes wrapped by small (SG) or large graphene sheets (LG). By further assembling ULG sheets as building blocks into a three-dimensional (3D) graphene framework to load a high weight percentage of graphene-wrapped Si materials (e.g., Si@ULG), the as-prepared binder-free 3D Si@ULG-ULG nanocomposite electrode (with a high mass loading of 3 mg cm−2) enabled an areal capacity of 2.1 mA h cm−2 after 200 cycles at C/5, which is much higher than the slurry coating thin-film anodes (e.g., 0.12 mA h cm−2) at low areal mass loading (0.49 mg cm−2).
Introduction
With the growing demand for high-performance electrochemical energy storage devices (EESDs), lithium-ion batteries dominate the market for consumer electronics, transportation, and large-scale grid storage.1–5 As a promising anode material, silicon is abundant and has a high theoretical capacity of 4200 mA h g−1 and a low discharge potential (∼0.3 V versus Li/Li+).6,7 However, the Si anode suffers from severe structural degradation, low intrinsic conductivity, and unstable solid–electrolyte interphase (SEI) during repeated lithiation and de-lithiation processes.8,9 In particular, these deficiencies bring about the loss of Li+ inventory and Si particle fracture due to the large volumetric change (>300%) during cycling.Many strategies have been applied to address these issues. For example, nanostructured silicon with carbonaceous materials has been extensively studied for the improved electrochemical performance of LIBs.10 Specifically, the porous or nano-sized silicon materials in combination with the carbon network have been investigated to allow the effective mitigation of high mechanical strain, pulverization of Si NPs, and anode cracking.11 The liquid electrolyte modification with effective additives, including fluorinated carbonates and cyclic ethers, has been explored to facilitate a stable SEI layer by inhibiting the further decomposition of the organic solvent.12 The polymer binders with enhanced binding affinity between the Si NPs, binder, and current collector have been reported to endure the structural stability of Si electrodes.13 Among these strategies, engineering Si nanostructures with different carbonaceous materials is an effective approach to improve the battery performance by increasing the electrical conductivity and counteracting the pulverization of Si NPs. Two-dimensional graphene sheets have been widely used in energy storage due to their superior thermal and electrical conductivities, large surface area, and mechanical robustness.14–16 Incorporating graphene for composite electrode designs has demonstrated excellent performance for different high-capacity active materials.16–22 Although many efforts have been devoted to silicon and graphene composite electrodes for improved electrochemical performance,23–26 what is lacking is how to tune and make good use of graphene to further boost the performance of Si-based anodes. For example, the affinity between Si and graphene, graphene sheet dimensions, and composite architectures are essential to stabilize Si active materials during charge-discharge processes.24,27,28 In particular, the anisotropic size effect of the 2D graphene nanosheets is one of the key features influencing the electrochemical performance by stabilizing the SEI, improving first cycle CE, mitigating volume change, and improving electrical conductivity.29,30
To this end, incorporating Si materials into different sizes of graphene sheets for an optimized nanocomposite electrode design is reported in the present work as a general strategy to effectively stabilize the Si active material during charge–discharge cycling. Herein, a one-pot approach was developed to encapsulate Si NPs into graphene sheets with different lateral sizes. Then a two-step process was further studied to load Si NPs into a self-assembled three-dimensional graphene framework for high areal performance. As a result, the as-prepared Si anode wrapped by ultra-large graphene sheets (ULG) exhibited excellent battery lifetimes and high-rate capabilities owing to the long-range interconnected conductive network for fast charge transport. The ULG, assembled into the 3D network, provided a mechanically robust scaffold and free space to accommodate the volume change caused by the Li+ insertion/extraction during charge/discharge cycles. These findings provide new insights into improving the electrochemical performance of Si-based composite anodes for high-energy-density Li-ion batteries.
Experimental
Preparation of silicon–graphene nanocomposites
The graphene-wrapped Si (Si@G) electrodes were prepared by the one-pot synthesis method, followed by thermal annealing to improve the electrical conductivity of the graphene networks (Fig. 1). Different-sized graphene oxide (GO) sheets were synthesized using different meshes of graphite flakes via the Hummers’ methods. Three types of GO dispersions were produced by the size-target separation, namely ultra large GO sheets (ULGO), large GO sheets (LGO), and small GO sheets (SGO). In the mixing process, one of the most crucial steps is to create the opposite charge between Si nanoparticles (NPs) and the graphene sheets by surface modification. Briefly, the Si NPs were dispersed in the aqueous solution with a surfactant (PVP). The various GO dispersions were further mixed with the solution via a sonication process. After freeze drying, the Si NPs wrapped up with different sizes of GO sheets (e.g., Si@SG, Si@LG, Si@ULG) were formed after thermal reduction.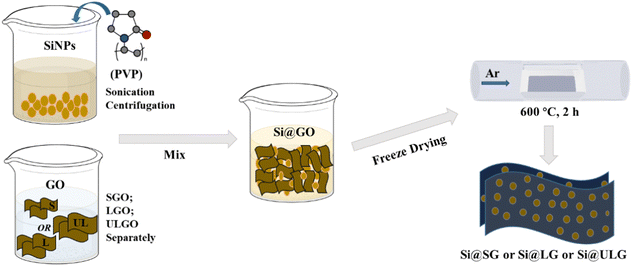 | ||
| Fig. 1 The illustration of the process flows to synthesize Si anodes wrapped up with different sizes of graphene sheets. | ||
Synthesis of graphene oxide (GO)
Graphene oxide (GO) was prepared by oxidation of natural graphite flakes (50 and 325 meshes; Sigma-Aldrich) according to the modified Hummers’ method. The small GO, denoted as SGO, was prepared from the 325-mesh graphite. The ultra-large and large GO batches (50-mesh graphite) were separated by collecting the small-size GO sheets on the top and relatively large-size GO sheets at the bottom in the solution after centrifuging, denoted as ULGO and LGO, respectively. All the GO solutions (3.6 mg mL−1) were stored in a fridge before use.A two-step process to prepare 3D freestanding composite electrodes
3D Si-based composites were prepared using a two-step process. The various graphene-wrapped Si NP composites (e.g., Si@SGO and Si@ULGO) were redispersed into 2.5 mL of 2 mg mL−1 ULGO, then diluted to 4 mL. Excess sodium ascorbate was added to this aqueous mixture and heated at 95 °C for 2 hours to reduce the GO into rGO. The as-prepared materials were washed with D.I. water four times to remove any impurities. After freeze-drying, the samples were annealed at 600 °C under argon flow for 2 hours to further improve the electrical conductivity of graphene.Material characterization
The morphology and structure of the materials were characterized by scanning electron microscopy (SEM, Zeiss Supra 40 VP) and transmission electron microscopy (TEM, Titan S/TEM FEI). X-ray diffraction (XRD) was performed using a Panalytical X’Pert Pro X-ray Powder Diffractometer. Thermogravimetric analysis (TGA, PerkinElmer instruments Pyris Diamond TG/DTA) was used in an air atmosphere from room temperature to 800 °C at a heating rate of 10 °C min−1.Electrochemical characterization
The Si@G composite anodes were prepared by mixing the composite with 10 wt% of alginate binder in an aqueous solution or PVDF in an NMP solution to form a slurry. The pure Si NP anode was prepared by mixing 80 wt% Si NPs, 10 wt% carbon black, and 10 wt% alginate binder in an aqueous solution. The slurry was coated on the Cu foil and dried at 120 °C in a vacuum oven overnight. The mass loading of the prepared electrodes is 0.26–0.31 mg cm−2. The 2032-coin cells were assembled inside an argon-filled glovebox with water and oxygen content kept below 0.1 ppm. 1.0 M lithium hexafluorophosphate (LiPF6) in a mixture of ethylene carbonate (EC) and dimethyl carbonate (DMC) was used as the electrolyte (EC/DMC, 1![[thin space (1/6-em)]](https://www.rsc.org/images/entities/char_2009.gif) :
:![[thin space (1/6-em)]](https://www.rsc.org/images/entities/char_2009.gif) 1 volume ratio, BASF, USA). Galvanostatic charge/discharge cycling was conducted in a multichannel battery testing system (LAND CT2001A). Cyclic voltammetry and electrochemical impedance spectroscopy (EIS) were carried out using a VersaSTAT4 from Princeton Applied Research. The EIS measurements were performed at open circuit potential with a sinusoidal signal over a frequency range from 10 kHz to 100 mHz at an amplitude of 10 mV.
1 volume ratio, BASF, USA). Galvanostatic charge/discharge cycling was conducted in a multichannel battery testing system (LAND CT2001A). Cyclic voltammetry and electrochemical impedance spectroscopy (EIS) were carried out using a VersaSTAT4 from Princeton Applied Research. The EIS measurements were performed at open circuit potential with a sinusoidal signal over a frequency range from 10 kHz to 100 mHz at an amplitude of 10 mV.
Results and discussion
Material characterization
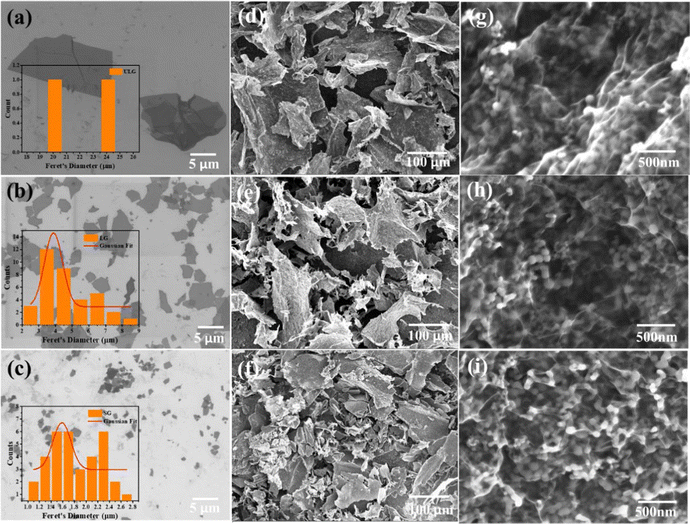
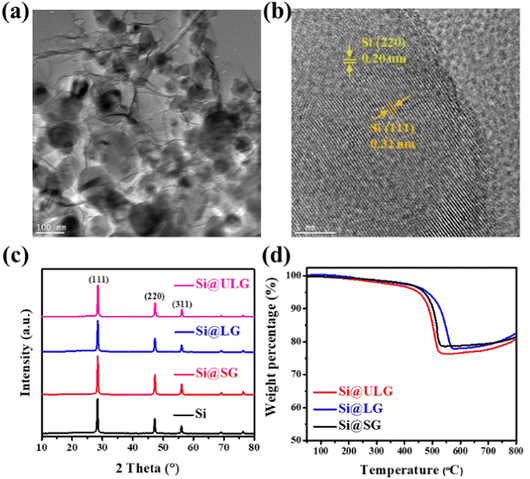
The GO sheets with different lateral sizes (e.g., ULGO, LGO, SGO) and their corresponding Si–graphene nanocomposites (e.g., Si@ULG, Si@LG, Si@SG) were compared by characterizing their morphological, structural, and electrochemical properties. The ULGO has a lateral size of over 20 μm (Fig. 2a), which is much larger than the LGO (∼3–5 μm in Fig. 2b) and SGO (∼1–2 μm in Fig. 2c). The uniformly distributed Si NPs were encapsulated by graphene sheets after freeze-drying and thermal reduction, which formed secondary plate structures with a typical size of 50–100 μm for all nanocomposite electrodes (Fig. 2d–f). All the composites presented extensive graphene wrinkling and sharp folds, which provided a large number of anchoring sites for Si NPs. By introducing PVP on the surface of the Si NPs, the aggregation of Si NPs was largely mitigated, with very few NPs exposed on the surface of the graphene sheets. The PVP modification induced strong affinity to GO, which is beneficial to bind Si NPs for the formation of a robust Si–graphene nanocomposite (Fig. 2g–i).31The as-prepared Si@ULG nanocomposite was dispersed in ethanol and sonicated for 20 min before conducting TEM analysis. Wrinkled graphene sheets and Si NPs can be observed (Fig. 3a). The high-resolution TEM image presented a clear lattice structure of the Si@ULG composite, indicating a high crystallinity (Fig. 3b). There are no obvious crystallites of SiOx confirmed by the X-ray diffraction patterns (Fig. 3c). All the nanocomposites illustrate the diffraction patterns of pristine Si phase. No pronounced peak at around 26° was detected, indicating non-stacking graphene sheets wrapped on the surface of Si NPs. Since the Si@ULG nanocomposites were prepared using the same amount of Si NPs and GO solution, the Si contents in these three nanocomposites are around 75–78 wt% (Fig. 3d).
Electrochemical performance of the Si–graphene nanocomposite anodes
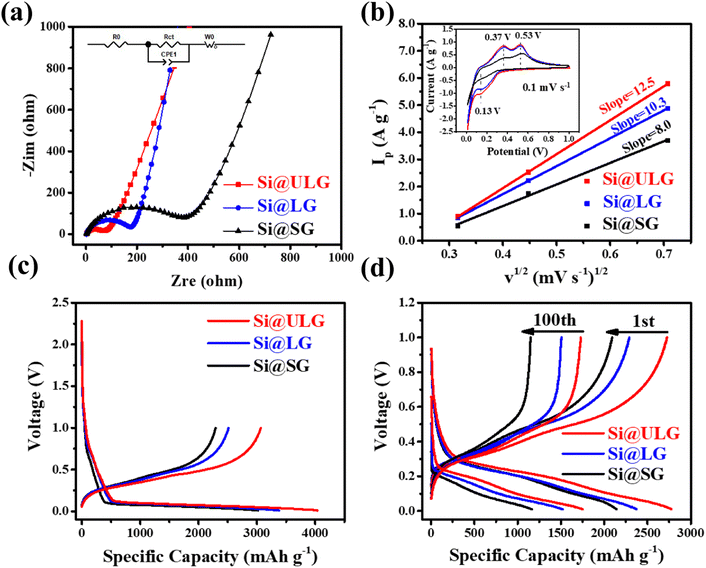
The Li-ion half cells using lithium metal as a counter electrode were constructed to evaluate the electrochemical performance of the as-prepared nanocomposite anodes. Electrochemical impedance spectroscopy (EIS) measurements were taken over a frequency range of 100 kHz–100 MHz. As can be seen in the Nyquist plot (Fig. 4a), the three impedance spectra have similar features: a medium-to-high-frequency depressed semicircle and a low-frequency linear tail, which are consistent with the previously reported impedance results on silicon anodes.32 The resistance parameters were obtained by fitting the experimental Nyquist plots using the equivalent circuit (Table S1, ESI†). According to the fitting (modeling) results, the diameter of the semicircle (Rct, charge transfer resistance) for the Si@ULG electrode is significantly smaller than that of the Si@LG and Si@SG electrodes, indicating much lower charge transfer impedance on the electrode/electrolyte interface. Additionally, it implies good affinity between ULG and Si NPs, which allows good accessibility of electrolytes to the active material. More importantly, unlike the case for the Si@LG and Si@SG electrodes, the large lateral size of the ULG graphene sheet in the Si@ULG electrode provides interconnected conductive pathways that significantly reduce the number of boundaries to further lower the contact resistance between graphene sheets. Cyclic voltammetry (CV) measurements were performed on the assembled Li-ion half cells at scan rates of 0.1, 0.2, and 0.5 mV s−1 in the potential window of 0.01–1.0 V versus Li/Li+. Based on the Randles–Sevcik equation for a semi-infinite diffusion of lithium ions, the diffusion kinetics can be derived from the CV test.33 | (1) |
The charge and discharge curves at different current densities are shown in Fig. 4c and d. The Si@ULG nanocomposite anode illustrates low overpotential and high specific charge/discharge capacity of 3066/4036 mA h g−1 at the 1st cycle (normalized by the total weight of Si–graphene nanocomposite) at C/20, which is much higher than that for Si@LG (2512/3382 mA h g−1) and Si@SG (2291/3021 mA h g−1) anodes (Fig. 4c and Fig. S2, ESI†). Increasing the current density to C/5, the nanocomposite anodes indicate capacity decays, and the Si@ULG nanocomposite exhibits lower overpotential and higher specific capacity than that for the Si@LG and Si@SG nanocomposite electrodes.
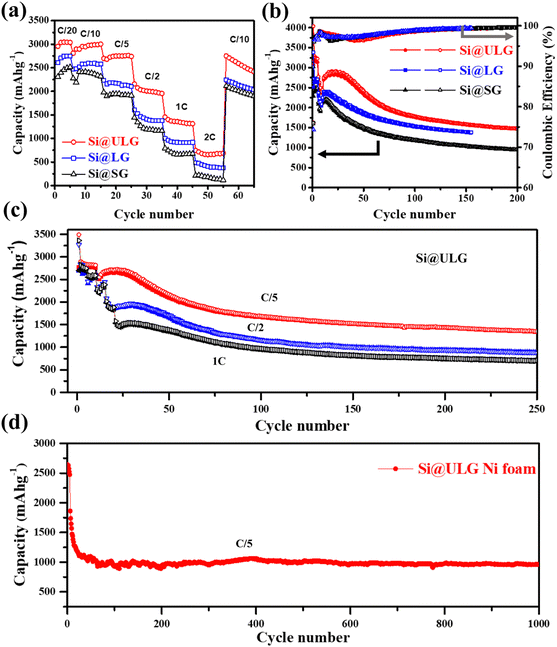
Furthermore, a comparison of the rate performance demonstrates that the discharge capacities of the Si@ULG nanocomposite electrode are 3044, 2979, 2751, 1999, 1343, and 661 mA h g−1 at 1/20, 1/10, 1/5, 1/2, 1, and 2C, respectively, which are much higher than those for the Si@LG and Si@SG nanocomposite electrodes. When the current rate went back to C/10, the specific capacity of the Si@ULG composite electrode was recovered to 2709 mA h g−1, proving the high structural stability of the electrode owing to the ultra-large-sized graphene sheets that effectively mitigate the volume changes of Si NPs during the charge/discharge process (Fig. 5a). Additionally, the graphene-wrapped Si NPs can also endow long cycling stability for over 200 cycles. The Si–graphene nanocomposite anodes were first activated for 5 cycles at a low current density of C/20 and then tested for 200 cycles at C/5. The CE of these nanocomposite anodes has a slight decline in the initial cycles and then goes up to around 99.4%, which corresponds to the formation of a gradually stabilized SEI layer at a low current rate (Fig. 5b). The CE rises over the early cycles were reported to be related to the electrochemical activation and side reaction from the electrolyte.34 As a result, the Si@ULG nanocomposite anode delivered a high capacity of 1478 mA h g−1 after 200 cycles at C/5 with an average capacity loss of 0.23% per cycle (Fig. 5b). Although possessing a similar nanocomposite architecture, the Si@LG and Si@SG nanocomposite electrodes delivered much lower capacity and larger capacity loss during cycling due to the less mechanical robustness for graphene networks consisting of smaller sized graphene sheets. To further evaluate the stability at higher C rates, the cycling performance for the Si@ULG composite anode was conducted at 1/5, 1/2, and 1C, delivering 1347, 885, and 700 mA h g−1 after 250 cycles, respectively (Fig. 5c). The excellent rate performance and prolonged cyclability of the graphene-wrapped Si NPs resulted from the highly conductive and mechanically robust graphene network to mitigate the pulverization and volume change of Si NPs. When replacing the spacer with Ni foam for the coin-cell assembly, the Si@ULG nanocomposite anode delivered a capacity of 1000 mA h g−1 for 1000 cycles at 1/5C (Fig. 5d). Thus, the graphene network consisting of ultra-large sized graphene sheets is able to effectively trap high weight percent Si NPs and buffer their accumulated large volume changes. Various percentages of the Si NPs in the ULG network were further studied to demonstrate the capability of ultra-large-sized graphene sheets to stabilize long-term cycling. By increasing the weight percentage of ULG from 25 to 30 wt%, the Si@ULG nanocomposite electrode with 30% graphene sheets delivered higher capacity retention after 150 cycles at C/5 than the Si@ULG electrode with less wrapped graphene (Fig. S3 and Table S2, ESI†). The higher percentage of graphene can more effectively stabilize the interface and mitigate the volume change, thus delivering higher capacity retention. In addition, the binders could cooperatively influence the electrode's integrity and stability. In the present work, a conventional PVDF binder, considered a poor affinity binder for silicon anodes,35 was also used to demonstrate the capability of tailored graphene size to stabilize Si NPs. Under the same operating conditions, the Si@ULG electrode with a PVDF binder delivered much higher capacity than that for Si@LG and Si@SG composite electrodes (Fig. S4, ESI†), indicating the excellent affinity and integrity of the ultra-large sized graphene sheets regardless of the binder-type used. To verify the size effect of graphene on the Si–graphene electrode, we conducted morphology characterization after cycling (Fig. S5, ESI†). The cycled electrodes (50 cycles, 0.2C) were disassembled and washed with diethyl carbonate solvent before capturing SEM images. Fig. S4 (ESI†) demonstrates that the Si@SG electrode exhibits severe fractures distributed throughout the electrode. In contrast, the Si@ULG electrode shows only slight fractures, indicating that the ultra-large graphene effectively buffers the volume change and prevents severe electrode fracture, unlike Si@SG and Si@LG.
Additionally, we performed EIS measurements on the three electrodes after cycling (Fig. S6a, ESI†). The results exhibit the joining of two compressed semicircles, indicating the formation of a solid electrolyte interface (RSEI) and the charge transfer resistance (Rct). Although the resistance difference between these electrodes decreases compared to newly assembled cells (Fig. 4a), it is evident that using larger graphene sheets to wrap the Si NPs results in lower resistance. To further examine any Si NP aggregation and the distribution of graphene sheets, we captured high-magnification images (Fig. S6b and c, ESI†) of the cycled Si@ULG electrode. These images reveal no significant aggregation of Si NPs and demonstrate that the Si NPs remain connected within the undulating graphene sheets after charge–discharge cycling. This indicates the excellent integrity of the Si–graphene composite structure.
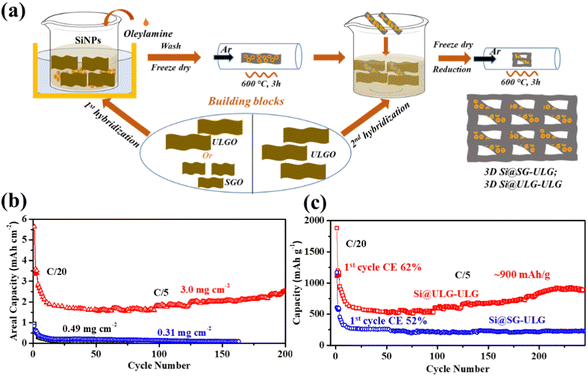
To confirm the graphene size effect on the electrochemical performance of the nanocomposite electrodes with increasing mass loading of Si active material, a two-step strategy was developed to fabricate binder-free three-dimensional (3D) freestanding Si–graphene nanocomposite electrodes (Fig. 6a). The Si NPs were uniformly decorated on the first portion of GO (∼6 wt% of the composite) in step one and then mixed with the second portion of GO (∼14 wt% of the composite) to form a 3D freestanding nanocomposite electrode. Small (SG) and ultra-large sized graphene sheets (ULG) were used to wrap Si NPs in the first hybridization step to compare the size effect. After the thermal reduction, the ultra-large sized graphene sheets (ULG) were mixed with the intermediate Si–graphene hybrids (Si@SG, Si@ULG) prepared in the first step for the further self-assembly in the second hybridization step. With the 3D hierarchical structure (Fig. S7, ESI†), our freestanding Si@ULG-ULG electrode with a high mass loading of 3 mg cm−2 delivered a high areal capacity of 2.1 mA h cm−2 at C/5 for 200 cycles (Fig. 6b), which is much higher than that for the slurry coating thin-film Si-based anodes (0.17, and 0.12 mA h cm−2) at low areal mass loading (0.31 and 0.49 mg cm−2). The 3D freestanding Si@ULG-ULG nanocomposite electrode using ultra-large graphene sheets delivered higher capacity (e.g., 800 vs. 200 mA h g−1) after 200 cycles and higher initial coulombic efficiency (e.g., 62% vs. 52% at C/5, and 77% vs. 51% at C/2) than those of the Si@SG-ULG nanocomposite electrodes (Fig. 6c and Fig. S8a, ESI†), indicating an excellent stability and charge transport kinetics promoted by the ultra-large graphene sheet building blocks. In addition, the remaining function groups in the reduced GO sheets and oxidized layers on Si NPs (e.g., SiOx) may also influence the electrochemical performance due to the tailored electrical conductivity and affinity (Fig. S8b, ESI†). In comparison to other Si/graphene nanocomposite electrodes reported in recent studies (Table S3, ESI†),36–42 our 3D composite electrode, Si@ULG-ULG, exhibits higher capacity retention at higher mass loading level. This observation highlights the potential of ultra large graphene as a promising scaffold for integrating with Si anodes, leading to enhanced stability during cycling performance.
Conclusions
In summary, we investigated the size effect of mechanically robust and highly conductive graphene sheets to effectively regulate the charge transport kinetics, volume change, first cycle coulombic efficiency, and stable solid-electrolyte-interphase for the improvement of electrochemical performance. Specifically, a general strategy for an optimized composite electrode design was developed to effectively stabilize the Si active material during charge–discharge cycling. As a result, the as-prepared Si NPs wrapped by ultra-large graphene sheets (ULG) exhibited a higher specific capacity of 1478 mA h g−1 at C/5 for 200 cycles, with a lower average capacity loss of 0.23% per cycle than those wrapped by small (SG) or large graphene sheets (LG). By further assembling ULG sheets as building blocks into a three-dimensional (3D) graphene framework to load a high weight percentage of Si materials, our freestanding 3D Si@ULG-ULG nanocomposite electrode with a high mass loading of 3 mg cm−2 is able to deliver a much higher areal capacity than the slurry coating thin-film Si-based anodes at low areal mass loading (0.31 and 0.49 mg cm−2). These findings provide new insights into improving the electrochemical performance of Si-based composite anodes for high-energy-density and long-cycle life Li-ion batteries.Author contributions
The manuscript was written through the contributions of all authors. All authors have given approval to the final version of the manuscript.Conflicts of interest
There are no conflicts to declare.References
- F. Wu, J. Maier and Y. Yu, Chem. Soc. Rev., 2020, 49, 1569–1614 RSC.
- D. H. S. Tan, Y.-T. Chen, H. Yang, W. Bao, B. Sreenarayanan, J.-M. Doux, W. Li, B. Lu, S.-Y. Ham, B. Sayahpour, J. Scharf, E. A. Wu, G. Deysher, H. E. Han, H. J. Hah, H. Jeong, J. B. Lee, Z. Chen and Y. S. Meng, Science, 2021, 373, 1494–1499 CrossRef CAS.
- G. G. Eshetu, H. Zhang, X. Judez, H. Adenusi, M. Armand, S. Passerini and E. Figgemeier, Nat. Commun., 2021, 12, 5459 CrossRef CAS PubMed.
- B. Nie, C. Zhou, M. Gao, D. He, Z. Yao, Y. Liu, X. Shen, X. Wang and H. Pan, J. Alloys Compds., 2019, 797, 1205–1215 CrossRef CAS.
- H. Sun, J. Zhu, D. Baumann, L. Peng, Y. Xu, I. Shakir, Y. Huang and X. Duan, Nat. Rev. Mater., 2019, 4, 45–60 CrossRef.
- Y. K. Jeong, W. Huang, R. A. Vilá, W. Huang, J. Wang, S. C. Kim, Y. S. Kim, J. Zhao and Y. Cui, Adv. Energy Mater., 2020, 10, 2002108 CrossRef CAS.
- C. Zhang, S.-H. Park, A. Seral-Ascaso, S. Barwich, N. McEvoy, C. S. Boland, J. N. Coleman, Y. Gogotsi and V. Nicolosi, Nat. Commun., 2019, 10, 849 CrossRef.
- F. Shi, Z. Song, P. N. Ross, G. A. Somorjai, R. O. Ritchie and K. Komvopoulos, Nat. Commun., 2016, 7, 11886 CrossRef CAS PubMed.
- P. Li, J.-Y. Hwang and Y.-K. Sun, ACS Nano, 2019, 13, 2624–2633 CAS.
- W. Huang, J. Wang, M. R. Braun, Z. Zhang, Y. Li, D. T. Boyle, P. C. McIntyre and Y. Cui, Matter, 2019, 1, 1232–1245 CrossRef.
- M.-J. Choi, Y. Xiao, J.-Y. Hwang, I. Belharouak and Y.-K. Sun, J. Power Sources, 2017, 348, 302–310 CrossRef CAS.
- J. Chen, X. Fan, Q. Li, H. Yang, M. R. Khoshi, Y. Xu, S. Hwang, L. Chen, X. Ji, C. Yang, H. He, C. Wang, E. Garfunkel, D. Su, O. Borodin and C. Wang, Nat. Energy, 2020, 5, 386–397 CrossRef CAS.
- S. Choi, T.-w Kwon, A. Coskun and J. W. Choi, Science, 2017, 357, 279–283 CrossRef CAS.
- H. Huang, H. Shi, P. Das, J. Qin, Y. Li, X. Wang, F. Su, P. Wen, S. Li, P. Lu, F. Liu, Y. Li, Y. Zhang, Y. Wang, Z.-S. Wu and H.-M. Cheng, Adv. Funct. Mater., 2020, 30, 1909035 CrossRef CAS.
- G. Xin, H. Sun, T. Hu, H. R. Fard, X. Sun, N. Koratkar, T. Borca-Tasciuc and J. Lian, Adv. Mater., 2014, 26, 4521–4526 CrossRef CAS PubMed.
- L. Ji, P. Meduri, V. Agubra, X. Xiao and M. Alcoutlabi, Adv. Energy Mater., 2016, 6, 1502159 CrossRef.
- H. T. Sun, L. Mei, J. F. Liang, Z. P. Zhao, C. Lee, H. L. Fei, M. N. Ding, J. Lau, M. F. Li, C. Wang, X. Xu, G. L. Hao, B. Papandrea, I. Shakir, B. Dunn, Y. Huang and X. F. Duan, Science, 2017, 356, 599–604 CrossRef CAS PubMed.
- I. Tantis, A. Bakandritsos, D. Zaoralová, M. Medveď, P. Jakubec, J. Havláková, R. Zbořil and M. Otyepka, Adv. Funct. Mater., 2021, 31, 2101326 CrossRef CAS.
- Y. Zhang, P. Chen, X. Gao, B. Wang, H. Liu, H. Wu, H. Liu and S. Dou, Adv. Funct. Mater., 2016, 26, 7754–7765 CrossRef CAS.
- R. Rojaee and R. Shahbazian-Yassar, ACS Nano, 2020, 14, 2628–2658 CrossRef CAS PubMed.
- H. S. Wang, Y. Z. Li, Y. B. Li, Y. Y. Liu, D. C. Lin, C. Zhu, G. X. Chen, A. K. Yang, K. Yan, H. Chen, Y. Y. Zhu, J. Li, J. Xie, J. W. Xu, Z. W. Zhang, R. Vila, A. Pei, K. C. Wang and Y. Cui, Nano Lett., 2019, 19, 1326–1335 CrossRef CAS.
- H. T. Sun, X. Sun, T. Hu, M. P. Yu, F. Y. Lu and J. Lian, J. Phys. Chem. C, 2014, 118, 2263–2272 CrossRef CAS.
- P. Sehrawat, A. Shabir, C. M. Julien and S. S. Islam, J. Power Sources, 2021, 501, 229709 CrossRef CAS.
- C. Huang, Z. Feng, F. Pei, A. Fu, B. Qu, X. Chen, X. Fang, H. Kang and J. Cui, ACS Appl. Mater. Interfaces, 2020, 12, 35532–35541 CrossRef CAS.
- H. Yue, Q. Li, D. Liu, X. Hou, S. Bai, S. Lin and D. He, J. Alloys Compd., 2018, 744, 243–251 CrossRef CAS.
- Y. Yang, S. Liu, Z. Dong, Z. Huang, C. Lu, Y. Wu, M. Gao, Y. Liu and H. Pan, Appl. Mater. Today, 2022, 26, 101403 CrossRef.
- C.-H. Jung, K.-H. Kim and S.-H. Hong, J. Mater. Chem. A, 2019, 7, 12763–12772 RSC.
- Y. Zhang, X. Xia, B. Liu, S. Deng, D. Xie, Q. Liu, Y. Wang, J. Wu, X. Wang and J. Tu, Adv. Energy Mater., 2019, 9, 1803342 CrossRef.
- Y. Cho, J. M. Kim, B. Yan, H. Hong and Y. Piao, J. Electroanal. Chem., 2020, 876, 114475 CrossRef CAS.
- C. Gao, L. Guan, Y. Shi, J. Zhou and R. Cai, Acta Mech., 2022, 233(12), 5265–5281 CrossRef.
- X. Liu, Y. Du, L. Hu, X. Zhou, Y. Li, Z. Dai and J. Bao, J. Phys. Chem. C, 2015, 119, 5848–5854 CrossRef CAS.
- J. Guo, A. Sun, X. Chen, C. Wang and A. Manivannan, Electrochim. Acta, 2011, 56, 3981–3987 CrossRef CAS.
- X. Gu, W. Tian, X. Tian, Y. Ding, X. Jia, L. Wang and Y. Qin, ACS Appl. Energy Mater., 2019, 2, 5124–5132 CrossRef CAS.
- M. Ko, S. Chae, S. Jeong, P. Oh and J. Cho, ACS Nano, 2014, 8, 8591–8599 CrossRef CAS PubMed.
- N. Liu, Z. Lu, J. Zhao, M. T. McDowell, H.-W. Lee, W. Zhao and Y. Cui, Nat. Nanotechnol., 2014, 9, 187–192 CrossRef CAS.
- S. L. Chou, J. Z. Wang, M. Choucair, H. K. Liu, J. A. Stride and S. X. Dou, Electrochem. Commun., 2010, 12, 303–306 CrossRef CAS.
- P. Nie, Z. Y. Le, G. Chen, D. Liu, X. Y. Liu, H. B. Wu, P. C. Xu, X. R. Li, F. Liu, L. M. Chang, X. G. Zhang and Y. F. Lu, Small, 2018, 14, 1800635 CrossRef.
- L. S. Jiao, J. Y. Liu, H. Y. Li, T. S. Wu, F. Li, H. Y. Wang and L. Niu, J. Power Sources, 2016, 315, 9–15 CrossRef CAS.
- X. Y. Han, D. L. Zhao, W. J. Meng, H. X. Yang, M. Zhao, Y. J. Duan and X. M. Tian, Appl. Surf. Sci., 2019, 484, 11–20 CrossRef CAS.
- H. Yue, Q. Li, D. Liu, X. Hou, S. Bai, S. Lin and D. He, J. Alloys Compd., 2018, 744, 243–251 CrossRef CAS.
- K. C. Wasalathilake, S. N. Hapuarachchi, Y. Zhao, J. F. Fernando, H. Chen, J. Y. Nerkar, D. Golberg, S. Zhang and C. Yan, ACS Appl. Energy Mater., 2019, 3, 521–531 CrossRef.
- M. Lockett, V. Sarmiento, M. Gonzalez, S. Ahn, J. Wang, P. Liu and O. Vazquez-Mena, ACS Appl. Energy Mater., 2021, 4, 6391–6398 CrossRef CAS.
Footnote |
| † Electronic supplementary information (ESI) available: The electrochemical impedance spectrum modeling results, cyclic voltammetry curves, supportive cycling performance and coulombic efficiency, alternative SEM images of the 3D composite structure, and the performance comparison of the assembly building blocks. See DOI: https://doi.org/10.1039/d3ya00203a |
| This journal is © The Royal Society of Chemistry 2023 |

