 Open Access Article
Creative Commons Attribution 3.0 Unported Licence
The rotating disc electrode: measurement protocols and reproducibility in the evaluation of catalysts for the oxygen evolution reaction†
Marc F.
Tesch
 *a,
Sebastian
Neugebauer
a,
Praveen V.
Narangoda
a,
Robert
Schlögl
ab and
Anna K.
Mechler
 *ac
*ac
aMax Planck Institute for Chemical Energy Conversion, Heterogeneous Reactions, Stiftstr. 34-36, 45470 Mülheim an der Ruhr, Germany. E-mail: marc.tesch@cec.mpg.de
bFritz Haber Institute of the Max Planck Society, Inorganic Chemistry, Faradayweg 4, 14195 Berlin, Germany
cRWTH Aachen University, Electrochemical Reaction Engineering (AVT.ERT), Forckenbeckstr. 51, 52074 Aachen, Germany. E-mail: anna.mechler@avt.rwth-aachen.de
First published on 19th September 2023
Abstract
A measurement protocol for the evaluation of catalyst inks for the oxygen evolution reaction via rotating disc electrode measurements was conceived and applied in a multi-partner project. It was found that the electrochemical performances determined for a standardized electrode based on nickel–cobalt–oxide in 1 M KOH show a spread in the range of 50 mV at 10 mA cm−2, when comparing results from different groups. The variation of results obtained within individual groups, on the other hand, were found to be significantly lower. From this finding, we argue that the characterization of catalyst inks via rotating disk electrode measurements is strongly affected by individual sample preparation and handling, leading to an additional uncertainty that depends on the individual experimenter. Consequently, the use of this technique for the evaluation and comparison of catalysts for the oxygen evolution reaction needs to be discussed and potentially revisited.
Introduction
The generation of hydrogen by water electrolysis is currently a key technology in sustainable energy scenarios.1–5 There are two main technologies for water electrolysis based on acidic and alkaline media.4,6–9 The latter is usually considered the more mature technique7 though the kinetics in acidic media are typically faster.10 Known catalysts in acidic conditions with suitable characteristics are based on expensive noble metals such as platinum or iridium, which makes this technology a costly endeavor. Catalysts that are based on earth-abundant transition metals are usually not stable in acidic media, but are applied in alkaline water electrolysis. Of the two water splitting half reactions, i.e. hydrogen evolution on the cathode and oxygen evolution on the anode, the latter is the kinetically more sluggish7 and consequently, being the limiting factor, the more intense studied half reaction. For alkaline electrolysis, a large variety of mostly Ni-based materials with further transition metals are investigated to improve the anode kinetics.11,12For the electrochemical characterization of new catalysts for OER, experiments in rotating disk electrode (RDE) configuration are frequently applied.13,14 The RDE is a well-established electrochemical technique, which is commercially available and of comparable low experimental complexity. Commonly, numerical values such as the so-called onset potential – i.e. the potential to reach a certain current density – are used to evaluate catalyst activity. The definition of an onset potential, however, is not uniformly defined, which can hamper the comparability of results obtained by different groups on different materials. To overcome this uncertainty in definition, some attempts at standardization and benchmarking of OER catalysts do exist.11,12,15–20 However, there is no universally accepted protocol to follow and to establish comparability. Further, RDE experiments are mostly limited to materials that can be electrodeposited on the support electrode or to powder samples. In particular for the latter, the preparation of the catalyst film is crucial and already minor experimental variations can have a strong influence on the experimental result of RDE measurements. In consequence, a meaningful comparison strongly dependents on using the same protocol and requires great experimental care.
It is the aim of this study to present an approach towards standardization of RDE experiments, and to discuss its limitations in terms of intra- and inter-lab reproducibility. This study was conceived within a multi-partner project that enabled the critical assessment of inter-lab reproducibility of RDE measurements. In this work, error sources in RDE experiments and electrode fabrication are identified and it is discussed how RDE experiments can be part of meaningful catalyst evaluation. It is advocated that results on catalyst inks obtained via RDE measurements have to be treated with caution and can only be the starting point of evaluation.
Results and discussion
The presented results were obtained within the multi-partner project MANGAN funded by the German Federal Ministry of Education and Research.21 A total of 25 research groups collaborated in the framework of this project, aiming for the investigation of the technical potential of manganese-based compounds as catalysts in electrochemical water splitting. To ensure the best possible comparability of electrocatalytic characterization, the project partners used identical electrochemical setups including the same model of potentiostat, same built of reference, working, and counter electrodes, and the same type of electrochemical cells (Fig. S1, ESI†). Several project partners were equipped with this standardized electrochemical equipment, received detailed protocols on electrode preparation, and measurement procedures. For the study presented herein, a commercial nickel–cobalt–oxide (Ni–Co–O) powder-based material of a single batch was distributed among the project partners as a reference catalyst. The benchmark electrodes were prepared by depositing 100 μg cm−2 Ni–Co–O on a glassy carbon support with Nafion® as binder (details in the Electrode Preparation section in the ESI†).The subsequent characterization followed a standardized protocol. Project visits by the project coordinator ensured that the protocol was properly followed at all laboratories.
Electrochemical standard protocol
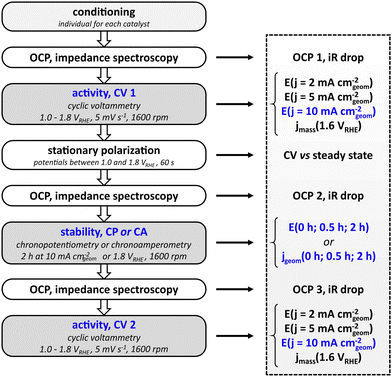
The standardized measurement protocol (Fig. 1) was conceived in a joint workshop and is based on existing attempts of standardization.11,12,15,17 It is intended to provide meaningful evaluation of the performance of electrocatalysts utilizing an RDE while being kept as simple as possible to allow for an easy application. The measurement protocol strings together a conditioning of the catalyst, activity measurement and stability measurements. All potentials are defined versus the reversible hydrogen electrode (RHE).The initial step of the protocol is a conditioning procedure. This should be chosen individually for each catalyst material, to ensure that the catalyst is in a stable and reproducible state. For the nickel–cobalt–oxide investigated in this study, the catalyst was conditioned by performing 50 cycles between 1.00 and 1.45 VRHE with a scan rate of 100 mV s−1 in stagnant electrolyte, leading to reproducible scans. The activity measurement after conditioning aims to determine the potential needed to reach a geometric current density of 10 mA cm−2, which is used as key performance indicator. To this end, a cyclic potential sweep is applied, starting at 1.00 VRHE and reversing the scan direction upon reaching the defined current density. In any case, the scan is reversed at 1.80 VRHE to avoid damaging the catalyst by applying excessive potentials. Scans are performed at a rotation speed of 1600 rpm. To cross-check whether cyclic voltammetry represents steady-state behavior, CV is followed by a stationary polarization measurement. For this, the potential of the electrode is held for 60 s at 1.00, 1.25, 1.50, 1.55, 1.60, 1.65, 1.70, 1.75, and 1.80 VRHE, respectively, while the electrode rotates at 1600 rpm. To prevent additional stress to the catalysts by sudden potential changes, the potential is swept from each value to the next with a scan rate of 5 mV s−1. Subsequent to the initial activity measurement, the protocol allows for two types of stability tests: chronopotentiometry or chronoamperometry. For the former, the current is ramped up to 10 mA cm−2 (geometric area), for the latter the potential is ramped up from open circuit potential to 1.80 VRHE. The chosen stability test is carried out for two hours at a rotation rate of 1600 rpm. The cell is switched off after the stability test and the setup is allowed to equilibrate over a period of 600 s during which the OCP is measured. Finally, another cyclic voltammogram as described above is measured to probe the activity after the stability test. To be able to compensate for the Ohmic drop, each activity and stability measurement is preceded by a measurement of the open circuit potential and electrochemical impedance spectroscopy at open circuit potential. In general, the protocol avoids large potential steps to prevent damage or uncontrolled changes of the catalyst. Instead, potentials are swept slowly e.g. from OCP to the starting potential for cyclic voltammetry.
To be able to compare different catalysts quantitatively, a series of key performance indicators (KPI) were defined. The main parameter for the evaluation of the activity of the catalyst was chosen to be the potential that is needed to drive a geometric current density of 10 mA cm−2. In addition, the potentials needed to drive geometric current densities of 2 mA cm−2 and 5 mA cm−2 are also included as indicators for the catalytic performance. The full list of KPI is presented in Fig. 1. To retain a simple protocol application, the normalization of the current is done with respect to the geometric area of the supporting electrode. It has to be noted that the normalization to the geometric area is not an accurate representation of the actual electrochemically active surface area (ECSA) if the surface is not flat on an atomic level. However, it is sufficient to screen catalysts of similar nature (e.g. metallic or oxidic), morphology, and loading in a first attempt. There is no universal approach for the determination of the ECSA,22,23 and electrochemical methods to determine the ECSA on metal oxides have limited accuracy.24,25 In order to add another measure for the electrocatalytic activity, mass activity jmass (current per mass of catalyst) at 1.60 VRHE can be used to complement the performance evaluation by geometric current density.
The parameters for evaluating the stability are either the potentials for chronopotentiometry at 10 mA cm−2 or the geometric current densities for chronoamperometry at 1.8 VRHE recorded at 0, 1800, and 7200 seconds of the stability test (0, 0.5, and 2 hours). It has to be noted that both the rather short stability as well as the moderate current density of 10 mA cm−2 do not serve to evaluate catalyst at a technical scale where an electrode has to last for tens of thousands of hours at current densities in the range of 1000 mA cm−2. Nevertheless, the chosen parameters facilitate catalyst screening and comparison to performance values reported in literature and can serve as a benchmark to clear for a catalyst that will justify further studies.
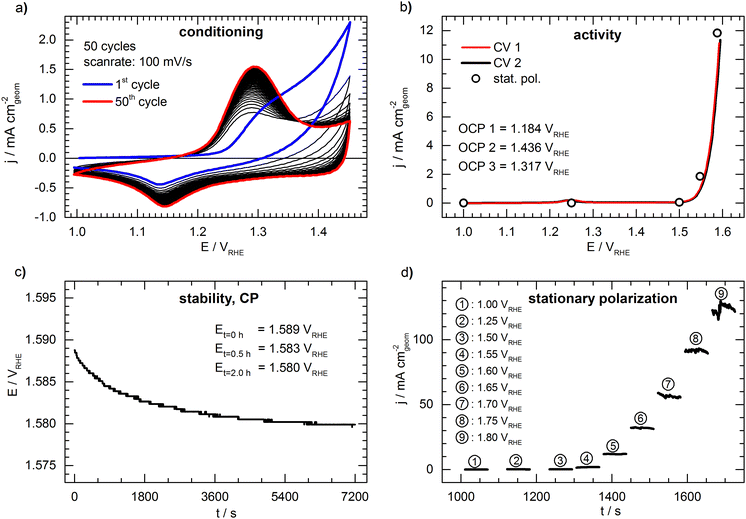
Fig. 2 shows a representative set of measurements of the conceived benchmark electrode. The conditioning of the catalyst by cycling the potential is shown in Fig. 2a. During cycling, an increasing oxidation peak at ca. 1.30 VRHE can be observed, which is associated with the formation of a NiOOH phase26 and shows no significant further growth after the 50th cycle. The first cyclic voltammogram (“CV 1”) is presented in Fig. 2b, showing the typical response of an OER catalyst (only forward scan is shown for clarity, full CVs are shown in Fig. S2, ESI†). The potential needed to drive a geometric current density of 10 mA cm−2 (E10) is 1.590 VRHE. The open circles in Fig. 2b represent the last data point taken from the 60s of stationary polarization at each potential. The values deviate only by ca. 5 mV from the cyclic voltammetry, indicating that the CV experiment is a sufficient representation of the steady state. During the potentiometric stability measurement (Fig. 2c) at a constant current density of 10 mA cm−2 the potential drops from 1.589 VRHE to 1.580 VRHE indicating a slight activation of the catalyst during the 2 hours lasting measurement. However, the deviation between the cyclic voltammograms before and after the stability test (“CV 1” and “CV 2” in Fig. 2b) is negligible. Fig. 2d shows detailed results of the stationary polarization measurement. As expected, the fluctuations are increased when recording at higher current density due to intensified bubble formation, rendering the determination of the respective values as more prone to error.
Reproducibility evaluation
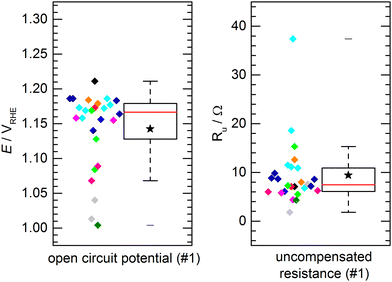
The aforementioned benchmark electrodes were prepared after the very same procedure and measured by 11 project partners at different institutions. The preparation procedure is described in detail in the Electrode Preparation section in the ESI.† All presented results did comply with the self-imposed standard requirements, i.e. using the same chemicals, identical instrumentation and follow-up by the project coordination whether the experimental procedure would comply with the protocols. No obvious deviation from the standardized procedure was observed.Fig. 3 shows the results of the determined open circuit potential (OCP) and uncompensated resistance (Ru) after conditioning of the catalyst. The individual data points, color-coded by institution/experimenter, are complemented by a box plot representation of the data distribution with the solid box marking the range in which the middle 50% of the data points (the interquartile range, IQR) are found. The solid red line through the box represents the median, the star represents the numerical average and the whiskers represent the lowest/highest value that can be found outside the IQR but within a range of 1.5 times the IQR. For the OCP (Fig. 3a), 50% of the measured potentials can be found within a range of 51 mV with the median being 1.167 VRHE and the average value being 1.143 VRHE. A clear clustering of data points within a few 10 mV around the median can be observed. However, some outliers were found. These outliers are not occurring symmetrically with regard to the data cluster, but mostly showing a lower open circuit potential. The measurements were performed in air-saturated electrolyte without additional purging during the experiments. Deviations in OCP are not unusual in unpurged solutions, as changes in the oxygen content or also temperature variations can have a significant impact. A similar observation is made for the uncompensated resistance (Fig. 3b). For Ru 50% of the values can be found within a range of 4.8 Ω, with a median of 7.5 Ω and an average of 9.4 Ω. Again, most values can be found close to the median, while few outliers show a notably higher resistance. This might be due to variations in the electrical connection inside the custom-made electrode holders. Importantly, when comparing the activity values, as discussed later, this did not have a negative influence on the activity. This shows that the determination of the iR drop and its compensation is important for comparable measurements. Notably, the outliers for OCP and Ru are not assigned to the same samples. For both, OCP and Ru, the average values are clearly influenced by these outliers and should not be used to define an “expected value”, which is better represented by the median.
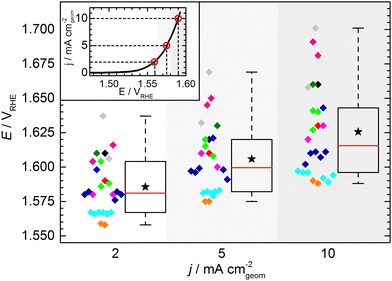
The KPI for the initial activity (“CV 1”) of the reference catalyst, determined by the 11 laboratories/experimenters, are represented in Fig. 4. The inset illustrates how the indicators for the catalytic activity are obtained, namely by determining the potential needed to drive geometric current densities of 2, 5, and 10 mA cm−2. The KPI for the activity at the three chosen current densities are presented in the same box plot format as used for the OCP and Ru. For clarity, a horizontal spread of the data points is applied as well as a background shading to visually separate the data sets for three current densities. The median KPI values are 1.581, 1.600, and 1.616 VRHE, whereas the arithmetic mean gives slightly higher values of 1.586, 1.606, and 1.626 VRHE at 2, 5, and 10 mA cm−2, respectively. Interestingly, the data points do not show an obvious clustering as observed in the OCP and Ru measurement results, i.e. the data is spread more homogeneously across the full data range. The range in which the individual values can be found is several ten mV, which is unexpectedly high. Even when only considering the IQR, the data range covers nearly 40 mV at 2 and 5 mA cm−2, and nearly 50 mV at 10 mA cm−2. The box plot statistics are shown in Table 1. It is noteworthy that the five electrodes with lowest OCP (indicated in grey, magenta, and dark green) show a tendency towards needing higher potentials to drive the respective current densities. This trend, however, is not reflected in the other electrodes. Further, no correlation to the uncompensated resistance can be found, as is most obvious when focusing on the data points indicated in cyan.
| Potential (vs. RHE) at | 2 mA cm−2 | 5 mA cm−2 | 10 mA cm−2 |
|---|---|---|---|
| Minimum | 1.558 | 1.575 | 1.588 |
| 25th percentile | 1.567 | 1.582 | 1.596 |
| Median | 1.581 | 1.600 | 1.616 |
| 75th percentile | 1.604 | 1.620 | 1.643 |
| Maximum | 1.637 | 1.669 | 1.701 |
| Numerical average | 1.586 | 1.606 | 1.626 |
| IQR (middle 50%) | 0.037 | 0.038 | 0.047 |
| Full data range | 0.079 | 0.094 | 0.113 |
At this point, one might argue that in some cases sample preparation was not ideal and that some potentials determined for this material are “obviously too high”, so one should concentrate only on the samples with better performance when determining the KPI for catalytic activity. This conclusion, however, can only be drawn when having the full picture based on results across a variety of experimental groups, which is usually not the case in conventional studies, since the characterization of a new catalyst is mostly conducted in a single lab and by a single experimenter. In fact, when focusing solely onto results obtained by a single experimenter the data spread occurs to be significantly lower (Fig. 5). For the data obtained by a single experimenter, in all except one case, the spread is below 15 mV at 10 mA cm−2, which is ca. 8 times lower compared of the total spread of the overall data set. Importantly, this means, although the experiments conducted in a single lab shows a reasonable reproducibility, the obtained KPI might differ from values obtained by other experimenters by several 10 mV.
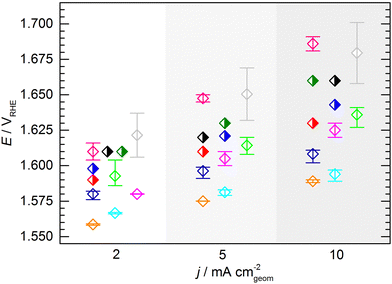 | ||
| Fig. 5 Average KPI obtained by the individual experimenters (open symbols, same color code used as in Fig. 3 and 4). The error bars indicate the full range of the potentials to reach the respective current densities across all measurements performed by an individual experimenter. In case of the half filled symbols only a single data point was provided. | ||
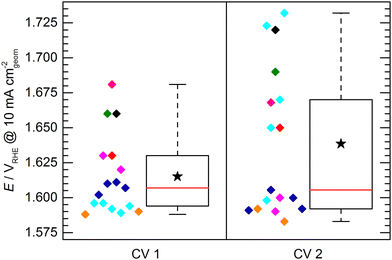
Fig. 6 shows the potential to reach 10 mA cm−2 obtained in the initial activity measurement (CV 1) compared to the second activity measurement conducted directly after the 2 h stability test (CV 2). It has to be noted that not all of the evaluated electrodes endured the stability test or were measured for CV 2. For clarity, the data of those electrodes is also omitted in the presentation of CV1 in Fig. 6. Due to this reduced dataset, the statistics of the box plot representation for CV 1 slightly differs from the box plot shown in Fig. 4, however, the general data distribution is not significantly affected. It can be observed that the spread of data points determined by CV 2 is increased with respect to CV 1, showing a difference between the determined maximum and minimum potential to reach 10 mA cm−2 of ca. 150 mV and an IQR of ca. 80 mV. This increase can be explained by differences in electrode stability. While some electrodes maintained or even increased their activity, other showed a strong performance decrease.
This leads to another interesting observation: The data of CV 2 can be divided into two groups. One group clusters around a value of ca. 1.595 VRHE with a relatively narrow spread of ca. 20 mV. The other group of data points can be found at significantly higher potentials (>1.65 VRHE) spreading over a potential range of ca. 80 mV. A reasonable assumption representing the KPI for a stable electrode would be therefore 1.595 ± 0.010 VRHE to reach a geometric current density of 10 mA cm−2. It has to be mentioned here, that the chosen mode for the stability test was chronopotentiometry in all cases except for the sample group depicted in cyan, which was measured in chronoamperometry at 1.8 VRHE. This harsher condition most likely lead to a faster sample degradation/deactivation. However, neither the mode of stability test nor the initial performance of the samples in CV 1 can be unambiguously correlated to a deactivation or activation behavior of the electrodes.
Discussion on the limits of RDE
In the following, we discuss some possible sources for the observed data spread and the ensuing consequences for the applicability of the RDE technique. The most obvious source of deviation in the described procedure stems from the drop casting process used in electrode fabrication. Although, the preparation follows a protocol, the reproducibility of hand-cast drop coated layers is limited, e.g. with respect to flawless coverage of the electrode substrate. Small volume deviations when pipetting small amounts of ink (2.5 μL in the measurements presented above) will be another source of error and the accuracy will depend strongly on the experimenter. The film formation on the electrode might also depend on small variations in humidity and temperature. Further, the dispersion of the catalyst might look homogeneous on the macroscopic scale but can in fact be inhomogeneous on a microscopic scale. In the end, it is a subjective choice, if the fabricated catalyst film looks “homogeneous enough” and is considered suitable for subsequent characterization. However, the influence of these factors has not been studied systematically, yet, and it is worth considering optimizing the ink composition and coating process in terms of smooth film formation prior to the electrochemical characterization of a new material (cf. Electrode Preparation section in the ESI† and Fig. S3, ESI†). Another source of error can originate from the electrolyte. Although the KOH used in the experiments had identical specifications and was purchased from a single supplier, batch-to-batch variations in impurity concentrations might also have an effect on the characterization, in particular when considering the effect of Fe impurities e.g. on Ni and Co based catalysts for OER.27,28 Further, slight potential shifts of the individually used reference electrodes in the range of ±5 mV can contribute to the observed variations, however, will not explain the observed strong deviations in the results with a total spread >100 mV.The points listed above might trigger the argument that the spread we observed in our data originates from the experimenters and lack of control in the micro-environment. Thus, additional training and more control of the environment can potentially narrow the spread in the data. Indeed this might be the case, however, we argue that the spread we observe is a realistic measure of the reproducibility achievable with the rotating disk electrode when different experimenters follow this kind of protocol. We thus identify the electrode preparation and individual sample handling as critical parameter for reproducibility. The small sample amount used in a typical RDE experiment will inevitably cause some variations in the electrochemical response as a real-world sample based on an ink will not be completely homogeneous. When relatively large film thicknesses introduce a level of porosity, mass transport phenomena will start playing a role as well as local depletion of reactants and blocking of pores and channels by gas bubbles.29 In summary, slight differences in loading, film homogeneity, and structure or variations in electrolyte purity will introduce a level of unpredictability leading to variations in the observed electrochemical response. A detailed study about the influence of further parameters, such as variation in loading, gas saturation, or the impact of impurities can be found elsewhere.30
Conclusions
In this study two levels of reproducibly were observed. The measurements conducted by a single experimenter resulted in a reasonable reproducibility of KPI in the range of several mV. This rather good reproducibility within each laboratory shows that the individual measurements were conducted adequately. On the other hand, it was shown that the electrodes that were prepared and measured by different personnel in different laboratories do not yield the same electrochemical response and performance indicators. Here the differences in KPI were found to be up to several 10 mV.Therefore, this study shows that the reproducibility by a single experimenter is superior to the inter-lab reproducibility. The latter, however, is the actual meaning of reproducibility within a scientific community. The much larger spread of KPI in between individual laboratories and experimenters show that RDE is prone on the influence of small (protocol-independent) variations in sample preparation and experiment execution. This renders the use of RDE as a tool for precise sample characterization critical. At this point, it should be emphasized again that the measurement protocol (using identical chemicals, equipment, and the very same batch of the benchmark catalyst) was introduced to and strictly followed by all project partners. Thus representing a level of experimental repetition in this study that actually exceeds approaches when reproducing an experiment from literature, where even more factors such as different equipment and batches/purities of chemicals may play a role.
The discrepancy of the intra-lab- vs. inter-lab-reproducibility underlines the need of a robust standardized procedure when determining the KPI of a powder catalyst by RDE, ideally accompanied by the use of a benchmark material to which new materials can be compared to. Moreover, this study shows the advantage of round robin tests to provide a full picture about the applicability of a measurement protocol and to determine possible weak-points. It has to be mentioned that this discrepancy in inter- vs. intra-lab reproducibility, is not restricted to the characterization of OER catalysts by RDE, but also occurs with other electrochemical techniques.31
In summary, the RDE technique is not per se insufficient for material characterization. The key point in our argumentation is that there is an experimenter-dependent uncertainty in rotating disk electrode measurements on powder OER catalysts, which needs to be known and taken into account when comparing results of different groups. The rotating disk electrode is still a useful technique to start the analysis of novel electrocatalysts for OER, e.g. picking promising candidates from a library of compounds. It is, however, not the proper tool to determine the “best catalyst” by comparing RDE data from different laboratories alone. The RDE technique should always be complemented with other analytical techniques such as microscopy or spectroscopy to obtain a comprehensive picture of the material under study. Further, a comparison to a standard catalyst as it is e.g. done in studies of the oxygen reduction reaction (ORR) will be another way to improve the comparability of data. In any case, a robust protocol leaving as little as possible space for experimental deviations and a standardized definition of key performance indicators is highly recommended.
Author contributions
MFT analyzed the data and co-wrote the paper. SN supervised the experiments, analyzed the data, and co-wrote the paper. PVN performed experiments and contributed to the manuscript preparation. RS conceived and directed the project. AKM analyzed the data and co-wrote the paper.Conflicts of interest
There are no conflicts to declare.Acknowledgements
All partner of the MANGAN project are highly acknowledged for discussions to conceive the standardized measurement procedure. The partner groups of Matthias Drieß (TU Berlin, Prasanth Menezes, Johannes Pfrommer, and Carsten Walter), Thorsten Glaser (Universität Bielefeld, Yvonne Lippert and Janine Parthier), Philipp Kurz (Albert-Ludwigs-Universität Freiburg, Jonas Ohms), Karsten Meyer (Friedrich-Alexander-Universität Erlangen-Nürnberg, Andreas Scheurer and Lianpeng Tong), Martin Muhler (Ruhr-Universität Bochum, Wei Xia), Regina Palkovits (RWTH Aachen, Cornelia Broicher and Stefan Palkovits), Wolfgang Schuhmann (Ruhr-Universität Bochum, Justus Masa and Dulce Morales-Hernandez), and Siegfried Waldvogel (Johannes Gutenberg Universität Mainz, Christoph Gütz) are acknowledged for contributing data. The German Federal Ministry of Education and Research (BMBF) is acknowledged for providing generous funding within the framework of MANGAN (FKZ 03EK3545). Open Access funding provided by the Max Planck Society.References
- J. O. M. Bockris, Int. J. Hydrogen Energy, 2013, 38, 2579–2588 CrossRef CAS.
- R. Schlögl, ChemSusChem, 2010, 3, 209–222 CrossRef PubMed.
- I. Katsounaros, S. Cherevko, A. R. Zeradjanin and K. J. J. Mayrhofer, Angew. Chem., Int. Ed., 2014, 53, 102–121 CrossRef CAS PubMed.
- L. M. Gandia, G. Arzamedi and P. M. Dieguez, Renewable Hydrogen Technologies: Production, Purification, Storage, Applications and Safety, Newnes, 2013 Search PubMed.
- J. A. Turner, Science, 2004, 305, 972–974 CrossRef CAS PubMed.
- M. Carmo, D. L. Fritz, J. Mergel and D. Stolten, Int. J. Hydrogen Energy, 2013, 38, 4901–4934 CrossRef CAS.
- F. L. Formal, W. S. Bourée, M. S. Prévot and K. Sivula, CHIMIA Int. J. Chem., 2015, 69, 789–798 CrossRef PubMed.
- J. D. Holladay, J. Hu, D. L. King and Y. Wang, Catal. Today, 2009, 139, 244–260 CrossRef CAS.
- K. Zeng and D. Zhang, Prog. Energy Combust. Sci., 2010, 36, 307–326 CrossRef CAS.
- M. T. M. Koper, Nat. Chem., 2013, 5, 255–256 CrossRef CAS PubMed.
- C. C. L. McCrory, S. Jung, J. C. Peters and T. F. Jaramillo, J. Am. Chem. Soc., 2013, 135, 16977–16987 CrossRef CAS PubMed.
- C. C. L. McCrory, S. Jung, I. M. Ferrer, S. M. Chatman, J. C. Peters and T. F. Jaramillo, J. Am. Chem. Soc., 2015, 137, 4347–4357 CrossRef CAS PubMed.
- F. Opekar and P. Beran, J. Electroanal. Chem. Interfacial Electrochem., 1976, 69, 1–105 CrossRef CAS.
- S. Bruckenstein and B. Miller, Acc. Chem. Res., 1977, 10, 54–61 CrossRef CAS.
- S. Jung, C. C. L. McCrory, I. M. Ferrer, J. C. Peters and T. F. Jaramillo, J. Mater. Chem. A, 2016, 4, 3068–3076 RSC.
- V. Čolić, J. Tymoczko, A. Maljusch, A. Ganassin, W. Schuhmann and A. S. Bandarenka, ChemElectroChem, 2015, 2, 143–149 CrossRef.
- A. Maljusch, O. Conradi, S. Hoch, M. Blug and W. Schuhmann, Anal. Chem., 2016, 88, 7597–7602 CrossRef CAS PubMed.
- X. Cheng, E. Fabbri, M. Nachtegaal, I. E. Castelli, M. El Kazzi, R. Haumont, N. Marzari and T. J. Schmidt, Chem. Mater., 2015, 27, 7662–7672 CrossRef CAS.
- G. Li, L. Anderson, Y. Chen, M. Pan and P.-Y. A. Chuang, Sustainable Energy Fuels, 2017, 2, 237–251 RSC.
- C. Wei, R. R. Rao, J. Peng, B. Huang, I. E. L. Stephens, M. Risch, Z. J. Xu and Y. Shao-Horn, Adv. Mater., 2019, 31, 1806296 CrossRef PubMed.
- BMBF Cluster Project: MANGAN, https://mangan.cec.mpg.de/.
- S. Trasatti and O. A. Petrii, Pure Appl. Chem., 1991, 63, 711–734 CrossRef CAS.
- G. Jarzabek and Z. Borkowska, Electrochim. Acta, 1997, 42, 2915–2918 CrossRef CAS.
- P. Connor, J. Schuch, B. Kaiser and W. Jaegermann, Z. Phys. Chem., 2020, 234, 979–994 CrossRef CAS.
- C. Wei, S. Sun, D. Mandler, X. Wang, S. Z. Qiao and Z. J. Xu, Chem. Soc. Rev., 2019, 48, 2518–2534 RSC.
- K. P. Ta and J. Newman, J. Electrochem. Soc., 1998, 145, 3860 CrossRef CAS.
- I. Spanos, M. F. Tesch, M. Yu, H. Tüysüz, J. Zhang, X. Feng, K. Müllen, R. Schlögl and A. K. Mechler, ACS Catal., 2019, 9, 8165–8170 CrossRef CAS.
- I. Spanos, J. Masa, A. Zeradjanin and R. Schlögl, Catal. Lett., 2021, 151, 1843–1856 CrossRef CAS.
- H. A. El-Sayed, A. Weiß, L. F. Olbrich, G. P. Putro and H. A. Gasteiger, J. Electrochem. Soc., 2019, 166, F458 CrossRef CAS.
- S. Bhandari, P. V. Narangoda, S. O. Mogensen, M. F. Tesch and A. K. Mechler, ChemElectroChem, 2022, 9, e202200479 CrossRef CAS.
- G. Bender, M. Carmo, T. Smolinka, A. Gago, N. Danilovic, M. Mueller, F. Ganci, A. Fallisch, P. Lettenmeier, K. A. Friedrich, K. Ayers, B. Pivovar, J. Mergel and D. Stolten, Int. J. Hydrogen Energy, 2019, 44, 9174–9187 CrossRef CAS.
Footnote |
| † Electronic supplementary information (ESI) available. See DOI: https://doi.org/10.1039/d3ya00340j |
| This journal is © The Royal Society of Chemistry 2023 |

