 Open Access Article
Zwitterionic oligomers of 3-aminobenzoic acid on screen-printed electrodes: structure, properties and forensic application†
Tatiana V.
Shishkanova
 a,
Eva
Pospíšilová
 *a,
Miroslava
Trchová
 b and
Gabriela
Broncová
 a
a
aDepartment of Analytical Chemistry, University of Chemistry and Technology Prague, Technická 5, 16628 Prague 6, Czech Republic. E-mail: eva.pospisilovavscht.cz
bCentral Laboratory, University of Chemistry and Technology Prague, Technická 5, 16628 Prague 6, Czech Republic
First published on 11th January 2024
Abstract
The popularity and rapid spread of new psychoactive substances is why there is an urgent need for their fast monitoring in saliva in the field with electrodes modified with a selective receptor. Oligomers of electrochemically oxidized 3-aminobenzoic acid that are deposited on the surface of a graphite screen-printed electrode (o-3ABA/G/SPE) is proposed as a selector for the analyte of forensic interest. The oligomeric structure and existence of the zwitterionic form of o-3ABA on the G/SPE surface was confirmed using scanning electron microscopy, Raman spectroscopy and cyclic voltammetry techniques. The equilibrium adsorption constants between o-3ABA and 2-aminoindane (primary amine: Kads(2-AI) = 5.31 × 10⁴) and selected synthetic cathinones (secondary amine: Kads(butylone) = 6.12 × 10⁵, tertiary amines: Kads(MDPV) = 3.41 × 10⁴ and Kads(naphyrone) = 1.01 × 10⁴) were estimated using the electrochemical impedance spectroscopy (EIS) technique. The EIS technique was applied for determining a 1.0 μM concentration of 2-AI (RSD 3.5–4.0%) and butylone (RSD 4.9–6.4%) in the model and oral fluid samples.
Introduction
New psychoactive substances (NPSs) are a complex group of analytes that mimic the effects of known drugs and are often considered ‘legal’ alternatives. Their growing popularity and rapid spread are reasons for alarm.1 For example, the stimulating effects of synthetic cathinones (SCs), one of the largest group of NPSs, can be quickly replaced by adverse side effects such as severe anxiety, paranoia, and psychosis.2 Between 2019 and 2022, 29 new synthetic cathinones were detected for the very first time.3 Another group of NPSs – aminoindanes – became popular when mephedrone (a class of SCs) was added to the list of controlled substances in the United Kingdom.4 The effects of aminoindanes have not been sufficiently studied, and therefore pose a great risk to human health. Hence, there is a need for fast and reliable methods for monitoring NPSs, regardless of the sample matrix. Currently, chromatographic methods are often used for a definitive identification of SCs in forensic laboratories.5 While these methods are sensitive and reliable, they also come with several drawbacks, including long analysis times, the need for expensive equipment, and/or complicated sample preparation. It is important to develop a preliminary identification of SCs using screening tests, in which electrochemical sensors could be an alternative to colorimetric tests.So far, a number of articles have been published on the detection of NPSs.6,7Table 1 presents the progress in the use of electrochemistry for the detection of SCs. Although the use of potentiometry with ion-selective electrodes has been reported,8–10 most of the electrochemical methods used in these studies were voltammetric methods based on the use of different unmodified and modified electrodes.5,11–22 The use of unmodified working electrodes often leads to overlapping signals of structural analogues, and therefore limits the selectivity of voltammetric detection. Modification of the electrode surface with a selective receptor, nanoparticles or a polymeric film, is a way to improve the electrochemical signal of individual SCs and to achieve their selective determination. There is indeed an improvement in the limit of detection (LOD) achieved by using modification either with enzymes,16 aptamers,15 or nanoparticles21 (Table 1). Molecular imprinted polymers have gained popularity over the last two decades for the determination of SCs.13,14,23 Moreover, the selectivity of the modified electrodes enables their applicability in biological samples (blood serum,14 plasma, urine13,21 and oral fluids9). Additionally, electrochemically synthesized polymers with recognition sites have contributed to the development of electrochemical sensors that have found various applications.24 Xu et al. applied a poly(para-aminobenzoic acid) (PABA) electrochemically modified glassy carbon electrode coupled with high-performance liquid chromatography to detect dopamine (DA) in a rat brain dialysate.25 The PABA-modified electrode exhibited excellent catalysis of the electrochemical oxidation of dopamine. Pandey et al. utilized electrochemically synthesized poly(indole-6-carboxylic acid) (PICA) for the selective oxidation of DA.26 With a PICA-modified glassy carbon electrode, the permselectivity for the cations of DA was attributed to the presence of –COOH groups in the polymer backbone. Mahalakshmi and Sridevi prepared a composite of polyaniline (PANI) with Au nanoparticles (AuNPs) on a glassy carbon electrode and so improved its selectivity for DA, applying electrocatalysis simultaneously with the π–π interactions.27
| Method | Electrode | Analyte | LR, μM | LOD, μM | Real sample | Ref. |
|---|---|---|---|---|---|---|
| a Cl-PVC was tested in oral fluid, but its detection was affected by oral fluid interferents. Methods – AdSDPV: adsorptive stripping different pulse voltammetry. SWV: square-wave voltammetry. CV: cyclic voltammetry. Pot: potentiometry. Electrodes – G/SPE: graphite screen-printed electrode. C/SPE: carbon screen-printed electrode. GCE: glassy carbon electrode. BDD/SPE: boron-doped diamond screen-printed electrodes. BDDE: boron-doped diamond electrode. CPE: constant phase element. CNF/SPE: carbon nanofiber screen-printed electrodes. GP/SPE: graphene screen-printed electrodes. ISE: ion-selective electrode. Modification – MIP: molecularly imprinted polymer. AgNPS@Sa: silver nanoparticles capped with saffron. CYP2D6/C/SPE: carbon screen-printed electrodes modified with CYP2D6 enzyme. Analytes – 4-MMC: mephedrone. 4-MEC: 4-methylethcathinone. MDPV: 3,4-methylenedioxypyrovalerone. NEP: N-ethylpentylone. MDPT: 3′,4′-methylenedioxy-N-tert-butylcathinone. α-PVP: 4-chloro-alpha-pyrrolidinovalerophenone. MABP: buphedrone. | ||||||
| Unmodified electrodes | ||||||
| CV | G/SPE | 4-MMC | 0–935 | 55.2 | Seized samples | 17 |
| CV | G/SPE | 4-MEC | 0–878 | 50.9 | Seized samples | 17 |
| DPV | G/SPE | Eutylone | 2–10 | 0.33 | Seized samples | 18 |
| 2–400 | ||||||
| AdSDPV | G/SPE | MDPV | 0.2–100 | 0.5 | Seized sample | 12 |
| AdSDPV | BDD/SPE | NEP | 1–100 | 0.66 | Seized sample | 19 |
| SWV | BDDE | Ethylone | 13–88 | 3.7 | Seized samples | 11 |
| Modified electrodes | ||||||
| DPV | CNF/SPE | MDPT | 0.5–112 | 0.39 | Seized samples | 20 |
| DPV | CYP2D6/C/SPE | α-PVP | 10–125 × 10−3 | 9.9 × 10⁻³ | — | 16 |
| SWV | MIP/C/SPE | MDPV | — | 1.8 | Blood serum | 14 |
| SWV | Sol–gel-MIP/GCE | 4-MMC | 1–10 × 10−3 | 0.8 × 10⁻³ | Plasma, urine | 13 |
| SWV | AgNPS@Sa-CPE | 4-MMC | 0.1–4.5 × 10⁻⁴ | 3.4 × 10⁻⁶ | Urine | 21 |
| AdSSWV | C/SPE with surfactant adsorption | Cl-PVP | 2.5–30 | 1.6 | Oral fluida | 22 |
| AdSDPV | GP/SPE | 4-MMC | 2.6–112 | 0.3 | Seized samples | 5 |
| Pot | ISE | 4-MMC | 3.3–560 | 1.0 | Oral fluid | 9 |
| Pot | ISE | MABP | 98–3500 | — | Mixture of NPS | 10 |
This paper shows the use of electrochemically oxidized 3-aminobenzoic acid (3ABA) deposited on graphite screen-printed electrodes for recognizing NPSs, including aminoindane and SCs with primary, secondary, and tertiary amino groups (Fig. 1). A combination of microscopic (scanning electron microscopy) and spectroscopic methods (Raman spectroscopy) was used to determine the morphology and the molecular structure of the 3ABA oxidation products coating the electrode surface. The electrochemical techniques (CV and EIS) enabled estimation of the acid–base character of the oxidation products of 3ABA, their selectivity towards the four NPSs, and then to determine the chosen NPSs, in particular, 2-aminoindane and butylone, in both the model and oral fluid samples.
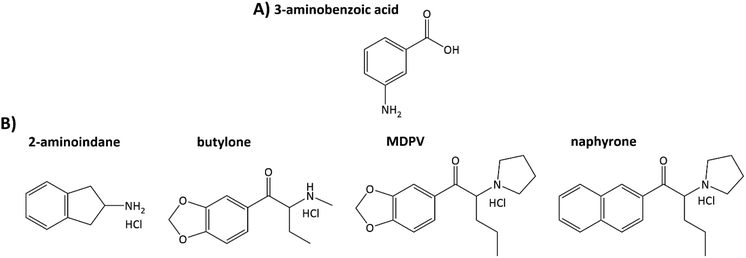 | ||
| Fig. 1 Structures of 3-aminobenzoic acid (A) and new psychoactive substances chosen for studying (B). | ||
Experimental
Reagents and materials
Butylone, methylenedioxypyrovalerone (MDPV) and naphyrone, all in forms of hydrochlorides, were acquired by the Forensic Laboratory of Biologically Active Substances (UCT, Prague) from Alfarma s.r.o. 3-Aminobenzoic acid (98%, 3ABA), aniline hydrochloride (97%, Ani) and 2-aminoindane hydrochloride (98%, 2-AI) were obtained from Sigma-Aldrich (USA). Inorganic compounds and acids used for electrochemical measurements were obtained from Lach-Ner or Penta (both Czech Republic, CR). The 0.04 M Britton–Robinson and 0.1 M phosphate buffers were prepared according to the usual protocol from the literature,28 and the pH was adjusted using solid sodium hydroxide. The solutions were prepared using redistilled water (UCT, Prague).Apparatus
Cyclic voltammetry (CV) and electrochemical impedance spectroscopy (EIS) measurements were performed using Palmsens 3 (PalmSens BV, Netherlands), controlled by the program PSTrace 5.4. The graphite and gold screen-printed electrodes (3.14 mm2 working surface; G/SPE and Au/SPE) with Ag/AgCl pseudoreference electrode (BVT Technologies, CR) were used for electrochemical and spectroscopic measurements, respectively.Raman spectra were collected using a Thermo Scientific DXR Raman microscope equipped with a 780 nm line. The spot size of the lasers was focused with a 50× objective. The scattered light was analyzed with a spectrograph with a holographic grating of 1200 lines per mm, and a pinhole width of 50 μm. The acquisition time was 10 s with 10 repetitions.
Scanning electron microscopy (SEM) images were recorded with a TESCAN Vega 3XMU InduSem (Tescan Orsay, Czech Republic) scanning electron microscope operating at an accelerating voltage between 15 and 30 kV equipped with a tungsten electron gun at a chamber pressure of 7 × 10⁻³ Pa. The G/SPEs were coated with a thin chromium film before the SEM measurements.
Electrochemical measurements
After modification of the G/SPE electrodes, the CV technique was used to evaluate the electrochemical activity and acid–base character (pKa) of the modified G/SPE electrode in 5 mM [Fe(CN)6]3−/4− (redox marker) in 0.04 M Britton–Robinson buffer solution of various pH levels over the potential range −0.6 to 0.8 V, and scan rate of 50 mV s−1. The value of the surface pKa was determined by sigmoid fitting (Boltzmann model) of the peak current to the pH dependence using the program OriginPro 2019b.
![[thin space (1/6-em)]](https://www.rsc.org/images/entities/char_2009.gif) 000 to 0.1 Hz, with the amplitude of the applied sine-wave potential being 10 mV. Randles circuits were used for the curve fitting of impedance spectra in the software package PSTrace 5.4. The equivalent circuits consisted of an electrolyte resistance (RS) in series with a constant phase element (CPE) and charge-transfer resistance (Rct) in parallel. For the G/SPE modified with oxidized 3ABA, the Warburg impedance (W) describing the diffusion of ions to the electrode surface was added in parallel. The Rct values were used to evaluate changes in the electron exchange via a redox marker after the modification of the electrode surface in the presence of analytes of interest. The adsorption constant (Kads) values were estimated with a Langmuir adsorption model using the CPE values. To eliminate the electrode-to-electrode discrepancy, the following equation was used: ΔCPE = (CPEn − CPE0), where CPE0 and CPEn are the CPE obtained in the supporting electrolyte before and after increasing the concentrations of analytes, respectively. To assess the sensitivity of the modified electrodes, we used the logarithmic dependence, EIS signal = f(log(c(NPS))), where the EIS signal was obtained from Rct or CPE employing the subsequent equation: EIS signal = (Rn − R0)/R0 × 1000 or (CPEn − CPE0)/CPE0 × 1000. The LOD was determined by the following equation: LOD = 3·sy/S, where sy is the standard deviation of response and S is the slope of the calibration curve.30
000 to 0.1 Hz, with the amplitude of the applied sine-wave potential being 10 mV. Randles circuits were used for the curve fitting of impedance spectra in the software package PSTrace 5.4. The equivalent circuits consisted of an electrolyte resistance (RS) in series with a constant phase element (CPE) and charge-transfer resistance (Rct) in parallel. For the G/SPE modified with oxidized 3ABA, the Warburg impedance (W) describing the diffusion of ions to the electrode surface was added in parallel. The Rct values were used to evaluate changes in the electron exchange via a redox marker after the modification of the electrode surface in the presence of analytes of interest. The adsorption constant (Kads) values were estimated with a Langmuir adsorption model using the CPE values. To eliminate the electrode-to-electrode discrepancy, the following equation was used: ΔCPE = (CPEn − CPE0), where CPE0 and CPEn are the CPE obtained in the supporting electrolyte before and after increasing the concentrations of analytes, respectively. To assess the sensitivity of the modified electrodes, we used the logarithmic dependence, EIS signal = f(log(c(NPS))), where the EIS signal was obtained from Rct or CPE employing the subsequent equation: EIS signal = (Rn − R0)/R0 × 1000 or (CPEn − CPE0)/CPE0 × 1000. The LOD was determined by the following equation: LOD = 3·sy/S, where sy is the standard deviation of response and S is the slope of the calibration curve.30
Results and discussion
Electrochemical polymerization of 3-aminobenzoic acid and aniline
Cyclic voltammograms obtained during the electropolymerization of both 3ABA and Ani (used for comparation) on the G/SPE electrode are shown in Fig. 2. Regardless of monomer, the first potential scan shows an irreversible oxidation of the amino group of 3ABA and Ani at +0.85 V and +0.91 V, respectively. The polymerization process is initiated by forming the cation radicals.31,32 With an increasing number of scans, a decrease in the peak currents was observed for the above-mentioned anodic peaks. This suggests adsorption of the formed oxidation products onto the electrode surface.33 In the first scan, reduction peaks were observed for both 3ABA (+0.31 V) and Ani (+0.30 V), and the respective oxidation peaks were recorded in the next scan (+0.46 V for 3ABA and +0.35 V for Ani). These peaks correspond to the change in the redox state of the layer deposited on the electrode.31,32 Compared to Ani, the oxidation/reduction peaks of 3ABA are less defined and only showed a slight increase in current. This phenomenon can be explained by the formation of shorter 3ABA oligomers34,35 that can be adsorbed onto the electrode surface and thus prevent the redox reaction from occurring.31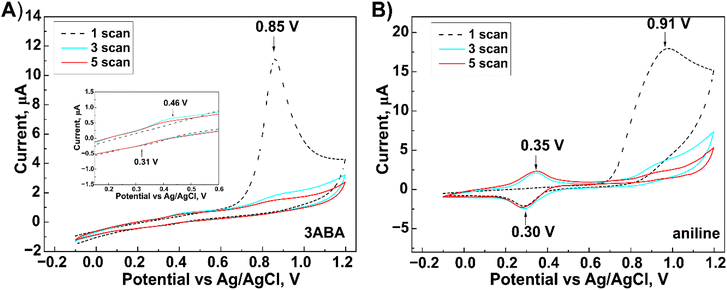 | ||
| Fig. 2 Cyclic voltammograms obtained during the electrochemical oxidation of 3-aminobenzoic acid (A) and aniline (B) carried out on the surface of graphite screen-printed electrodes. | ||
Electrode characterization
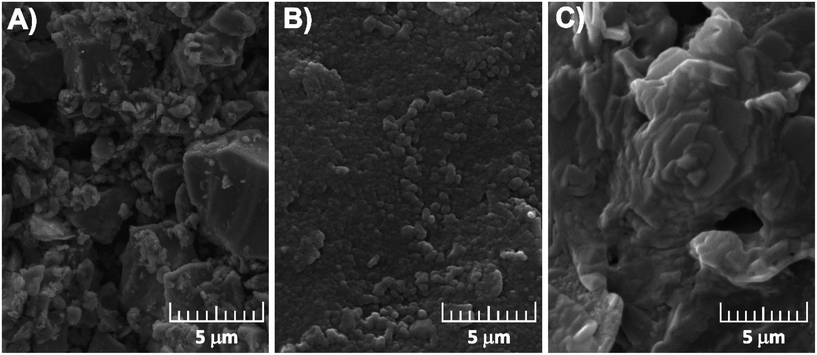 | ||
| Fig. 3 SEM micrographs of graphite screen-printed electrodes before modification (A) and modified with the oxidation products of 3-aminobenzoic acid (B) and aniline (C). | ||
This type of coating might correspond to the formation of oligomeric structures rather than polymeric ones.37 This conclusion can be supported by a proposed series of oligomeric structures for electrochemically oxidized 3ABA (o-3ABA, Scheme S2†).34 The uniform particle distribution can increase the contact area between the electrolyte and electrode, which may favour electrolyte penetration.38 The flower-like morphology of PANI/G/SPE (Fig. 3C) is obviously formed due to the acidity of the polymerization media.37
![[double bond, length as m-dash]](https://www.rsc.org/images/entities/char_e001.gif) O stretching vibration expected at higher wavenumbers signifies the zwitterionic structure of the monomer 3ABA.39 The peak at 1485 cm−1 corresponds to another aromatic ring vibration.34,40 The strong peak observed at 1386 cm−1 belongs to deprotonated COO− symmetric stretching vibrations.34,39–41 The peak detected at 1292 cm−1 has been assigned to the C–OH stretching vibrations and that at 910 cm−1 to the O–H stretching vibrations.39 The peaks observed at 1229, 1178 and 1010 cm−1 are connected with aromatic ring vibrations. The peak at 801 cm−1 belongs to the aryl C–H deformation vibrations.40
O stretching vibration expected at higher wavenumbers signifies the zwitterionic structure of the monomer 3ABA.39 The peak at 1485 cm−1 corresponds to another aromatic ring vibration.34,40 The strong peak observed at 1386 cm−1 belongs to deprotonated COO− symmetric stretching vibrations.34,39–41 The peak detected at 1292 cm−1 has been assigned to the C–OH stretching vibrations and that at 910 cm−1 to the O–H stretching vibrations.39 The peaks observed at 1229, 1178 and 1010 cm−1 are connected with aromatic ring vibrations. The peak at 801 cm−1 belongs to the aryl C–H deformation vibrations.40
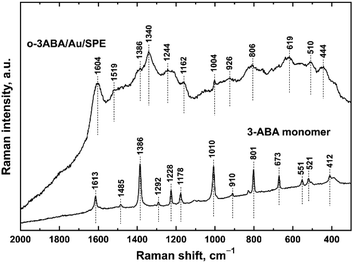 | ||
| Fig. 4 Dispersive Raman spectra obtained on gold screen-printed electrodes modified with the polymerization product of 3-aminobenzoic acid and the corresponding monomer. | ||
The Raman spectra of electrochemically oxidized 3ABA were measured on the surface of Au/SPE because of a strong scattering on G/SPE. Importantly, the gold surface neither affects the structure nor affects the properties of the deposited materials, which has been recently demonstrated for aniline oligomers.42,43 The Raman spectrum of oligomers derived from 3ABA (Fig. 4) exhibits a broad baseline, with some of the maxima coming from the monomer. In the Raman spectrum of o-3ABA/Au/SPE, the peak at 1680 cm−1 of the acid is also completely absent in the spectrum, which confirms the zwitterionic character of the oxidation product.41 It is clearly observed that some of the peaks of 3ABA developed into broad bands in the spectrum of o-3ABA/Au/SPE. The band with a maximum at 1604 cm−1 can be assigned to aromatic ring vibrations.34 The maximum at 1519 cm−1 has been assigned to the protonated amine symmetric deformation vibrations of NH+ as stated in ref. 34. A shoulder observed at 1386 cm−1 most likely belongs to the COO− symmetric stretching vibrations.39,41 A broad band with a maximum at 1340 cm−1 assigned previously to the phenol groups represented by the bands of C–O–H deformation vibrations coupled with C–O stretching vibrations, as described in ref. 34, could be connected with the polaron band of newly formed oligomers. Analogous to PANI (Fig. S1†), we suppose that the electrochemical oxidation occurs via amino groups and the presence of polarons localized on the molecules of trimers mentioned in ref. 32. The maximum at 1244 cm−1 can be attributed to the C–N stretching vibrations. It is clearly seen that the maxima observed at 1162, 1004, 926, and 801 cm−1 come from the corresponding peaks present in the spectrum of the monomer. The peak at 510 cm−1 corresponds to the deformation vibrations of NH3+. Based on the Raman spectroscopic analysis, we confirm the oligomeric structure of the product of electrochemical oxidation of 3ABA via amino groups and a zwitterionic form of o-3ABA side groups containing COO− groups.
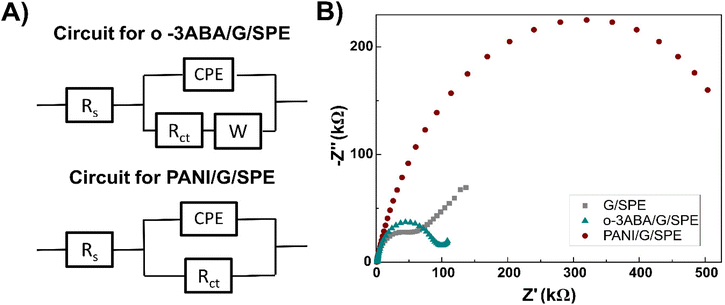 | ||
| Fig. 5 Equivalent electrical circuits used for the characterization of the modified G/SPE (A) and impedance spectra measured before and after modification of the electrode (B). | ||
Electrochemical studies
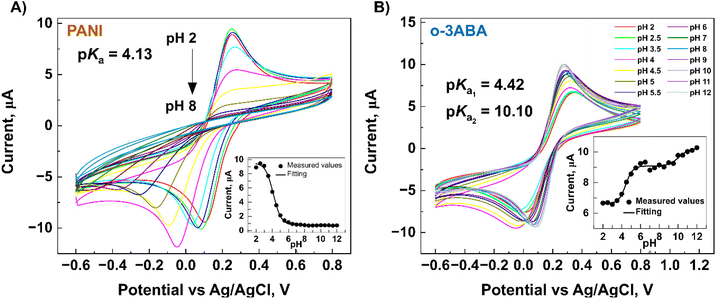
3ABA is a unique molecule from the point of view of acid–base ionization properties in a specific pH region in both solution and on the electrode surface. These can be explained by the intramolecular charge transfer (CT) between its amino and carboxyl groups,50 and because 3ABA possesses a zwitterionic character due to the presence of –COO− and –NH3+ groups.53 For o-3ABA, pKa = 4.42 and pKa = 10.10 corresponded to the carboxylic acid and amine groups, respectively (Fig. 6B inset). This confirms that o-3ABA can exist as zwitterionic (moderate pH) and anionic (high pH). The results of CV implicitly showed that o-3ABA is sufficiently conductive to mediate the electron transfer between the redox couple [Fe(CN)6]3−/4− and G/SPE. It is possible that the oligomeric structures provide an alternative reaction site for the electron transfer processes and are assumed to account for the electrocatalytic reactions.54 This unique advantage of the presence of zwitterionic groups in o-3ABA might explain the difference between the obtained values of Rct for o-3ABA/G/SPE (82.32 kΩ) and PANI/G/SPE (580.95 kΩ) (Fig. 5B).
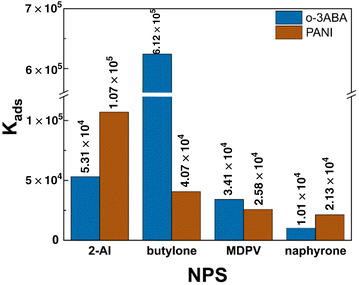
![[thin space (1/6-em)]](https://www.rsc.org/images/entities/char_2009.gif) P values of the chosen NPS exhibited the following sequence of increasing hydrophilicity: naphyrone (1.34) < MDPV (0.05) < butylone (−1.01) < 2-AI (−1.23). This is a possible reason for the higher affinity of o-3ABA for 2-AI/butylone compared to MDPV/naphyrone. Additionally, the interaction between o-3ABA and butylone is supported by specific hydrogen bonding between o-3ABA and the carbonyl and amino moiety of butylone (–C(O)–CH–NH2+–).
P values of the chosen NPS exhibited the following sequence of increasing hydrophilicity: naphyrone (1.34) < MDPV (0.05) < butylone (−1.01) < 2-AI (−1.23). This is a possible reason for the higher affinity of o-3ABA for 2-AI/butylone compared to MDPV/naphyrone. Additionally, the interaction between o-3ABA and butylone is supported by specific hydrogen bonding between o-3ABA and the carbonyl and amino moiety of butylone (–C(O)–CH–NH2+–).
| Parameters processed from EIS measurements | NPS | Equation | Linear range (μM) | Correlation coefficient (R2) |
|---|---|---|---|---|
| (Rn − R0)/R0 × 1000 | 2-Aminoindane | −184.3![[thin space (1/6-em)]](https://www.rsc.org/images/entities/char_2009.gif) log log![[thin space (1/6-em)]](https://www.rsc.org/images/entities/char_2009.gif) c(2-AI) − 1336.8 c(2-AI) − 1336.8 |
1–11 | 0.9948 |
| Butylone | −37.2![[thin space (1/6-em)]](https://www.rsc.org/images/entities/char_2009.gif) log log![[thin space (1/6-em)]](https://www.rsc.org/images/entities/char_2009.gif) c(But) − 343.0 c(But) − 343.0 |
1–711 | 0.9683 | |
| (CPEn − CPE0)/CPE0 × 1000 | 2-Aminoindane | −57.2![[thin space (1/6-em)]](https://www.rsc.org/images/entities/char_2009.gif) log log![[thin space (1/6-em)]](https://www.rsc.org/images/entities/char_2009.gif) c(2-AI) − 415.7 c(2-AI) − 415.7 |
1–922 | 0.9835 |
| Butylone | −37.6![[thin space (1/6-em)]](https://www.rsc.org/images/entities/char_2009.gif) log log![[thin space (1/6-em)]](https://www.rsc.org/images/entities/char_2009.gif) c(But) − 297.8 c(But) − 297.8 |
1–491 | 0.9233 |
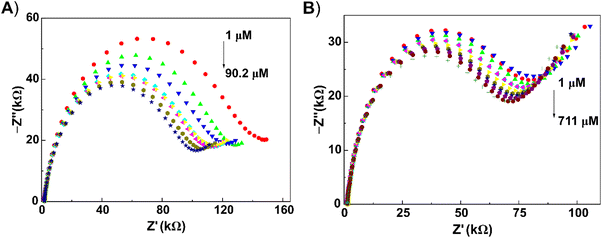
From the experimental Nyquist plots, it is clear that the semicircles decreased going from low to high concentration. Recently, this phenomenon has been noted in the development of impedimetric biosensors.55,57,58 The observed decrease in EIS signal has been assigned to less blocking of the flow of electrons through the electrode surface, and has been named as “competitive inhibition assay”.59 A well-defined lower frequency ‘tail’ is present with butylone, pointing to a better diffusion of butylone toward the electrode surface. Obviously, this diffusion impedance is affected by the structural and transport properties of the heterogenic electrode surface.48 The calibration equations were calculated from the relative values of circuit elements Rct and CPE (see section “Electrochemical impedance spectroscopy”).
For 2-AI, a wide concentration range was obtained for the relationship between the relative value of the CPE and logarithmic value of the concentration dependence. For butylone, the concentration range was shortened. For the detection of the chosen analytes (see section “Analysis of model and oral fluid samples”), we decided to use the values of relative CPE elements from the experimental circuit. In model samples, the limits of detection (LOD) were comparable: 0.92 μM for 2-AI and 0.68 μM for butylone. A deviation of 8.6–13.8% was found at a repeatable calibration of 2-AI and butylone with o-3ABA-modified electrodes (n = 3) in model samples (Table S2†). Such reproducibility is satisfactory considering the low cost of the electrode fabrication route.60 The interferences of NPSs from the category of synthetic cathinones and substances that can be found in saliva samples (sodium chloride, glucose) were then tested (Fig. S3†). The interfering effect increased in the following order:
naphyrone (tertiary amine) < MDPV (tertiary amine) < butylone (secondary amine)
sodium chloride < glucose < 2-aminoindane < butylone.
Importantly, the interfering effect of synthetic cathinones and 2-aminoindane was in agreement with the experimental adsorption constant values (Fig. 7). The fact that the electrode surface is coated with zwitterionic oligomers of 3-ABA explains the minimal interfering effect of charged ions such as sodium and chloride ions. The inter-day stability of the signal at a 1 μM concentration was obtained, and found to be less than one percent (0.7%) for butylone and 2.6% for 2-AI over a span of two weeks (Fig. S4†).
The most common way of administering synthetic cathinones is through intranasal consumption. Internet user forums report that the dose of NPS that has the pyrrolidine ring and the tertiary amino group can be 5–10 mg.61 Based on pharmacological studies, the concentration of cathinones in oral fluids is found to vary between 10−6 and 10−5 M.62 Oral fluids as samples are an advantageous matrix for NPS determination, since they are easily accessible and can be collected by non-medical personnel. Normal salivary pH is from 6 to 7 and varies in accordance with the salivary flow, from 5.3 (low flow) to 7.8 (peak flow). Moreover, the oral fluids themselves behave as a buffer system.63 Therefore, the determination of chosen analytes was carried out without addition of a buffer. It was found that both 2-AI and butylone determination was possible with the prepared o-3ABA/G/SPE in both model and oral fluid samples (Table 3, Table S3, Fig. S5†). In oral fluids, the sensitivity and LOD were evaluated: −118 nF decade−1, 1.04 μM for 2-AI; −59 nF decade−1, 0.91 μM for butylone (Table S3, Fig. S5†). The increment in the CPE observed when analysing the oral fluid samples can be explained by the microscopic roughness, chemical inhomogeneities and ion adsorption.64,65
| Sample | NPSs | Found (μM) | RSD (%) | Recovery (%) |
|---|---|---|---|---|
| Model sample | 2-Aminoindane | 0.99 ± 0.04 | 4.0 | 99.4 |
| Butylone | 1.02 ± 0.07 | 6.4 | 102.0 | |
| Oral fluid | 2-Aminoindane | 1.01 ± 0.03 | 3.5 | 100.9 |
| Butylone | 1.03 ± 0.05 | 4.9 | 103.1 |
The development of a sensor for application in oral fluids requires the mitigation of biofouling effects. Russo et al. have discussed the following strategies for eliminating antifouling: (i) nanoengineered surfaces, (ii) antifouling coatings, (iii) nanoporous membranes and (iv) hydrogels.66 Zwitterionic compounds can form a strong hydration layer on the surface by interacting with water molecules through hydrogen bonding and electrostatic interaction, which can produce an antifouling effect in an aqueous environment.67 It can be assumed that zwitterionic oligomers of o-3ABA deposited on the G/SPE surface might be as effective at reducing the fouling and have advantages over the PANI-modified electrode.
Chromatographic methods with mass spectrometry are often used for the laboratory detection of NPSs. While these techniques provide high sensitivity and low detection limits, their main disadvantages are time-consuming sample preparation and analysis. Therefore, it is important to show the possibilities of techniques described in the literature and those proposed in this study (Table 4).
To perform on-site analysis, the sampling step should be coupled with measuring and processing the signal with the corresponding software. Our next steps will be focused on the transfer of our experience and experimental findings in cooperation with a Prague criminology group working in the field of drug analysis.
Conclusions
This manuscript presents a complex characterization of the oligomeric product of 3ABA on the surface of a G/SPE including its morphology, structure and affinity towards the forensic analytes, which included 2-AI and selected synthetic cathinones. The recognizing properties of o-3ABA are dictated by its zwitterionic form that provides high polarity and hydrophilicity to the surface and prefers more hydrophilic butylone (log![[thin space (1/6-em)]](https://www.rsc.org/images/entities/char_2009.gif) P = −1.01; Kads(butylone) = 6.12 × 10⁵) and 2-AI (log
P = −1.01; Kads(butylone) = 6.12 × 10⁵) and 2-AI (log![[thin space (1/6-em)]](https://www.rsc.org/images/entities/char_2009.gif) P = −1.23; Kads(2-AI) = 5.31 × 10⁴). The reason for the higher adsorption constant values for butylone could be additional specific hydrogen bonding occurring between o-3ABA and the butylone molecule. The quantification of 2-AI and butylone at 1.0 × 10⁻⁶ M was demonstrated in both the model and oral fluid samples. The modification of surface SPEs is a way to increase the selectivity of voltammetric analysis in the field of forensic praxis.
P = −1.23; Kads(2-AI) = 5.31 × 10⁴). The reason for the higher adsorption constant values for butylone could be additional specific hydrogen bonding occurring between o-3ABA and the butylone molecule. The quantification of 2-AI and butylone at 1.0 × 10⁻⁶ M was demonstrated in both the model and oral fluid samples. The modification of surface SPEs is a way to increase the selectivity of voltammetric analysis in the field of forensic praxis.
Author contributions
The manuscript was written through contributions from all authors. All authors have given approval to the final version of the manuscript. Conceptualization: Tatiana V. Shishkanova, Eva Pospíšilová, and Gabriela Broncová; data curation and analysis: Eva Pospíšilová and Miroslava Trchová; writing – original draft: Eva Pospíšilová, Tatiana V. Shishkanova, and Gabriela Broncová; writing – review & editing: Tatiana V. Shishkanova, Eva Pospíšilová, Gabriela Broncová, and Miroslava Trchová.Conflicts of interest
There are no conflicts to declare.Acknowledgements
This work was supported by a grant from Specific University Research – Grant No. A2 FCHI 2022 009 and by Institutional Resources (Department of Analytical Chemistry, UCT Prague, CZ; Grant Number: 402850061). The authors are grateful to Dr R. Fajgar for the measurements of the scanning electron microscopy images. The authors are also grateful to Dr M. Kuchař for providing the synthetic cathinones.References
- A. Shafi, A. J. Berry, H. Sumnall, D. M. Wood and D. K. Tracy, Ther. Adv. Psychopharmacol., 2020, 10, 2045125320967197 CrossRef PubMed.
- L. Karila, J. Billieux, A. Benyamina, C. Lançon and O. Cottencin, Brain Res. Bull., 2016, 126, 61–67 CrossRef CAS PubMed.
- P. Kuropka, M. Zawadzki and P. Szpot, Forensic Toxicol., 2023, 41, 25–46 CrossRef PubMed.
- C. T. Gallagher, S. Assi, J. L. Stair, S. Fergus, O. Corazza, J. M. Corkery and F. Schifano, Hum. Psychopharmacol., 2012, 27, 106–112 CrossRef CAS PubMed.
- L. M. A. Melo, L. C. Arantes, I. F. Schaffel, L. M. S. Aranha, N. S. Conceição, C. D. Lima, P. A. Marinho, R. Q. Ferreira and W. T. P. dos Santos, Analyst, 2023, 148, 1552–1561 RSC.
- F. Joosten, M. Parrilla, A. L. N. van Nuijs, K. I. Ozoemena and K. De Wael, Electrochim. Acta, 2022, 436, 141309 CrossRef CAS.
- B. Zanfrognini, L. Pigani and C. Zanardi, J. Solid State Electrochem., 2020, 24, 2603–2616 CrossRef CAS.
- T. V. Shishkanova, E. Pospíšilová and V. Prokopec, Electroanalysis, 2022, 34, 1193–1200 CrossRef CAS.
- E. Pospíšilová, N. Paškanová, M. Kuchař and T. V. Shishkanova, Electroanalysis, 2023, 35, e202200468 CrossRef.
- T. V. Shishkanova, L. Vatrsková, D. Spálovská, F. Králík, P. Cuřínová, M. Winkler, J. Budka, B. Jurásek, M. Kuchař and V. Setnička, Forensic Toxicol., 2020, 38, 70–78 CrossRef CAS.
- G. L. Scheel, F. M. de Oliveira, L. L. G. de Oliveira, R. A. Medeiros, C. C. Nascentes and C. R. T. Tarley, Sens. Actuators, B, 2018, 259, 1113–1122 CrossRef CAS.
- C. D. Lima, R. A. S. Couto, L. C. Arantes, P. A. Marinho, D. M. Pimentel, M. B. Quinaz, R. A. B. da Silva, E. M. Richter, S. L. Barbosa and W. T. P. dos Santos, Electrochim. Acta, 2020, 354, 136728 CrossRef CAS.
- I. Razavipanah, E. Alipour, B. Deiminiat and G. H. Rounaghi, Biosens. Bioelectron., 2018, 119, 163–169 CrossRef CAS PubMed.
- R. A. S. Couto, C. Coelho, B. Mounssef Jr., S. F. A. Morais, C. D. Lima, W. T. P. dos Santos, F. Carvalho, C. M. P. Rodrigues, A. A. C. Braga, L. M. Gonçalves and M. B. Quinaz, Nanomaterials, 2021, 11(2), 353 CrossRef CAS PubMed.
- Y. Liu, H. Yu, O. Alkhamis, J. Moliver and Y. Xiao, Anal. Chem., 2020, 92, 5041–5047 CrossRef CAS PubMed.
- A. F. Lugo Vargas, W. G. Quevedo Buitrago, D. C. Chaves Silva and J. F. Martínes Suárez, ChemistrySelect, 2022, 7, e202202748 CrossRef CAS.
- J. P. Smith, J. P. Metters, O. I. G. Khreit, O. B. Sutcliffe and C. E. Banks, Anal. Chem., 2014, 86, 9985–9992 CrossRef CAS PubMed.
- M. O. B. Arrieiro, L. C. Arantes, D. A. R. Moreira, D. M. Pimentel, C. D. Lima, L. M. F. Costa, R. M. Verly and W. T. P. dos Santos, Electrochim. Acta, 2022, 412, 140106 CrossRef CAS.
- L. M. A. Melo, L. V. de Faria, L. C. Arantes, M. Vojs, M. Marton, R. F. Brocenschi, E. M. Richter, R. A. A. Munoz and W. T. P. dos Santos, Electrochim. Acta, 2023, 465, 142996 CrossRef CAS.
- C. D. Lima, L. M. A. Melo, L. C. Arantes, N. d. S. Conceição, I. de França Schaffel, L. L. Machado, R. de Queiroz Ferreira and W. T. P. dos Santos, Talanta, 2024, 269, 125375 CrossRef CAS PubMed.
- G. C. Papaioannou, S. Karastogianni and S. Girousi, Sensors, 2022, 22, 1625 CrossRef CAS PubMed.
- M. Parrilla, F. Joosten and K. De Wael, Sens. Actuators, B, 2021, 348, 130659 CrossRef CAS.
- H. Chen, F. Wu, Y. Xu, Y. Liu, L. Song, X. Chen, Q. He, W. Liu, Q. Han, Z. Zhang, Y. Zou and W. Liu, RSC Adv., 2021, 11, 29752–29761 RSC.
- M. Ates, Mater. Sci. Eng., C, 2013, 33, 1853–1859 CrossRef CAS PubMed.
- F. Xu, M. Gao, L. Wang, G. Shi, W. Zhang, L. Jin and J. Jin, Talanta, 2001, 55, 329–336 CrossRef CAS PubMed.
- P. C. Pandey, D. S. Chauhan and V. Singh, Electrochim. Acta, 2009, 54, 2266–2270 CrossRef CAS.
- S. Mahalakshmi and V. Sridevi, Electrocatalysis, 2021, 12, 415–435 CrossRef CAS.
- J. Fogl and K. Volka, Analytické tabulky, VŠCHT, Praha, 2 edn, 2002 Search PubMed.
- T. V. Shishkanova and A. Sinica, J. Electroanal. Chem., 2022, 921, 116674 CrossRef CAS.
- Determination of limit of detection, https://arts-sciences.und.edu/academics/chemistry/kubatova-research-group/_files/docs/determination_of_lods_new.pdf, (accessed 05.11.2023).
- Y. T. Liu, J. Deng, X. L. Xiao, L. Ding, Y. L. Yuan, H. Li, X. T. Li, X. N. Yan and L. L. Wang, Electrochim. Acta, 2011, 56, 4595–4602 CrossRef CAS.
- G. Ćirić-Marjanović, Synth. Met., 2013, 177, 1–47 CrossRef.
- P. C. M. Santos, T. M. Lima, P. I. Soares, R. M. Coelho, H. R. Martins, D. B. da Cruz, A. C. Pereira, D. L. Franco and L. F. Ferreira, Mater. Chem. Phys., 2022, 288, 126364 CrossRef CAS.
- T. V. Shishkanova, G. Broncová, Z. Němečková, V. Vrkoslav, V. Král and P. Matějka, J. Electroanal. Chem., 2019, 832, 321–328 CrossRef CAS.
- C. Thiemann and C. M. A. Brett, Synth. Met., 2001, 123, 1–9 CrossRef CAS.
- E. N. Zare, M. M. Lakouraj and E. Moosavi, Compos. Interfaces, 2016, 23, 571–583 CrossRef CAS.
- Y. Zhao, J. Stejskal and J. Wang, Nanoscale, 2013, 5, 2620–2626 RSC.
- J. Yan, W. Yuan, Z.-Y. Tang, H. Xie, W.-F. Mao and L. Ma, J. Power Sources, 2012, 209, 251–256 CrossRef CAS.
- M. Samsonowicz, T. Hrynaszkiewicz, R. Świsłocka, E. Regulska and W. Lewandowski, J. Mol. Struct., 2005, 744–747, 345–352 CrossRef CAS.
- R. Świsłocka, E. Regulska, M. Samsonowicz, T. Hrynaszkiewicz and W. Lewandowski, Spectrochim. Acta, Part A, 2005, 61, 2966–2973 CrossRef PubMed.
- H. Park, S. B. Lee, K. Kim and M. S. Kim, J. Phys. Chem., 1990, 94, 7576–7580 CrossRef CAS.
- M. Trchová, Z. Morávková, J. Dybal and J. Stejskal, ACS Appl. Mater. Interfaces, 2014, 6, 942–950 CrossRef PubMed.
- M. Trchová, Z. Morávková, M. Bláha and J. Stejskal, Electrochim. Acta, 2014, 122, 28–38 CrossRef.
- T. Balkenhohl and F. Lisdat, Anal. Chim. Acta, 2007, 597, 50–57 CrossRef CAS PubMed.
- A. A. Karyakin, A. K. Strakhova and A. K. Yatsimirsky, J. Electroanal. Chem., 1994, 371, 259–265 CrossRef CAS.
- M. Vrňata, D. Kopecký, F. Vysloužil, V. Myslík, P. Fitl, O. Ekrt, J. Hofmann and L. Kučera, Sens. Actuators, B, 2009, 137, 88–93 CrossRef.
- S. Dhillon and R. Kant, J. Chem. Sci., 2017, 129, 1277–1292 CrossRef CAS.
- J. Huang, Electrochim. Acta, 2018, 281, 170–188 CrossRef CAS.
- A. Yavarinasab, M. Abedini, H. Tahmooressi, S. Janfaza, N. Tasnim and M. Hoorfar, Polymers, 2022, 14, 31 CrossRef CAS PubMed.
- T. Stalin and N. Rajendiran, Chem. Phys., 2006, 322, 311–322 CrossRef CAS.
- C. Anex, E. Touzé, L. Curet, F. Gohier and C. Cougnon, ChemElectroChem, 2019, 6, 4963–4969 CrossRef CAS.
- W. Gao and J. Song, Electroanalysis, 2009, 21, 973–978 CrossRef CAS.
- S. H. Hilal, S. W. Karickhoff and L. A. Carreira, Talanta, 1999, 50, 827–840 CrossRef CAS PubMed.
- A. M. Asiri, W. A. Adeosun, H. M. Marwani and M. M. Rahman, New J. Chem., 2020, 44, 2022–2032 RSC.
- T. V. Shishkanova, F. Králík and A. Synytsya, Sensors, 2023, 23, 3727 CrossRef CAS PubMed.
- K. Qu, Z. Yuan, Y. Wang, Z. Song, X. Gong, Y. Zhao, Q. Mu, Q. Zhan, W. Xu and L. Wang, Chem. Phys. Mater., 2022, 1, 294–309 Search PubMed.
- J. Zhang, Y. Wu, B. Zhang, M. Li, S. Jia, S. Jiang, H. Zhou, Y. Zhang, C. Zhang and A. P. F. Turner, Anal. Lett., 2012, 45, 986–992 CrossRef CAS.
- J. V. Rushworth, A. Ahmed, H. H. Griffiths, N. M. Pollock, N. M. Hooper and P. A. Millner, Biosens. Bioelectron., 2014, 56, 83–90 CrossRef CAS PubMed.
- E. P. Randviir and C. E. Banks, Anal. Methods, 2013, 5, 1098–1115 RSC.
- J. R. Sempionatto, T. Nakagawa, A. Pavinatto, S. T. Mensah, S. Imani, P. Mercier and J. Wang, Lab Chip, 2017, 17, 1834–1842 RSC.
- EMCDDA, Synthetic cathinones drug profile, https://www.emcdda.europa.eu/publications/drug-profiles/synthetic-cathinones_en, (accessed 19.11.2023).
- E. Papaseit, E. Olesti, C. Pérez-Mañá, M. Torrens, F. Fonseca, M. Grifell, M. Ventura, R. de la Torre and M. Farré, Pharmaceuticals, 2021, 14, 100 CrossRef CAS PubMed.
- P. D. V. De Almeida, A. M. T. Grégio, M. Â. N. Machado, A. A. S. De Lima and L. R. Azevedo, J. Contemp. Dent. Pract., 2008, 9, 072–080 CrossRef.
- J. S. Daniels and N. Pourmand, Electroanalysis, 2007, 19, 1239–1257 CrossRef CAS PubMed.
- J.-B. Jorcin, M. E. Orazem, N. Pébère and B. Tribollet, Electrochim. Acta, 2006, 51, 1473–1479 CrossRef CAS.
- M. J. Russo, M. Han, P. E. Desroches, C. S. Manasa, J. Dennaoui, A. F. Quigley, R. M. I. Kapsa, S. E. Moulton, R. M. Guijt, G. W. Greene and S. M. Silva, ACS Sens., 2021, 6, 1482–1507 CrossRef CAS PubMed.
- J. Niu, H. Wang, J. Chen, X. Chen, X. Han and H. Liu, Colloids Surf., A, 2021, 626, 127016 CrossRef CAS.
- L. A. Nisbet, F. M. Wylie, B. K. Logan and K. S. Scott, J. Anal. Toxicol., 2019, 43, 346–352 CrossRef CAS PubMed.
- T. Lau, M. Concheiro and G. Cooper, J. Anal. Toxicol., 2020, 44, 679–687 CrossRef CAS PubMed.
- M. Williams, J. Martin and P. Galettis, J. Anal. Toxicol., 2017, 41, 659–669 CrossRef CAS PubMed.
- J. Schram, M. Parrilla, N. Sleegers, F. Van Durme, J. van den Berg, A. L. N. van Nuijs and K. De Wael, Drug Test. Anal., 2021, 13, 1282–1294 CrossRef CAS PubMed.
Footnote |
| † Electronic supplementary information (ESI) available. See DOI: https://doi.org/10.1039/d3an01700a |
| This journal is © The Royal Society of Chemistry 2024 |

