 Open Access Article
Resistive pulse analysis of chiral amino acids utilizing metal–amino acid crystallization differences†
Blake
Stringer
 a,
Alexandra
Schmeltzer
 b,
C. Hyun
Ryu
c,
Hang
Ren
 c and
Long
Luo
 *a
*a
aDepartment of Chemistry, Wayne State University, Detroit, Michigan 48202, USA. E-mail: long.luo@wayne.edu
bDepartment of Chemistry, University of Utah, Salt Lake City, Utah 84112, USA
cDepartment of Chemistry, The University of Texas at Austin, 105 East 24th Street, Austin, TX 78712, USA
First published on 15th April 2024
Abstract
Here, we report a proof-of-concept resistive pulse method for analyzing chiral amino acids utilizing metal–amino acid crystallization differences. This method involves introducing an amino acid sample solution into a micropipette through a pressure-driven flow. The sample then mixes with a metal ion solution inside the pipette, forming metal–amino acid crystals. The crystal size depends on the enantiomeric excess (x) of chiral amino acid samples. Large x values lead to large crystals. The crystal size difference is then reflected in the resistive pulse size as they block the ionic transport in a micropipette to different extents. We used Cd-cystine crystallization as a model system and found approximately five times the mean current pulse size difference for racemic (x = 0) and L-only (x = +1) cystine samples. A similar result was observed for aspartate. Our discovery opens up new opportunities for micro/nanoscopic chiral amino acid analysis, which can potentially be used in single-cell analysis.
Introduction
Amino acids play a central role in the biosynthesis of proteins, thereby underpinning many biological processes. All common amino acids, except glycine, exist in two forms known as enantiomers: L- and D-. This molecular chirality is highly influential in determining the biological activity of amino acids and the proteins they form.1 Understanding the chiral nature of amino acids is important for structural biochemistry and enzymatic catalysis, molecular interactions, and the broader physiological implications inherent in the stereochemistry of these fundamental building blocks of life.L-Amino acids dominate biological systems, but recent studies have shown that there is an increased presence of D-enantiomers in the bodies of aging individuals.2,3 These D-enantiomers have been suggested as biomarkers for age-related diseases, including schizophrenia and dementia.4–8 In the quest to combat age-related diseases effectively, early detection of D-amino acids emerges as a strategy. The standard L-/D-amino acid analysis methods require liquid chromatography/tandem mass spectrometry (LC-MS/MS), which is expensive and complex.9,10 Therefore, there is a need for cost-effective and user-friendly methods for discriminating and quantifying L- and D-amino acids.
Some progress has been made in developing cost-effective methods for detecting chiral amino acids. For example, Ghasemi et al.11 developed a visual method for naked-eye discriminating chiral cysteines using unmodified CdTe quantum dots, which exhibit different nanoparticle aggregation kinetics in the presence of L- and D-cysteine. The quantum dot aggregation alters the fluorescence emission for chiral amino acid detection. The Pu group developed a fluorescence chiral discrimination method based on 1,1-binaphthyl core fluorescent probes.12 These probes exhibit high chemoselectivity and enantioselectivity for various amino acids such as glutamic acid, aspartic acid, serine, histidine, lysine, and tryptophan. They show fluorescence for one enantiomeric form of the amino acid while exhibiting little to no fluorescence for the other.
Besides fluorescence methods, electrochemical methods were also developed to distinguish chiral amino acids. These methods typically involved electrode polymerization or modification. For example, in a study conducted by Zhang et al.,13 molecularly imprinted polymers were used on films on gate electrodes to differentiate between tyrosine and tryptophan. Similarly, Erbilen et al.14 used the hierarchy polymerization of a glassy carbon electrode to distinguish tryptophan. However, there is still a need for chiral amino acid detection at the microscopic scale, which can potentially be used for single-cell analysis.
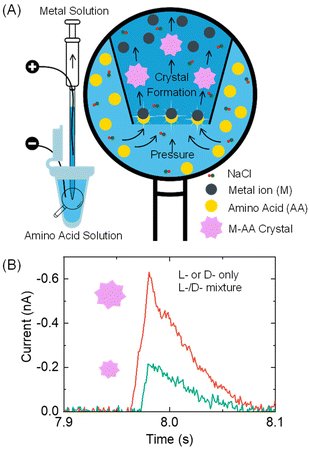
Here, we report a proof-of-concept resistive pulse method that can be used for analyzing chiral amino acids at the microscopic scale, as illustrated in Fig. 1. Our method is based on the recent discovery by the Kotov group that metal ions and amino acids react to produce metal–amino acid microcrystals of varying shapes and sizes depending on the amino acid's enantiomeric excess (x).15 The value of x is calculated as (L-enantiomer − D-enantiomer)/(L-enantiomer + D-enantiomer). For instance, pancake-shaped microcrystals are formed when a racemic mixture (x = 0) of L- and D-cystine (CST, the disulfide-bridged cysteine) is reacted with Cd2+. However, bowtie-shaped microcrystals with left or right-handed directionality appear when x increases from 0 to +1 or −1. The size of particles formed at x = +1 and −1 also doubles compared to those formed in a racemic CST mixture solution. The crystal shape and size alteration occurs due to the modified hydrogen bonding and geometric frustration among the building units as the metal–amino acid crystals assemble in the presence of different enantiomeric ratios of chiral amino acids.
In our method design, we use a resistive pulse technique to convert the size differences of metal–amino acid crystals into electrical signals. This technique involves a particle blocking the ionic conduction in a micro/nano-channel, which leads to a drop in ionic current.16–19 This method was chosen mainly for two reasons. Firstly, the resistive pulse analysis produces a cubic function of the particle size signal,20–22 which amplifies the size difference of metal–amino acid microcrystals formed at different enantiomeric ratios of chiral amino acids and improves the detection sensitivity. Secondly, the nano/micropipettes used in the resistive pulse analysis provide micro- to nano-meter spatial resolution, allowing for potential analysis of chiral amino acids in a single cell.23–25
Specifically, a metal ion solution is placed inside a glass pipette, while an amino acid sample solution is placed outside it (Fig. 1A). The conductance in the pipette is monitored by applying a voltage bias between two Ag/AgCl wire electrodes inside and outside the pipette. As the amino acid solution is driven into the pipette via a pressure-driven flow, it mixes with the metal ion solution. The formation of nano- or micron-sized metal–amino acid crystals blocks the pipette orifice, generating a current pulse in the current–time trace. The size difference of the crystals formed in the presence of a single enantiomer versus a mixture of both enantiomers is detected from the current pulse size. Specifically, if L- or D-amino acid is alone, it would lead to larger pulses than their mixtures (Fig. 1B). This method can differentiate between a solution containing the L- or D-amino acid and a solution containing both the L- and D-amino acids.
Results and discussion
Preparation and characterization of Cd-CST crystals
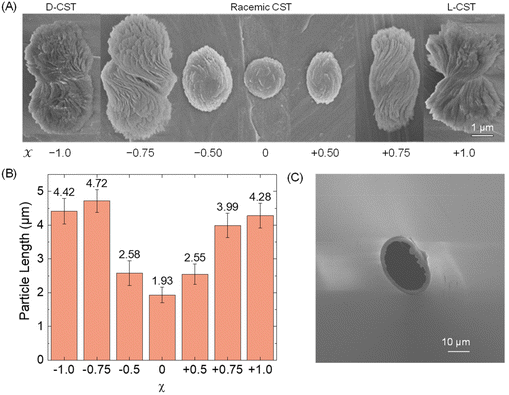
First, we conducted a study to determine the feasibility of detecting Cd-CST microcrystals prepared ex situ through resistive pulse analysis. We created Cd-CST microcrystals using a slightly modified version of an existing protocol.15 Briefly, we mixed 0.15 M NaCl, 1 mM CdCl2, and 6 mM CST with varying x values. NaCl was added as the electrolyte. The resulting mixture immediately turned cloudy, indicating the formation of crystals (Fig. S1†). We shook the reaction vial and left it undisturbed for 15 minutes to complete the reaction.The scanning electron microscopic (SEM) images of Cd-CST microcrystals synthesized from CST solutions with x values ranging from −1.0 (only D-CST) to 0 (equal L-CST and D-CST or a racemic mixture) and +1.0 (only L-CST) are shown in Fig. 2A. The crystals’ shape and size evolved as a function of x, with the shape changing from chiral bowties at x = ±1.0 to achiral disks at x = 0. The average length of crystals decreased from 4.28 ± 0.37 μm at x = +1.0 and 4.42 ± 0.37 μm at x = −1.0 to 1.93 ± 0.23 μm at x = 0 (Fig. 2B). The average width of the bowtie was 2.37 ± 0.47 μm (Fig. S2†). Additionally, all microcrystal samples had a zeta potential of ∼−33 mV (Table S1†), indicating negatively charged particles. The as-prepared glass pipettes have a native pore size of ∼200 nm (Fig. S3†). To match the Cd-CST microcrystal sizes in the resistive pulse analysis, pipette tips were gently cut to increase the pore size gradually. After successful resistive pulse analysis experiments, the pipettes were imaged by scanning electron microscopy. The typical pipette sizes used in our resistive pulse analysis experiments had a diameter of ∼10 to 20 μm and a half-cone angle of ∼2.4° (Fig. 2C).
Resistive pulse analysis of ex situ synthesized Cd-CST crystals
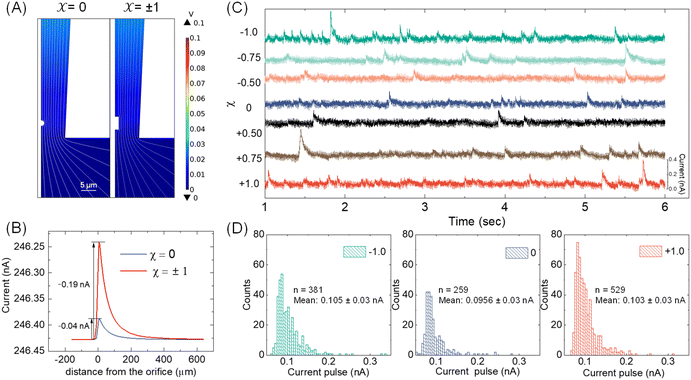
With the available Cd-CST microcrystal size and micropipette geometry, we then performed a finite-element simulation to estimate the theoretical resistive pulse size. For simplification purposes, we approximated the Cd-CST achiral disks (x = 0) and bowties (x = ±1) as 2D axisymmetric spheres and cylindrical rods with similar dimensions. Fig. 3A displays the simulated electric fields as a Cd-CST microcrystal enters a conical micropipette with an orifice radius of 8 μm for x = 0 and ±1. The electric field is more significantly disrupted by the bowtie than the disk due to its larger size, producing a current pulse of 0.19 A, about four times larger than the disk counterpart (Fig. 3B).Next, the resistive pulse experiments were carried out in a homebuilt setup, as shown in Fig. S4.† A micropipette filled with 0.15 M NaCl was inserted into the Cd-CST crystal solutions. Two Ag/AgCl wires were placed separately inside the micropipette and in the sample solution. A voltage bias of 0.1 V (internal vs. external) was applied between the two electrodes, and the current was monitored throughout the experiment. Since the Cd-CST microcrystals tend to settle down in the solution due to their large sizes (Fig. S5†), the sample solution was vigorously agitated to homogenize it before the measurements. Only the first minute of the chronoamperograms was recorded and analyzed.
Fig. 3C shows typical chronoamperograms during resistive pulse analysis of Cd-CST crystals synthesized from CST solutions with different x values. All samples showed asymmetric current pulses caused by microcrystals translocating through the pipette. The pulse sizes ranged from −0.1 to −0.4 nA, falling within the range of the simulation result of −0.04 to −0.19 nA. The pulse size for x = 0 was generally slightly smaller than other samples. To quantitatively compare the pulse size difference, a Python code was programmed for background subtraction and peak finding (Fig. S6†). The average current drops for L- and D-enantiomer were −0.103 ± 0.03 nA and −0.105 ± 0.03 nA, respectively, which were only slightly higher (∼8%) than that for a racemic mixture: −0.0956 ± 0.03 nA (Fig. 3D). The current pulse difference was smaller than the expected ∼5 times in Fig. 3B. This discrepancy likely resulted from the sampling bias during the analysis. The unstable microparticle suspension caused the larger particles to precipitate fast, and mostly, the smaller particles that can be driven into the pore by an electric field were sampled (Fig. S7†). However, such sampling bias would be avoided when the crystals were formed in situ by mixing the Cd2+ solution inside the pipette and the CST sample solution outside.
Resistive pulse analysis of in situ formed Cd-amino acid crystals
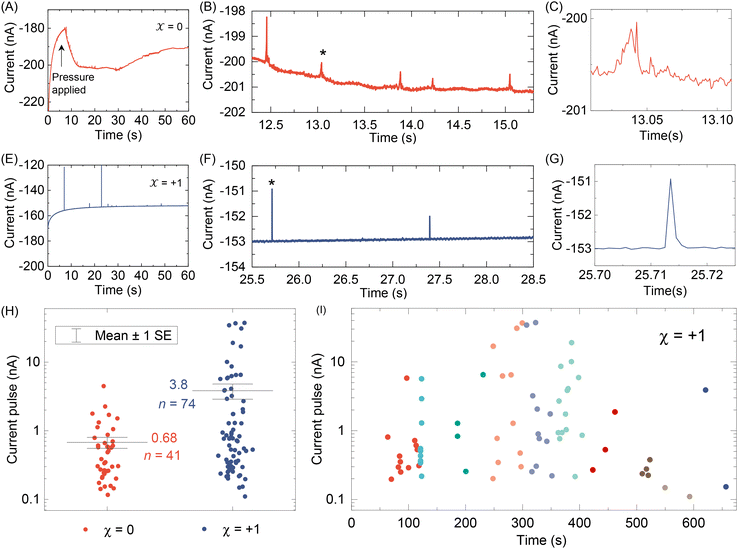
After testing with ex situ formed Cd-CST crystals, we continued with the experimental design in Fig. 1. Fig. 4A shows the current vs. time trace in the first minute during the resistive pulse analysis of a 6 mM racemic CST solution (x = 0). The CST solution was mixed with the 1 mM Cd2+ solution inside a micropipette via a pressure-driven flow (see the apparatus in Fig. S8†). The initial current fluctuation at ∼5 s was caused by the pressure-driven fluidic flow.26–28 We observed current pulses with sizes typically less than −1 nA (Fig. 4B). The pulse shape was also different from the asymmetric peaks observed in the ex situ experiments (Fig. 4C and 3C) because the crystals form inside the pipette and then exit it rather than translocation into the pipette. In comparison, the current pulse size was significantly larger for 6 mM L-CST solution (x = +1) than the racemic sample (Fig. 4E–G). Statistical analysis of the current pulses in Fig. 4H shows that both racemic CST and L-CST-only samples produced a broad distribution of pulse sizes over ∼two orders of magnitude, possibly due to the stochastic particle nucleation and growth in the pipette. The pulse sizes are a few times to 100 times larger than those observed in the ex situ experiment in Fig. 3, possibly because altered crystal nucleation and growth kinetics within confinement compared to bulk solution lead to the formation of large crystals.29–31 However, the ratio between the mean pulse size for L-CST and racemic CST samples is comparable to the predicted value of ∼5 by COMSOL simulation (Fig. 3B), indicating that the dependence of crystal growth kinetics on enantiomeric excess is still true in a confined pipette. A similar result was reproduced on a different pipette with a similar pore size (Fig. S9†). In addition, we did not observe a noticeable pulse size change as a function of time (Fig. 4I), suggesting the crystal nucleation and growth should be instant and reach equilibrium quickly. When the amino acid and Cd2+ solutions swapped positions, the current pulses for L-CST and racemic CST samples showed no noticeable difference (Fig. S10†), possibly because the crystal size is limited by the available metal ions rather than the chirality-dependent growth kinetics.We further applied our method to other chiral amino acids, such as serine and aspartate. Free D-serine and D-aspartate were found in the mammalian central nervous system and serum that lacked D-amino acid oxidase.32 Considerable research now indicates that these D-amino acids may be a potential therapeutic agent and biomarker in both schizophrenia and major depressive disorder.33 Unlike CST, the reactions between Cd2+ and serine/aspartate do not produce well-defined bowtie or disk crystals (Fig. S11†), but resistive pulse analysis of serine and aspartate samples still produces current pulses (Fig. S12†). Fig. 5A shows the current pulse size distributions of racemic serine and L-serine solutions, which exhibit comparable distributions and mean values (−1.43 vs. −1.03 nA). In contrast, L-aspartate produces noticeably large current pulses (>−1 nA) more frequently than its racemic counterpart (Fig. 5B). These results indicate that the chirality-dependent metal–amino acid crystallization is also amino acid-dependent, which could be potentially used as a fingerprint signal for discriminating among amino acids.
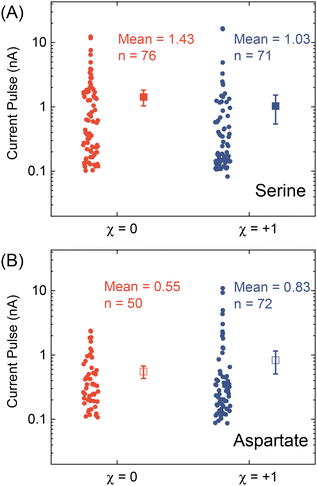 | ||
| Fig. 5 Current pulse size distributions for (A) serine and (B) aspartate samples with x = 0 and +1. The solid and empty squares show the mean values, and the error bars show the standard errors. | ||
Conclusion
In conclusion, we demonstrated a proof-of-concept resistive pulse method for analyzing chiral amino acids utilizing the dependence of metal–amino acid crystallization on the enantiomeric excess of chiral amino acids. Using Cd-CST crystallization as a model system, we successfully discriminated between L-CST and racemic CST solutions from the resistive pulse size distributions. A similar pulse size difference between L-aspartate and racemic aspartate solution was observed but not for serine. Our work opens a new opportunity for analyzing chiral amino acids at micro or nanoscale, which could be potentially used for single-cell analysis.Author contributions
Blake Stringer: conceptualization, methodology, validation, formal analysis, investigation, writing – original draft. Alexandra Schmeltzer: software. C. Hyun Ryu: resources. Hang Ren: resources. Long Luo: conceptualization, supervision, visualization, writing – review & editing.Conflicts of interest
There are no conflicts to declare.Acknowledgements
LL and BS acknowledge the funding support from the Alfred P. Sloan Foundation (Grant # FH-2023-20829) and the Carl R. Johnson Professorship from Wayne State University.References
- G. D. Novelli, Amino acid activation for protein synthesis, Annu. Rev. Biochem., 1967, 36, 449–484 CrossRef CAS PubMed.
- G. Tranter, The parity violating energy differences between the enantiomers of α-amino acids, Mol. Phys., 1985, 56(4), 825–838 CrossRef CAS.
- N. Fujii, T. Takata, N. Fujii, K. Aki and H. Sakaue, D-Amino, acids in protein: The mirror of life as a molecular index of aging, Biochim. Biophys. Acta, Proteins Proteomics, 2018, 1866(7), 840–847 CrossRef CAS PubMed.
- P. Roussos, S. G. Giakoumaki, E. Adamaki, A. Georgakopoulos, N. K. Robakis and P. Bitsios, The association of schizophrenia risk D-amino acid oxidase polymorphisms with sensorimotor gating, working memory and personality in healthy males, Neuropsychopharmacology, 2011, 36(8), 1677–1688 CrossRef CAS PubMed.
- R. Shapira, G. E. Austin and S. S. Mirra, Neuritic plaque amyloid in Alzheimer's disease is highly racemized, J. Neurochem., 1988, 50(1), 69–74 CrossRef CAS PubMed.
- Y. Nagata, M. Borghi, G. H. Fisher and A. D'Aniello, Free D-serine concentration in normal and Alzheimer human brain, Brain Res. Bull., 1995, 38(2), 181–183 CrossRef CAS PubMed.
- E. H. Man, G. H. Fisher, I. L. Payan, R. Cadilla-Perezrios, N. M. Garcia, R. Chemburkar, G. Arends and W. H. Frey 2nd, D-aspartate in human brain, J. Neurochem., 1987, 48(2), 510–515 CrossRef CAS PubMed.
- E. H. Man, M. E. Sandhouse, J. Burg and G. H. Fisher, Accumulation of D-aspartic acid with age in the human brain, Science, 1983, 220(4604), 1407–1408 CrossRef CAS PubMed.
- R. Kimura, H. Tsujimura, M. Tsuchiya, S. Soga, N. Ota, A. Tanaka and H. Kim, Development of a cognitive function marker based on D-amino acid proportions using new chiral tandem LC-MS/MS systems, Sci. Rep., 2020, 10(1), 804 CrossRef CAS PubMed.
- M. F. Alajmi, A. Hussain, M. Suhail, S. D. Mukhtar, D. R. Sahoo, L. Asnin and I. Ali, Chiral HPLC Separation and Modeling of Four Stereomers of DL-Leucine-DL-Tryptophan Dipeptide on Amylose Chiral Column, Chirality, 2016, 28(9), 642–648 CrossRef CAS PubMed.
- F. Ghasemi, M. R. Hormozi-Nezhad and M. Mahmoudi, Time-Resolved Visual Chiral Discrimination of Cysteine Using Unmodified CdTe Quantum Dots, Sci. Rep., 2017, 7(1), 890 CrossRef PubMed.
- L. Pu, Chemoselective and enantioselective fluorescent identification of specific amino acid enantiomers, Chem. Commun., 2022, 58(58), 8038–8048 RSC.
- L. Zhang, G. Wang, C. Xiong, L. Zheng, J. He, Y. Ding, H. Lu, G. Zhang, K. Cho and L. Qiu, Chirality detection of amino acid enantiomers by organic electrochemical transistor, Biosens. Bioelectron., 2018, 105, 121–128 CrossRef PubMed.
- N. Erbilen, E. Zor, A. O. Saf, E. G. Akgemci and H. Bingol, An electrochemical chiral sensor based on electrochemically modified electrode for the enantioselective discrimination of D-/L-tryptophan, J. Solid State Electrochem., 2019, 23, 2695–2705 CrossRef CAS.
- P. Kumar, T. Vo, M. Cha, A. Visheratina, J. Y. Kim, W. Xu, J. Schwartz, A. Simon, D. Katz, V. P. Nicu, E. Marino, W. J. Choi, M. Veksler, S. Chen, C. Murray, R. Hovden, S. Glotzer and N. A. Kotov, Photonically active bowtie nanoassemblies with chirality continuum, Nature, 2023, 615(7952), 418–424 CrossRef CAS PubMed.
- T. Ito, L. Sun, R. R. Henriquez and R. M. Crooks, A Carbon Nanotube-Based Coulter Nanoparticle Counter, Acc. Chem. Res., 2004, 37(12), 937–945 CrossRef CAS PubMed.
- L. Sun and R. M. Crooks, Single carbon nanotube membranes: A well-defined model for studying mass transport through nanoporous materials, J. Am. Chem. Soc., 2000, 122(49), 12340–12345 CrossRef CAS.
- O. A. Saleh and L. L. Sohn, Quantitative sensing of nanoscale colloids using a microchip Coulter counter, Rev. Sci. Instrum., 2001, 72(12), 4449–4451 CrossRef CAS.
- B. Zhang, J. Galusha, P. G. Shiozawa, G. Wang, A. J. Bergren, R. M. Jones, R. J. White, E. N. Ervin, C. C. Cauley and H. S. White, Bench-top method for fabricating glass-sealed nanodisk electrodes, glass nanopore electrodes, and glass nanopore membranes of controlled size, Anal. Chem., 2007, 79(13), 4778–4787 CrossRef CAS PubMed.
- L. Luo, S. R. German, W. J. Lan, D. A. Holden, T. L. Mega and H. S. White, Resistive-Pulse Analysis of Nanoparticles, Annu. Rev. Anal. Chem., 2014, 7, 513–535 CrossRef CAS PubMed.
- W. J. Lan, D. A. Holden, B. Zhang and H. S. White, Nanoparticle transport in conical-shaped nanopores, Anal. Chem., 2011, 83(10), 3840–3847 CrossRef CAS PubMed.
- L. Innes, M. R. Powell, I. Vlassiouk, C. Martens and Z. S. Siwy, Precipitation-Induced Voltage-Dependent Ion Current Fluctuations in Conical Nanopores, J. Phys. Chem. C, 2010, 114(18), 8126–8134 CrossRef CAS.
- R. Pan, K. Hu, R. Jia, S. A. Rotenberg, D. Jiang and M. V. Mirkin, Resistive-Pulse Sensing Inside Single Living Cells, J. Am. Chem. Soc., 2020, 142(12), 5778–5784 CrossRef CAS PubMed.
- N. Wang, D. Wang, R. Pan, D. Wang, D. Jiang and H. Y. Chen, Self-Referenced Nanopipette for Electrochemical Analysis of Hydrogen Peroxide in the Nucleus of a Single Living Cell, Anal. Chem., 2021, 93(31), 10744–10749 CrossRef CAS PubMed.
- S. Cai, T. Pataillot-Meakin, A. Shibakawa, R. Ren, C. L. Bevan, S. Ladame, A. P. Ivanov and J. B. Edel, Single-molecule amplification-free multiplexed detection of circulating microRNA cancer biomarkers from serum, Nat. Commun., 2021, 12(1), 3515 CrossRef CAS PubMed.
- W.-J. Lan, M. A. Edwards, L. Luo, R. T. Perera, X. Wu, C. R. Martin and H. S. White, Voltage-Rectified Current and Fluid Flow in Conical Nanopores, Acc. Chem. Res., 2016, 49(11), 2605–2613 CrossRef CAS PubMed.
- W.-J. Lan, D. A. Holden, J. Liu and H. S. White, Pressure-Driven Nanoparticle Transport across Glass Membranes Containing a Conical-Shaped Nanopore, J. Phys. Chem. C, 2011, 115(38), 18445–18452 CrossRef CAS.
- W.-J. Lan and H. S. White, Diffusional Motion of a Particle Translocating through a Nanopore, ACS Nano, 2012, 6(2), 1757–1765 CrossRef CAS PubMed.
- F. Kohler, O. Pierre-Louis and D. K. Dysthe, Crystal growth in confinement, Nat. Commun., 2022, 13(1), 6990 CrossRef CAS PubMed.
- Y. Li, M. Kvetny, M. Bowen, W. Brown, D. Wang and G. Wang, Method To Directly Measure and Actively Control a Single Nucleation-Crystal Growth Process, Cryst. Growth Des., 2019, 19(4), 2470–2475 CrossRef CAS.
- F. C. Meldrum and C. O'Shaughnessy, Crystallization in Confinement, Adv. Mater., 2020, 32(31), 2001068 CrossRef CAS PubMed.
- A. Hashimoto, T. Nishikawa, R. Konno, A. Niwa, Y. Yasumura, T. Oka and K. Takahashi, Free d-serine, d-aspartate and d-alanine in central nervous system and serum in mutant mice lacking d-amino acid oxidase, Neurosci. Lett., 1993, 152(1), 33–36 CrossRef CAS PubMed.
- M. B. MacKay, M. Kravtsenyuk, R. Thomas, N. D. Mitchell, S. M. Dursun and G. B. Baker, D-Serine: Potential Therapeutic Agent and/or Biomarker in Schizophrenia and Depression?, Front. Psychiatry, 2019, 10, 25 CrossRef PubMed.
Footnote |
| † Electronic supplementary information (ESI) available. See DOI: https://doi.org/10.1039/d4an00347k |
| This journal is © The Royal Society of Chemistry 2024 |

