 Open Access Article
Creative Commons Attribution 3.0 Unported Licence
Acoustic levitation and manipulation of columns of droplets with integrated optical detection for parallelisation of reactions†
Ruchi
Gupta
 *a and
Nicholas J.
Goddard
b
aSchool of Chemistry, University of Birmingham, Birmingham, B15 2TT, UK. E-mail: r.gupta.3@bham.ac.uk
bProcess Instruments, Turf Street, Burnley, Lancashire BB11 3BP, UK
First published on 18th October 2024
Abstract
The most common methodology for performing multiple chemical and biological reactions in parallel is to use microtitre plates with either manual or robotic dispensing of reactants and wash solutions. We envision a paradigm shift where acoustically levitated droplets serve as wells of microtitre plates and are acoustically manipulated to perform chemical and biological reactions in a non-contact fashion. This in turn requires that lines of droplets can be levitated and manipulated simultaneously so that the same operations (merge, mix, and detect) can be performed on them in parallel. However, this has not been demonstrated until this work. Because of the nature of acoustic standing waves, a single focus has more than one trap, and can allow levitation of columns of droplets at the focal point and at half a wavelength above and below that point. Using this approach, we increased the number of acoustically levitated and merged droplets to 6 compared to 2 in the state-of-the-art. We showed that droplets in a column can be moved and merged with droplets in another column simultaneously and in a controlled manner to perform repeats and/or parallelisation of chemical and biological reactions. To demonstrate our approach experimentally, we built an acoustic levitator with top and bottom surfaces made of a 16 × 16 grid of 40 kHz phased array transducers and integrated optical detection system, studied two acoustic trap generation and movement algorithms, and performed an exemplar enzyme assay. This work has made significant steps towards acoustic levitation and manipulation of large numbers of droplets to eventually significantly reduce the use of the current state-of-the-art tools, microtitre plates and robots, for performing parallelised chemical and biological reactions.
1. Introduction
Parallelisation of chemical and biological reactions is commonly achieved using microtitre plates1 with either operators or robots2 to dispense samples and reagents, to perform washing steps, and to move microtitre plates. Human operators make mistakes, while robots are often large and expensive because they contain many complex moving parts needed to move microtitre plates and dispense liquids.3 Microtitre plates are simply a continuation of a very old paradigm for chemical and biochemical experimentation, effectively being a large number of test tubes formed as a single object. As the plates are injection moulded4 from thermoplastics such as polystyrene, they have some notable drawbacks. They are not compatible with many organic solvents, sample and reagents can adsorb onto or partition into the walls of the plate,5 mixing can be slow in larger volume wells,6 and they contribute to large amounts of non-recyclable plastic waste generated by laboratories worldwide. For example, life scientists were estimated to produce ∼5.5 million tonnes of plastic waste worldwide in 2014,7 which was equivalent to 83% of the total recycled plastic waste in that year.In contrast, levitated liquid droplets can eliminate many of the drawbacks of microtitre plates. Levitated droplets can be manipulated without physical contact or moving parts, they provide a wall-less clean environment for reactions thus avoiding loss of sample/regents by adsorption to walls and they eliminate plastic waste. Several levitation techniques have been experimentally demonstrated, including dielectrophoretic,8 diamagnetic,9 and acoustic10 methods. Dielectrophoretic levitation in air requires feedback control to provide stable levitation, which has limited the technique to single particles/droplets. Diamagnetic levitation requires high magnetic fields that are usually provided by superconducting electromagnets. In contrast, acoustic levitation can be performed using low cost commercially available ultrasonic transducers, commonly available electronics and does not require feedback control.
Sound waves can impart an acoustic radiation force,11 which can counteract the gravitational force to levitate objects. Acoustic levitators are often formed by placing two surfaces opposite to each other where one surface comprises of arrays of ultrasonic transducers (phased array transducers, PATs) and the other surface is either a reflector or another PAT.12,13 Standing pressure waves can be formed between two oppositely placed surfaces with low pressure regions (i.e., nodes) separated by approximately half a wavelength of the sound waves produced by the transducers.14 Acoustic radiation forces are maximum at pressure nodes. Thus, objects can be levitated around pressure nodes. To manipulate levitated objects, acoustic fields are shaped by varying the voltage,12 phase,15,16 and impulse17 applied to ultrasonic transducers. Equally, acoustic fields can be shaped using holograms and meta-surfaces where sub-wavelength structures introduce phase delays.18 Holograms and meta-surfaces are beneficial because they are usually passive and can be 3D printed, but do not allow dynamic control over the shape of acoustic fields. As PATs offer maximum flexibility over shaping of acoustic fields, they are preferred for manipulation of levitated objects. An additional advantage of acoustic levitation is the rapid mixing19 of merged droplets by acoustic streaming within droplets.
Most acoustic levitation and manipulation studies have so far used expanded polystyrene (EPS) beads because their low density makes levitation in air easy.15,20 In contrast, studies on levitation and manipulation of liquid droplets in air, especially in large numbers, are limited. Most studies so far are based on only one acoustically levitated droplet.12,21 In 2023, the authors studied an oscillatory chemical reaction in five levitated droplets simultaneously, but the addition of reagents to levitated droplets was performed manually and sequentially19 because all droplets could only be moved up and down collectively and not independently. Similarly, standing waves high-order transverse (HOT) modes can potentially levitate several droplets, but these droplets can only be simultaneously manipulated, and hence cannot be used to merge droplets to initiate reaction.22 Currently, only up to a pair of levitated droplets have been acoustically manipulated to merge them.12,21 These systems have used transducers with a reflector, so are limited to moving droplets in two dimensions only. Separately, the emphasis so far has been on maximising the number of independently controlled acoustic traps and hence objects.16 However, for parallelisation of chemical and biological reactions, what is needed is an ability to manipulate lines of droplets so that same operations (e.g., merge, mix, and detect) can be performed on them in parallel, but has not been demonstrated, until this work. Because of the nature of focused standing waves, there is more than one node around the focus allowing the trapping of more than one droplet. In this work we have shown that columns of liquid droplets can be levitated at each focus and at half a wavelength above and below that point and that these columns can be moved and merged to not only perform an exemplar enzyme assay but also to parallelise assays.
2. Experimental
2.1 Chemicals and materials
Fluorescein sodium salt (F6377), fluorescein diacetate (FDA, F7378), and porcine liver esterase enzyme (E2884) were purchased from Sigma Aldrich Ltd (Gillingham, Dorset, UK). 10× phosphate-buffered saline (PBS, PBD999), pH 7.4 was purchased from CliniSciences Ltd (Slough, UK).2.2 Instrumentation
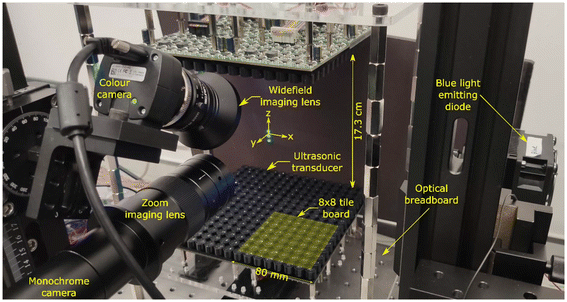
Our acoustic levitator (shown in Fig. 1) comprised of two flat surfaces placed ∼17.3 cm apart. Each surface was made of a 16 × 16 grid of ultrasonic transducers (MA40S4S, DigiKey Inc., Minnesota, USA) mounted on printed circuit boards (PCBs), containing the electronics required to drive the transducers. The ultrasonic transducers were 10 mm in diameter and produced sound waves of 40 kHz, which corresponds to a wavelength of 8.65 mm in air. The ultrasonic transducers were driven by a square wave with peak-to-peak voltage between 6 and 18 V. The voltages were generated using a 12 V external power supply (Kikusui PWR801L, Telonic Instruments Ltd, Berkshire, UK) in combination with on-board step-down converters (AP63300 buck converter chip, Diodes Inc., Plano, USA) and dual H-bridge drivers (Toshiba TC78H620FNG, DigiKey Inc, Minnesota, USA). The phase of each transducer could be independently set between 0 and 2π with a resolution of π/32. Phases were transmitted serially at 46.08 MHz to tile boards by an in-house designed USB Master board that received data over a USB 3.0 interface from a computer (see ESI for more details†).Thermal images were captured using a forward-looking infrared (FLIR) camera (Teledyne FLIR E63900, RS Components Ltd, Corby, UK) with 320 × 240 pixels resolution. Colour images and movies were captured using a colour camera (UI3580LE-C-HQ USB3, IDS Imaging Development Systems GmbH, Obersulm, Germany) with 2560 × 1920 pixels resolution equipped with a widefield imaging 25 mm focal length lens (MVL25M23, Thorlabs Inc., USA). Video files in AVI format were recorded using IDS Imaging's Cockpit software. Monochrome images were recorded using a Daheng Imaging MER2000-19U3M USB3 camera (GeT Camera BV, Eindhoven, The Netherlands) with 5496 × 3672 pixels resolution equipped with a Hayear HY-300XA zoom lens (Shenzhen Hayear Electronics Co. Ltd, Shenzhen, China) with magnification 0.7 to 4.5×. For recording fluorescence images, a 520 nm interference filter with 10 nm bandpass (Knight Optical Ltd, Harrietsham, UK) was placed in front of the zoom lens. Images from the Daheng camera were recorded at selected intervals using an in-house developed image recorder and processing program written in C++. Illumination of the particles and droplets was performed using a high-power blue LED (Luxeon L135-B475003500000, RS Ltd, Corby, UK) with a peak wavelength between 469 and 480 nm.
2.3 Software
We wrote two programmes in C++: (1) USB Master control and (2) simulation software (see ESI for details†). The USB Master software allowed controlling the voltage and phases of ultrasonic transducers as well as total number of steps and duration of each step for moving traps. The software calculated the phases of transducers for the required trap positions. Equally, the voltage applied to ultrasonic transducers could be changed with time. The simulation software could provide a distribution of acoustic pressure, Gor'kov potential, and acoustic force for a selected combination of transducer type, their positions and normal vector, and phases.2.4 Procedure
Our experimental procedure and algorithms for data analysis are provided below. Refer to Fig. 1 to see the location of origin and x-, y-, and z-axis used throughout this work.• Calibration curves for levitated fluorescein droplets: a single focus was generated at [0, 0, 0] and three 4 μl droplets of either PBS or 0.5, 1.0, 2.5, 5.0 or 10.0 ppm fluorescein in PBS were dispensed using a micropipette into the focal point and at multiples of λ/2 above and below the focal point. Images were recorded at selected time intervals using the Daheng camera equipped with a zoom lens and processed using the algorithm described below.
• Levitate, move, and merge droplets: two foci were generated at [–20, 0, 0] and [20, 0, 0] (both: mm) to levitate two lines each with up to 3 droplets of 2 μl. The droplets were pipetted in acoustic traps following which the two foci and hence the lines of droplets were moved towards each other along x-direction in the xz plane and merged at [0, 0, 0]. Each focal point was moved over 20 mm in 400 steps with the duration of each step being 100 ms. This implies that droplets were moved at 0.5 mm s−1. The duration from start time to the time when droplets were merged was ∼40 s. Movies were recorded at 4.4 frames per s using the IDS imaging camera equipped with a widefield imaging lens.
• Enzyme assays: FDA solution in PBS was prepared by dissolving 25 mg of FDA in 10 ml of acetone to generate a 2.5 mg ml−1 stock solution. 40 μl of this stock solution was then added to 1.96 ml of PBS to generate a 50 ppm solution. The FDA solution with a concentration of 50 ppm was slightly milky, suggesting that the substrate was not fully soluble in PBS. Esterase was dissolved in PBS to obtain a stock solution of 10 mg ml−1. The stock solution was divided into 20 μl aliquots and stored at −20 °C until use. This stock solution was used to prepare esterase solutions of 1, 0.5, 0.25 and 0.1 mg ml−1. The above procedure was used to levitate, move, and merge lines of 2 μl droplets of FDA substrate and esterase enzyme. After the substrate and enzyme droplets had merged, images were recorded at 2 s intervals using the Daheng camera equipped with a zoom lens and processed using the algorithm described below.
• Analysis of images: an ImageJ23 macro was written to find droplets, which were regions of images where the grayscale value was greater than the (mean + 3 × standard deviation) of grayscale value of background. As shown in Fig. S4,† a rectangle of fixed width and height located to one side of the centroid was drawn. This procedure avoided highlights caused by reflections from the surface of the droplets and lensing within the droplet. Grayscale values in this rectangle were added and divided by the area of the rectangle to estimate the mean fluorescence intensity of droplets.
3. Results and discussion
3.1 Levitation of droplets
As can be seen from Fig. S5,† at each focus, traps were created at the focal point and at multiples of λ/2 above and below the focal point. As shown in Fig. 2, these traps could levitate a line of up to 5 droplets and two lines with each of up to 3 droplets in case of single focus and two foci, respectively. The single focus was created by driving the transducer arrays at 8 V p–p, resulting in an average pressure of 2752 ± 100 Pa in antinodes for levitation of droplets. The two foci were created by driving the transducer arrays at 18 V p–p, resulting in an average pressure of 2959 ± 166 Pa in antinodes, which was needed to levitate droplets. Because the trapping force acts vertically (i.e., in z-direction), the droplets assume an oblate spheroid shape, where the minor axis is vertical, and the major axis is horizontal. Fig. S6† shows that the (vertical) minor axis varies much less than the (horizontal) major axis as the droplet volume increases because of the vertical trapping force. As a result, the ellipticity of the droplets depends on their volume, ranging from ∼1.6 for 2 μl droplets to ∼1.9 for 4 μl droplets. We measured the temperature of a line of acoustically levitated droplets by FLIR imaging with an exemplar image shown in Fig. S7.† Fig. S8† shows that the temperature of levitated droplets increased by ∼1.5 °C in 11 min and slowly approached a limiting value. It is unclear whether this temperature increase is a result of acoustic forces or convective heating from the transducers, which heated up to ∼40 °C. | ||
| Fig. 2 Levitated 2 μl droplets of 10 ppm fluorescein in PBS at (a) a single focus at [0, 0, 0] and (b) two foci at [–20, 0, 0] and [20, 0, 0] (both: mm). | ||
3.2 Moving and merging of levitated droplets
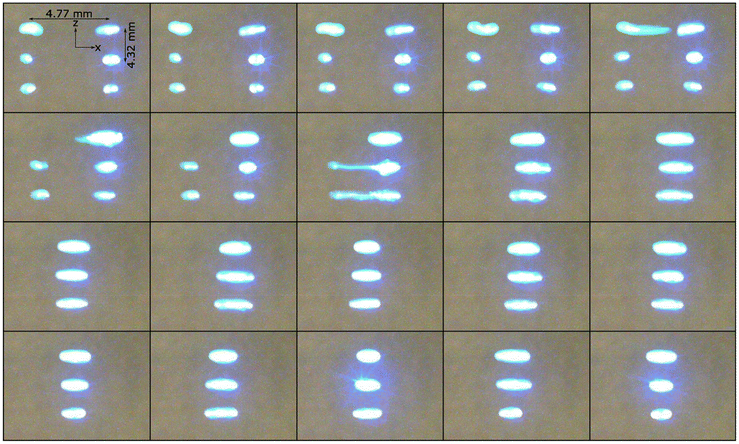
Initial attempts at moving particles and droplets used an iterative back propagation (IBP)16 algorithm, which resulted in episodes of erratic movements at certain positions. This was particularly pronounced when moving droplets, often resulting in loss of one or more droplets during their movement. In contrast, a checkerboard algorithm21 allowed much smoother movement of particles and droplets than the IBP algorithm. Refer to Movies S1–S6 and Fig. S9–S11.† Thus, all subsequent work was performed using the checkerboard algorithm. No feedback was required to move and merge the levitated droplets because the phase patterns applied to the two transducer arrays was calculated in advance using the selected algorithm.The acoustic Bond number decreases as the size of the droplet increases.12 Thus, to avoid atomisation of the larger droplets formed when two smaller droplets were merged, the voltage applied to the transducers was ramped down as the droplets approached each other. The timing and size of the voltage ramp were critical to avoid the merged droplet from atomising while ensuring that droplets did not fall out of the traps as they moved close to each other. Fig. 3 shows that if the voltage was not reduced when the droplets merged, the middle droplet would atomise. This is because the trap was strongest at this position. Additionally, the daughter droplets generated by the atomisation of the middle droplet would merge with the other levitated droplets and knock them out of traps and/or contaminate them. Equally, Fig. 4 shows the loss of a droplet caused by dropping the applied voltage too soon, in this case when the droplets were about 13 mm apart.
 | ||
| Fig. 4 Montage of images showing falling of a droplet while merging two lines of levitated droplets where time resolution is 454 ms. | ||
We created a pair of columns of three droplets separated by 40 mm in the x-axis. The optimum applied voltages were 18 V p–p for the first 17.5 mm of droplet movement towards each other along x-axis, dropping linearly to 8 V p–p over the last 2.5 mm of movement. Fig. 5 shows a montage of the successful merging of two columns of three droplets where the applied voltage was ramped from 18 V p–p to 8 V p–p as the droplets merged. As can be seen, the top two droplets merged first, followed after about 0.454 s by the remaining droplets. We can determine the time course of the reaction in each droplet from the start frame where those droplets merged. After merging, the droplets oscillated for a short time before settling down. The oscillations and acoustic streaming within the merged droplets resulted in rapid mixing on timescales shorter than the frame rate of the camera.
3.3 Enzyme assays
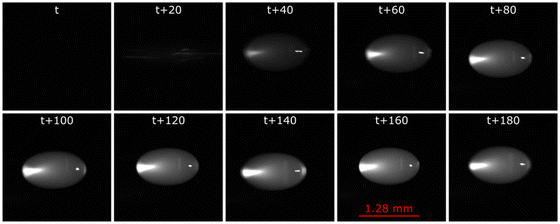
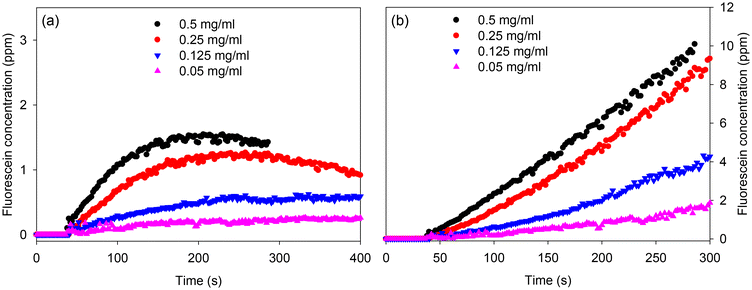
After being able to successfully merge lines of acoustically levitated droplets, we performed an exemplar bioassay using FDA substrate and esterase enzyme. Fig. 6 shows the increase in fluorescence over 180 s of a droplet obtained by merging droplets containing 1 mg ml−1 esterase and 50 ppm FDA. The increase in fluorescence of the merged droplet is because of conversion of non-fluorescent FDA to highly fluorescent fluorescein by the esterase enzyme.24We merged a pair of columns with each column containing three droplets. One of these columns had three 50 ppm FDA droplets and the other had three 1 mg ml−1 esterase droplets. Thus, the merged droplet contained 25 ppm FDA and 0.5 mg ml−1 esterase. Movie S7† shows the merging of three pairs of 50 ppm FDA and 1 mg ml−1 esterase and subsequent progression of the enzyme assay, resulting in fluorescein production in merged droplets. The images of resulting merged droplets were recorded using the Daheng camera with a zoom lens and the grayscale values of droplets were converted to fluorescein concentration using calibration curves similar to that shown in Fig. S12.† A plot of fluorescein concentration of a merged droplet located in the middle versus time is provided in Fig. 7(a). As expected, after the substrate and enzyme droplets were merged, fluorescein concentration in the merged droplet began to increase. Furthermore, Fig. 7(a) highlights that fluorescein was produced at a faster rate in droplets with higher concentration of esterase. However, the maximum fluorescein concentration in merged droplets was much lower than the case if all the FDA had been converted to fluorescein (<2 ppm versus 25 ppm). Furthermore, unexpectedly, fluorescein concentration started to decrease with time particularly, in case of merged droplets containing 0.5 and 0.25 mg ml−1 esterase. Both these observations were attributed to photobleaching of fluorescein and evaporation of droplets (see Fig. S14 and ESI for details†). Photobleaching was expected to reduce the apparent fluorescence intensity, while evaporation would be expected to increase the fluorescence intensity because of the increased concentration of fluorescein. Because of the significant decay in fluorescence intensity shown in Fig. 7(a), photobleaching is the dominant factor. Nevertheless, we corrected for both photobleaching and evaporation by dividing the grayscale value of droplets by an exponential decay function. The resulting plot of fluorescein concentration with time is shown in Fig. 7(b). Similar curves for top and bottom droplets are provided in Fig. S15 and S16,† respectively.
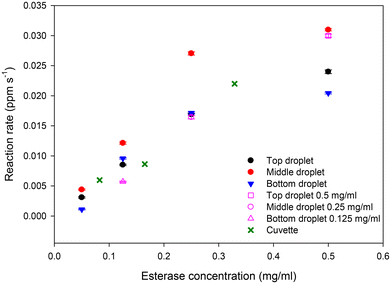
Fluorescein concentration between 40 and 250 s in Fig. 7(b) were fitted to straight lines to obtain reaction rates versus esterase concentrations. The concentration of esterase in merged droplets was between 0.05 and 0.5 mg ml−1 or 0.3 and 3 μM. The maximum concentration of FDA in merged droplets was 25 ppm or 60 μM. However, FDA was not fully soluble in PBS. Thus, it is likely that at high esterase concentrations, the reaction rate was substrate limited and hence the reaction rate versus esterase concentration reaches a maximum as shown in Fig. 8. We performed the same enzyme assay in a cuvette of 10 mm pathlength with the data plotted in Fig. 8. Linear regression on the reaction rates versus enzyme concentration for the cuvette (up to 0.329 mg ml−1) and three droplet positions (up to 0.25 mg ml−1) was performed to determine the rate constant (units ppm s−1 ml mg−1) and standard deviation of the rate constant. The final point at 0.5 mg ml−1 enzyme concentration in droplets was excluded because the rate was substrate limited. F tests with the null hypothesis that there is no significant difference at the 95% confidence level between the standard deviations of the rate constants for the cuvette and the three droplet positions were used to select the appropriate form of the t-test. T-test on the rate constants with the null hypothesis that there is no significant difference at the 95% confidence level in the rate constants between the cuvette and the three droplet positions. For the top and bottom droplets, there was no significant difference in the rate constants, but for the middle droplet there was a statistically significant difference in the rate constants.
We performed three repeats of merging columns of FDA and enzyme droplets to obtain droplets containing 25 ppm FDA and 0.25 mg ml−1 esterase. Based on Fig. 9, the average reaction rate in top, middle, and bottom droplets was 0.016 ± 0.003, 0.024 ± 0.004, and 0.015 ± 0.002 ppm s−1, respectively for the three repeats. This implies that the variability between repeats was between 12 and 18%. Several factors can contribute to variations between repeats including errors in manual pipetting 2 μl of each FDA and enzyme droplets at the two foci. Analysis of the errors in the major and minor axes of the 2 μl droplets as shown in Fig. S6† showed that the error in volume was ∼10% (0.19 μl). Furthermore, while the reaction rates in top and bottom droplets was comparable, the reaction rate in the middle droplet was ∼1.5 times higher than top/bottom droplet. This may be because of a higher degree of acoustic streaming in the middle droplet than the top and bottom droplets.
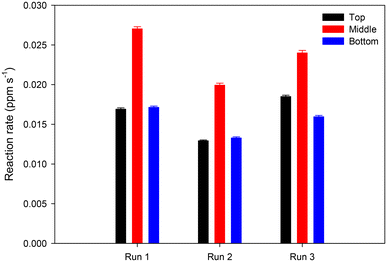 | ||
| Fig. 9 Reaction rates in merged droplets containing 25 ppm FDA and 0.25 mg ml−1 esterase for three repeats. | ||
Finally, to show that acoustically levitated and manipulated columns of droplets can allow parallelisation of assays, we merged droplets of 50 ppm FDA with either 1 mg ml−1 (top right droplet) or 0.5 mg ml−1 (middle right droplet) or 0.25 mg ml−1 (bottom right droplet) enzyme droplets simultaneously as shown in Movie S8.† Movie S8† clearly shows that, as expected, the reaction rate in the top droplet is the fastest followed by the middle droplet and is slowest in the bottom droplet. The reaction rates in droplets (shown by unfilled symbols in Fig. 8) when all three enzyme concentrations were studied simultaneously was comparable to the case when each enzyme concentration was studied sequentially. Thus, we have shown that it is possible to study the effect of different enzyme concentrations simultaneously in columns of acoustically levitated and manipulated droplets, opening the possibility of using this approach for parallelisation of chemical and biological reactions.
4. Conclusions
Unlike previous studies which have used one particle or droplet per focus, we have used the standing wave pattern formed above and below an acoustic focal point to levitate columns of droplets. Our acoustic levitator system comprised of a 16 × 16 array of 40 kHz phased array transducers (PATs) in its top and bottom surfaces, which were separated by ∼17.3 cm, and was integrated with a light source and two cameras to record colour images and fluorescence intensity of levitated droplets in real-time. We showed that a combination of checkerboard pattern for assigning PATs to two focal points with an analytical expression for calculating acoustic pressure allowed pairs of columns of levitated droplets to be moved smoothly while the timing and size of ramping down of the voltage used was key for reducing the atomisation of merged droplets.We have shown that our approach of trapping, moving, and merging columns of droplets is well suited for performing chemical and biological reactions as demonstrated by studying an exemplar fluorescein diacetate and esterase enzyme assay. We monitored fluorescence intensity of merged droplets and corrected for photobleaching and evaporation to determine reactions rates versus esterase concentration. We showed that the reaction rate in middle droplets was 1.5 times higher than top/bottom droplets, and may be a result of higher degree of acoustic streaming in the former than the latter. The variability of reactions rates between repeats was <20% and can be improved by minimising errors associated with manual dispensing of 2 μl or smaller droplets in traps. Future work will focus on increasing numbers of droplets per column and the total number of columns as well as automating the initial loading of the levitator.
Author contributions
Gupta acquired funding, did project administration and manage resources. All other activities were done by both authors. Both authors have given approval to the final version of the manuscript.Data availability
The datasets supporting this article have been uploaded as part of the ESI.†Conflicts of interest
Both authors declare no conflict of interest.Acknowledgements
This work was supported by the Leverhulme Trust [RPG-2021-137].References
- F. Shao, P.-W. Lee, H. Li, K. Hsieh and T.-H. Wang, Emerging Platforms for High-Throughput Enzymatic Bioassays, Trends Biotechnol., 2022, 41, 120 CrossRef PubMed.
- J. G. Houston and M. Banks, The Chemical-Biological Interface: Developments in Automated and Miniaturised Screening Technology, Curr. Opin. Biotechnol., 1997, 8, 734 CrossRef CAS PubMed.
- M. Dörr, M. P. C. Fibinger, D. Last, S. Schmidt, J. Santos-Aberturas, D. Böttcher, A. Hummel, C. Vickers, M. Voss and U. T. Bornscheuer, Fully Automatized High-Throughput Enzyme Library Screening Using a Robotic Platform, Biotechnol. Bioeng., 2016, 113, 1421 CrossRef PubMed.
- H. Becker and C. Gärtner, Microfluidics and the Life Sciences, Sci. Prog., 2012, 95, 175 CrossRef CAS PubMed.
- R. Schreiber, R. Altenburger, A. Paschke and E. Küster, How to Deal with Lipophilic and Volatile Organic Substances in Microtiter Plate Assays, Environ. Toxicol. Chem., 2009, 27, 1676 CrossRef.
- Y. Wen, R. Zang, X. Zhang and S.-T. Yang, A 24-Microwell Plate with Improved Mixing and Scalable Performance for High Throughput Cell Cultures, Process Biochem., 2012, 47, 612 CrossRef CAS.
- M. A. Urbina, A. J. R. Watts and E. E. Reardon, Labs Should Cut Plastic Waste Too, Nature, 2015, 528, 479 CrossRef CAS PubMed.
- T. N. Tombs and T. B. Jones, Digital Dielectrophoretic Levitation, Rev. Sci. Instrum., 1991, 62, 1072 CrossRef.
- Y. Ikezoe, N. Hirota, J. Nakagawa and K. Kitazawa, Making Water Levitate, Nature, 1998, 393, 749 CrossRef CAS; E. Beaugnon, D. Fabregue, D. Billy, J. Nappa and R. Tournier, Dynamics of Magnetically Levitated Droplets, Phys. B, 2001, 294–295, 715 CrossRef; P. Kauffmann, J. Nussbaumer, A. Masse, C. Jeandey, H. Grateau, P. Pham, G. Reyne and V. Haguet, Self-Arraying of Charged Levitating Droplets, Anal. Chem., 2011, 83, 4126 CrossRef PubMed.
- S. Santesson and S. Nilsson, Airborne Chemistry: Acoustic Levitation in Chemical Analysis, Anal. Bioanal. Chem., 2004, 378, 1704 CrossRef CAS PubMed.
- H. Bruus, Acoustofluidics 7: The Acoustic Radiation Force on Small Particles, Lab Chip, 2012, 12, 1014 RSC; L. P. Gor'kov, On the Forces Acting on a Small Particle in an Acoustical Field in an Ideal Fluid, Sov. Phys. - Dokl., 1962, 6, 773 Search PubMed.
- D. Foresti, M. Nabavi, M. Klingauf, A. Ferrari and D. Poulikakos, Acoustophoretic Contactless Transport and Handling of Matter in Air, Proc. Natl. Acad. Sci. U. S. A., 2013, 110, 12549 CrossRef CAS PubMed.
- R. H. Morris, E. R. Dye, D. Axford, M. I. Newton, J. H. Beale and P. T. Docker, Non-Contact Universal Sample Presentation for Room Temperature Macromolecular Crystallography Using Acoustic Levitation, Sci. Rep., 2019, 9, 12431 CrossRef CAS PubMed; M. A. B. Andrade, A. Marzo and J. C. Adamowski, Acoustic Levitation in Mid-Air: Recent Advances, Challenges, and Future Perspectives, Appl. Phys. Lett., 2020, 116, 250501 CrossRef.
- E. H. Brandt, Suspended by Sound, Nature, 2001, 413, 474 CrossRef CAS PubMed; F. Zhang and Z. Jin, The Experiment of Acoustic Levitation and the Analysis by Simulation, Open Access Libr. J., 2018, 5, 1 Search PubMed.
- Y. Ochiai, T. Hoshi and J. Rekimoto, Three-Dimensional Mid-Air Acoustic Manipulation by Ultrasonic Phased Arrays, PLoS One, 2014, 9, e97590 CrossRef CAS PubMed; A. Marzo, S. A. Seah, B. W. Drinkwater, D. R. Sahoo, B. Long and S. Subramanian, Holographic Acoustic Elements for Manipulation of Levitated Objects, Nat. Commun., 2015, 6, 8661 CrossRef PubMed.
- A. Marzo and B. W. Drinkwater, Holographic Acoustic Tweezers, Proc. Natl. Acad. Sci. U. S. A., 2019, 116, 84 CrossRef CAS PubMed.
- L. Cox, A. Croxford and B. W. Drinkwater, Dynamic Patterning of Microparticles with Acoustic Impulse Control, Sci. Rep., 2022, 12, 14549 CrossRef CAS PubMed.
- K. Melde, H. Kremer, M. Shi, S. Seneca, C. Frey, I. Platzman, C. Degel, D. Schmitt, B. Schölkopf and P. Fischer, Compact Holographic Sound Fields Enable Rapid One-Step Assembly of Matter in 3D, Sci. Adv., 2023, 9, eadf618 Search PubMed; K. Melde, A. G. Mark, T. Qiu and P. Fischer, Holograms for Acoustics, Nature, 2016, 537, 518 CrossRef CAS PubMed; G. Memoli, M. Caleap, M. Asakawa, D. R. Sahoo, B. W. Drinkwater and S. Subramanian, Metamaterial Bricks and Quantization of Meta-Surfaces, Nat. Commun., 2017, 8, 14608 CrossRef PubMed.
- R. Songsaeng, N. J. Goddard and R. Gupta, An Investigative Study into an Oscillatory Reaction in Acoustically Levitated Droplets, RSC Adv., 2023, 13, 3002 RSC.
- R. Hirayama, D. M. Plasencia, N. Masuda and S. Subramanian, A Volumetric Display for Visual, Tactile and Audio Presentation Using Acoustic Trapping, Nature, 2019, 575, 320 CrossRef CAS PubMed; Y. Ochiai, T. Hoshi and J. Rekimoto, Pixie Dust: Graphics Generated by Levitated and Animated Objects in Computational Acoustic-Potential Field, ACM Trans. Graph., 2014, 33, 85 CrossRef.
- M. A. B. Andrade, T. S. A. Camargo and A. Marzo, Automatic Contactless Injection, Transportation, Merging, and Ejection of Droplets with a Multifocal Point Acoustic Aevitator, Rev. Sci. Instrum., 2018, 89, 125105 CrossRef PubMed.
- V. Contreras and K. Volke-Sepúlveda, Enhanced standing-wave acoustic levitation using high-order transverse modes in phased array ultrasonic cavities, Ultrasonics, 2024, 138, 107230 CrossRef PubMed.
- C. A. Schneider, W. S. Rasband and K. W. Eliceiri, NIH Image to ImageJ: 25 years of image analysis, Nat. Methods, 2012, 9, 671 CrossRef CAS PubMed.
- R. Gupta and N. J. Goddard, A proof-of-principle study for performing enzyme bioassays using substrates immobilized in a leaky optical waveguide, Sens. Actuators, B, 2017, 244, 549 CrossRef CAS.
Footnote |
| † Electronic supplementary information (ESI) available. See DOI: https://doi.org/10.1039/d4an01096e |
| This journal is © The Royal Society of Chemistry 2024 |

