Sensitive determination of 4,6-dinitro-o-cresol based on a glassy carbon electrode modified with Zr-UiO-66 metal–organic framework entrapped FMWCNTs†
Ranjit
Hazarika
a,
Gullit
Deffo
 ab,
Honore Nogholesso
Wamba
c,
Nayab
Hussain
 a,
Shyamali
Kalita
a,
Mwina
Basumatary
a,
Evangéline
Njanja
b,
Soumen
Dasgupta
c and
Panchanan
Puzari
a,
Shyamali
Kalita
a,
Mwina
Basumatary
a,
Evangéline
Njanja
b,
Soumen
Dasgupta
c and
Panchanan
Puzari
 *a
*a
aDepartment of Chemical Sciences, Tezpur University, Tezpur, Assam 784028, India. E-mail: pancha@tezu.ernet.in
bElectrochemistry and Chemistry of Materials, Department of Chemistry, Faculty of Science, University of Dschang, P.O. Box 67, Dschang, Cameroon
cCSIR-Indian Institute of Petroleum, Dehradun, 248005, Uttarakhand, India
First published on 22nd November 2023
Abstract
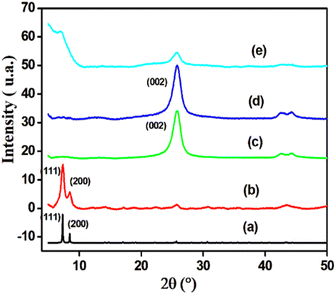
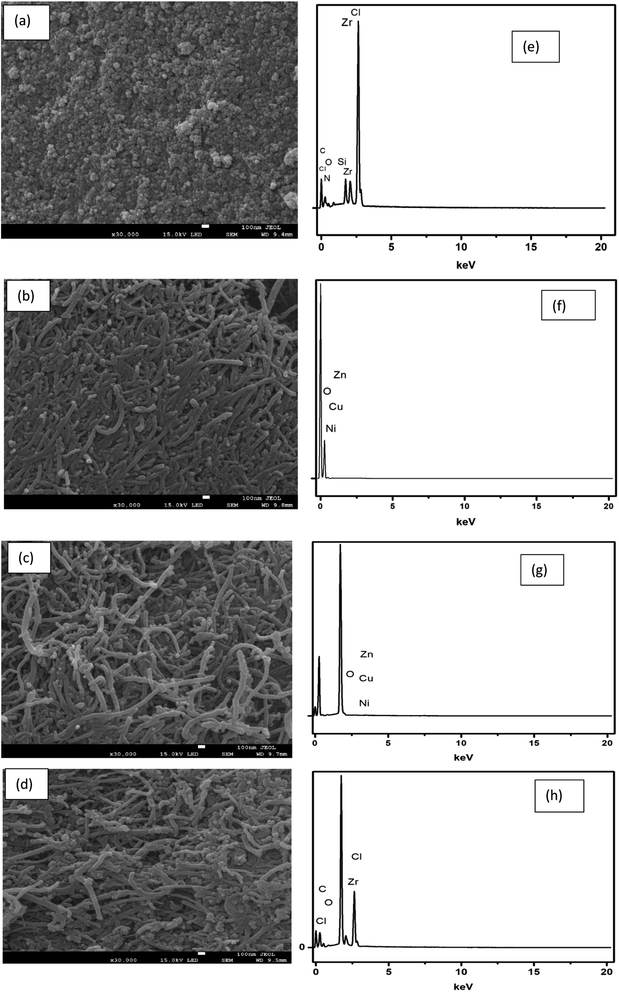
A DNOC electrochemical sensor has been developed by using a composite of Zr-UiO-66 and FMWCNTs on a glassy carbon electrode (GCE) and using the differential pulse voltammetry technique. The synthesized materials were physico-chemically characterized by BET, PXRD, FTIR, TGA, EDX, and FESEM. Cyclic voltammetry showed that DNOC has three oxidation peaks at 0.03 V (RSD: 0.23%), 0.42 V (RSD: 0.21%), and 1.32 V (RSD: 0.32%) and three reduction peaks at – 0.20 V (RSD: 0.15%), – 0.82 V (RSD: 0.26%), and – 1.14 V (RSD: 0.19%) which follow a diffusion-controlled mechanism. Different parameters were optimized using differential pulse voltammetry and good linear ranges were found for the simultaneous detection of the three reduction peaks. For a specific concentration range of 0.1–50 μM, a limit of detection of 0.119 μM based on 3Sb/m was obtained. The interfering effects of five non-phenolic pesticides and five heavy metals were evaluated to highlight the selectivity of the developed sensor. It is the first report of an electrochemical DNOC sensor in which all three oxidation peaks are prominently visible. Ethion and chloropyriphos were found to inhibit the redox process of DNOC on the developed sensor platform Zr-UiO-66/FMWCNT/GCE. The sensor was successfully applied to DNOC determination in spiked potato samples and the results showed a standard deviation of less than 3%. The proposed method is expected to provide a novel platform for the quantitative determination of DNOC pesticides in vegetables.
1. Introduction
Development of fast, easy, and less expensive methods for pesticide detection is gaining significant research focus nowadays owing to the emergent need to check the degradation of the environment as well as to protect human health.1 Traditionally pesticides are detected by different instrumental techniques such as GC,2 HPLC,3 LC-MS,4,5 GC-MS,6etc. However, these methods, although reliable, require time-consuming work-up steps, costly equipment, and trained personnel to run the equipment and hence are not adapted for routine analysis and field deployment. Due to these shortcomings, there has been a constant research effort over decades for the development of better detection methodologies for pesticides in terms of selectivity, sensitivity, ease of preparation, cost, and miniaturization prospects. Among such methods, electrochemical methods are found to be the candidate of choice and are extensively studied.7–104,6-Dinitro-o-cresol also called 2-methyl-4,6-dinitrophenol abbreviated as DNOC is one of the most toxic pollutant herbicides used in farming to control insects in plantations, especially in wheat, maize, and potato.11,12 It is a pesticide with a long half-life and is strongly non-biodegradable and can accumulate in water with concentrations often greater than 5 × 10⁻⁹ M. This concentration is almost equal to the ADI (acceptable daily intake) of 0.001 mg per kg per day.11,13,14 Looking at its harmful effect on animals, the US-EPA banned its use in 1978 and the European countries prohibited its use between 1999 and 2004.15 However, many third-world countries are still using it largely in agriculture and this emphasizes the importance of developing an efficient method for easy and fast detection of this pesticide in agricultural products and water. Like other pesticides, DNOC is also conventionally analysed by using instrumental techniques such as spectrophotometry,16 liquid chromatography,17 and gas chromatography coupled mass spectrometry (GCMS) with different detectors.18 The few simple, less expensive non-conventional techniques developed for DNOC detection include polarography with mercury electrodes,19–24 non-polarographic methods such as molecularly imprinted polymers (MIPs),12 and stripping square wave voltammetry (SSWV).25
In the last few decades, the use of nanocomposites for development of various electrochemical sensors has almost dominated the electrochemistry literature.26–28 Within this domain, multiwall carbon nanotubes (MWCNTs) and their carboxylic functionalized form (MWCNT-COOH or FMWCNTs) have been widely employed in the development of electrochemical sensors, due to their high surface area and excellent conducting properties.29 Functionalization of MWCNTs with COOH functional groups helps further modification of the surface with tunable properties and also improves their conducting properties. Another class of advanced materials that has garnered considerable attention in recent times due to their structural diversity, large specific surface area, and high porosity30 is metal–Organic frameworks (MOFs). Their applications cover a wide range of fields including the environment,31 medical treatment,32 energy,33 gas sensing, and separation.34 Among MOFs, UiO-66(Zr) is gaining significant research applications due to its simple synthesis protocol, microporous structure, and ability to selectively adsorb specific substances or produce a crystal fluorescence effect by group modification.35,36 In these applications, it is used either in composite form37 or in the form of covalent linkage.38 Owing to the presence of the –NH2 functional group, it is an excellent coupling matrix for FMWCNTs which can further be tailored for specific targeted applications.
In this work, we have used the Zr-UiO-66/FMWCNT composite matrix for the development of an electrochemical sensor for DNOC. It is the first method of this kind that is able to detect all three redox peaks of DNOC.
2. Experimental
2.1. Reagents and instruments
Dinitro-ortho-cresol, 2-aminoterephthalic acid (99%), and MWCNTs (90 wt%, D X L = 110–170 nm × 5–9 μm) were purchased from Sigma-Aldrich. All other chemicals were purchased from Merck, Fisher, and SRL. Chemicals and reagents were used as received without any purification. The instruments used were an ATW2, IOS9001 for EDX; a Bruker AXS D8 Focus for XRD; a PerkinElmer Frontier MIR-FIR for FTIR; a JEOL JSM 6390LV for SEM; a TA-60WS for thermogravimetric (TGA) analysis; and a Biologic SP-300-EC-Lab software setup for electrochemical characterization and analysis.2.2. Synthesis of Zr-UiO-66
Zr-UiO-66 was synthesized using the method described by Katz et al.39 Specifically, ZrCl4 (125 mg, 0.54 mmol) was loaded in a 25 mL screw cap bottle containing 5 mL of DMF. 1 mL of concentrated HCl was added, and the mixture was sonicated for 20 minutes. 2-Aminoterephthalic acid H2BDC-NH2 (134 mg, 0.75 mmol) and 10 mL of DMF were then added, and the mixture was sonicated for 20 minutes before being heated at 80 °C overnight. The yellow solid thus obtained was then filtered and washed with DMF and EtOH. The sample was washed for several hours to remove all residual solvent and dried at 110 °C under vacuum overnight.2.3. Synthesis of FMWCNTs
The FMWCNT synthesis procedure used in this work is based on that described by Anshori et al., 2021 and Zhang et al., 2014.29,40 Properly, the first step was to make a 40 mL solution with a 3.1 ratio of HNO3 and H2SO4. Subsequently, 100 mg of MWCNTs was added to the solution, which was then stirred using a magnetic stirrer for 4 h at 70 °C under reflux conditions. The solution was diluted with 500 mL of distilled water. The next step was to filter and wash the solution with distilled water using Whatman filter paper. The filtration product was dried in a vacuum at 60 °C overnight to obtain FMWCNTs.2.4. Preparation of working electrode Zr-UiO-66/FMWCNT/GCE
Prior to its modification, the glassy carbon electrode (GCE) was polished with different sizes of alumina powder (1; 0.3, and 0.05 μm sizes) and then sonicated in a 1.1 ethanol–water solution for 5 min. 1 mg of Zr-UiO-66 and 2 mg of FMWCNTs were ultrasonically dispersed in 2 mL of DMF for 30 minutes to produce a homogeneous Zr-UiO-66/FMWCNT dispersion. The GCE surface was coated with 10 μL of the resulting dispersion and dried in an oven at 60 °C for 20 minutes to obtain a thin film on the working electrode (referred to as Zr-UiO-66/FMWCNT/GCE). For comparison studies, a GCE, Zr-UiO-66/GCE, and FMWCNT/GCE were also prepared by a similar procedure.2.5. Electrochemical procedures
Cyclic voltammetry (CV) and electrochemical impedance spectroscopy (EIS) techniques were used for characterization while the differential pulse voltammetry (DPV) technique was used for the quantitative measurement of DNOC. A system of three electrodes was used with the bare and modified GCE as the working, a platinum wire as the auxiliary, and Ag/AgCl (3.5 M KCl) as the reference electrode. DPV was run in 3 mL of analyte solution containing 0.1 M acetate buffer (pH 5). CV was recorded from 1.7 to −1.5 V at a scan rate of 100 mV s−1 and DPV was recorded from 0.5 V to −0.8 V at step potential 5 mV; amplitude 60 mV; pulse width 0.05 s; sample width 0.01 s and pulse period 0.2 s for all measurements. EIS were recorded in the frequency range from 1 MHz to 0.1 Hz at a potential of 0.2 V using 5 mM [Fe (CN)6]3−/4− prepared in 0.1 M KCl.2.6. Procedures of spiked sample analysis
The modern extraction technique QuEChERS has been used to validate the reliability of the elaborated sensor for DNOC determination in potatoes.41 Two beakers each containing 10 grams of chopped potato were doped with 5 mL of 0 and 0.5 μM DNOC solution and homogenized for 15 minutes. Then 5 mL of acetate buffer was added to each container and shaken in a vortex shaker vigorously for 10 minutes. 2 grams of MgSO4·H2O and 0.5 grams of NaCl were added, and the mixture was agitated for 5 minutes. After that, 1 gram of sodium citrate dihydrate and 0.5 gram of sodium hydrogen citrate sesquihydrate were added to the mixture and shaken at high speed in a vortex for 1 minute before being sonicated for 5 minutes. The different mixtures were centrifuged at 3000 rpm for 15 minutes. Then, 5 mL was taken from the supernatant, treated with 125 mg of primary secondary amine and 750 mg of MgSO4·4H2O, shaken for 1 minute before being sonicated for 5 minutes, and centrifuged once more in the same conditions. The supernatant of each of the two solutions was collected and used for the study considering a dilution factor of 2.3. Results and discussion
3.1. Physicochemical characterization of materials
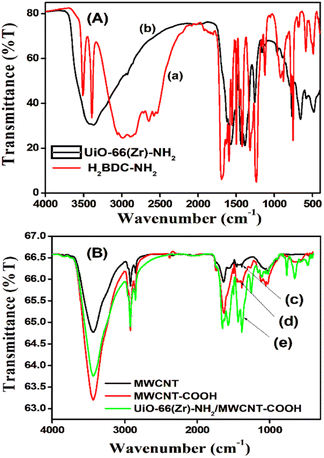
![[double bond, length as m-dash]](https://www.rsc.org/images/entities/char_e001.gif) O stretching (1600 cm−1), N–H bending (1400 cm−1), aromatic C–N stretching (1300 cm−1), and Zr–O vibrational bands (600 cm−1).42,43 Spectra of MWCNTs (Fig. 1B-c) show intense peaks at 3430 cm−1 (attributed to OH stretching of COOH originating from reactions of MWCNTs with the atmosphere), 2915 cm−1 (C–H stretching of alkyl and aromatic compounds), 2840 cm−1 (deformation of aromatic compounds), and 1660–479 cm−1 (C
O stretching (1600 cm−1), N–H bending (1400 cm−1), aromatic C–N stretching (1300 cm−1), and Zr–O vibrational bands (600 cm−1).42,43 Spectra of MWCNTs (Fig. 1B-c) show intense peaks at 3430 cm−1 (attributed to OH stretching of COOH originating from reactions of MWCNTs with the atmosphere), 2915 cm−1 (C–H stretching of alkyl and aromatic compounds), 2840 cm−1 (deformation of aromatic compounds), and 1660–479 cm−1 (C![[double bond, length as m-dash]](https://www.rsc.org/images/entities/char_e001.gif) O and C
O and C![[double bond, length as m-dash]](https://www.rsc.org/images/entities/char_e001.gif) C stretching and their deformations). In the case of Zr-UiO-66/FMWCNT (Fig. 1B-e), absorption peaks shown were at the same position as those of MWCNTs (Fig. 1B-c) and FMWCNTs (Fig. 1B-d), except in the region 800–400 cm−1 and with increasing intensity as expected from the composite.44,45
C stretching and their deformations). In the case of Zr-UiO-66/FMWCNT (Fig. 1B-e), absorption peaks shown were at the same position as those of MWCNTs (Fig. 1B-c) and FMWCNTs (Fig. 1B-d), except in the region 800–400 cm−1 and with increasing intensity as expected from the composite.44,45
3.2. Electrochemical characterization
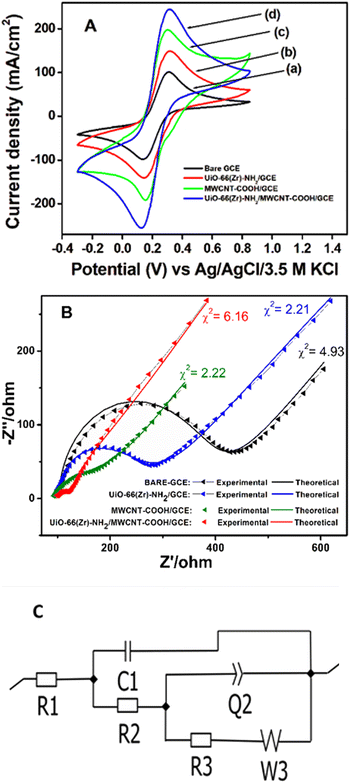
CV and EIS measurements were used to characterize the modified electrodes in 5 mM [Fe (CN)6]3−/4− in 0.1 M KCl. It is seen from the cyclic voltammogram plot (Fig. 4A) that the peak current density of Zr-UiO-66/FMWCNT/GCE is the highest and 2.25 times greater than that of the bare GCE. The reason for higher peak current density is the electrostatic attraction of Zr-UiO-66/FMWCNT with [Fe (CN)6]3−/4−, as –NH2 of the MOF becomes NH3+ at pH 5 leading to a huge effective electro-active surface area of the modified electrode. Electrochemical impedance spectroscopy (EIS) also corroborates the CV analysis results. The charge transfer resistances (within parenthesis in ohm) determined using the Levenberg–Marquard algorithm followed the trend bare GCE (299.4) > Zr-UiO-66/GCE (159.5) > FMWCNT/GCE (99.84) > Zr-UiO-66/FMWCNT/GCE (23.97) as seen in Fig. 4B. From the Randles Sevick equation (more details in Fig. SI-2†), the active surface area obtained with the bare GCE is 0.004 cm2 whereas for Zr-UiO-66/FMWCNT/GCE it is 0.009 cm2, showing that the active surface of the modified electrode is 2.25 times higher than the one of the bare GCE.The heterogeneous rate constant (k0) determined by using eqn (1) was found to be 4.25 × 10⁻², 5.02 × 10⁻², 5.91 × 10⁻² and 7.53 × 10⁻² respectively for GC, MOF-GC, FMWCNT-GC and MOF-FMWCNT-GC electrodes. The k0 values indicate that with the loading of the electrode surface with different electro-active materials, the rate constant increases which is attributed to increased porosity of the surface and catalytic action (further details in ESI SI-3†).
 | (1) |
3.3. Electrochemical analysis of DNOC
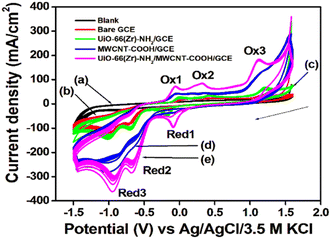
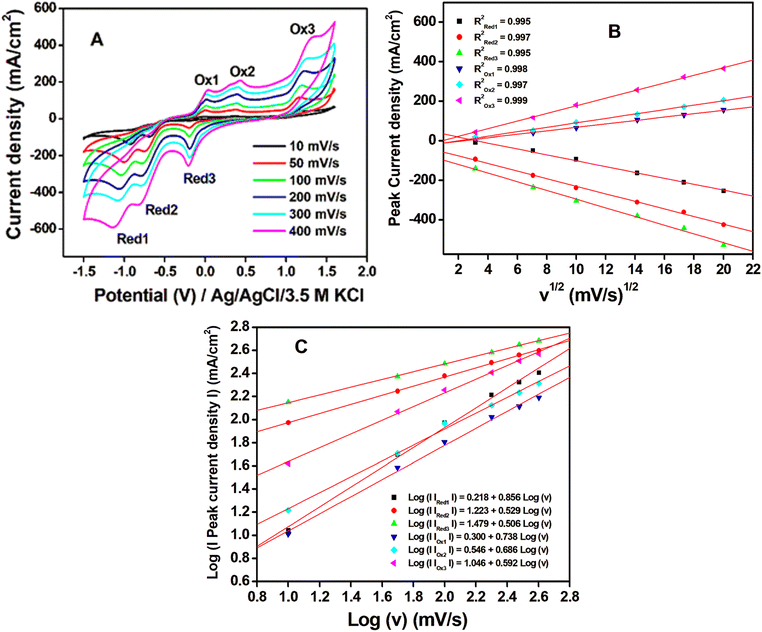
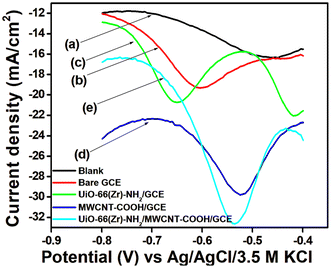
![[double bond, length as m-dash]](https://www.rsc.org/images/entities/char_e001.gif) O) of product 2, and Red2 corresponds to the reversible process. System three corresponds to the reduction of the keto group in product 2 to the OH group in product 3, and Ox3 is assigned to the corresponding reversible process. A similar mechanism was reported earlier by other authors for DNOC oxidation–reduction while analyzing with MWCNT-modified glassy carbon electrodes.12,48–50 However, this is the first time that a sensor is able to detect all three systems simultaneously. Product 3 appears to be more stable and has the highest peak current density, which is the reason for selecting the corresponding potential region for quantitative estimation of DNOC in this work.
O) of product 2, and Red2 corresponds to the reversible process. System three corresponds to the reduction of the keto group in product 2 to the OH group in product 3, and Ox3 is assigned to the corresponding reversible process. A similar mechanism was reported earlier by other authors for DNOC oxidation–reduction while analyzing with MWCNT-modified glassy carbon electrodes.12,48–50 However, this is the first time that a sensor is able to detect all three systems simultaneously. Product 3 appears to be more stable and has the highest peak current density, which is the reason for selecting the corresponding potential region for quantitative estimation of DNOC in this work.
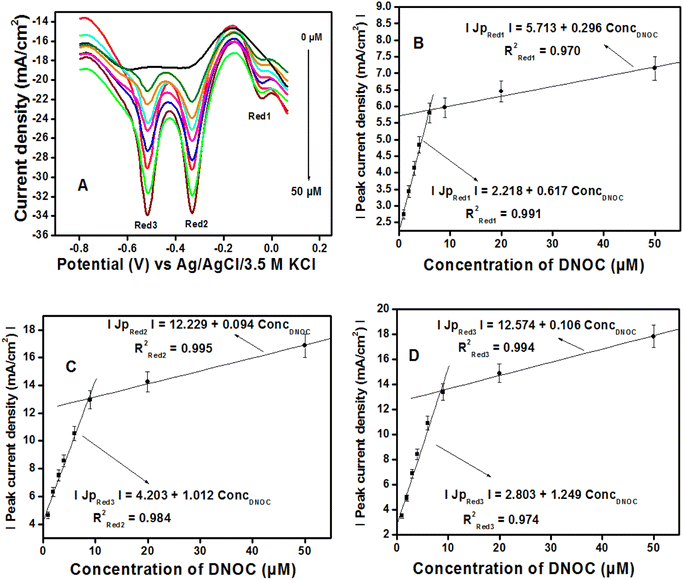 | ||
| Fig. 9 (A) Differential pulse voltammogram curves obtained by varying concentrations of DNOC (0; 0.1; 1.5; 3; 4.5; 6.5; 9; 20 and 50 μM). (B–D) The corresponding calibration curves. | ||
| Modification | Techniques | Detection range (μM) | LOD (μM) | Reference |
|---|---|---|---|---|
| Differential pulse polarography/DME | DPP | 2–10 | 0.1 | 54 |
| Graphite detector | Reverse-phase HPLC | 0.2–0.5 | 0.1 | 55 |
| Carbopack | Liquid–solid extraction/HPLC | 10–40 | 5 | 56 |
| m-AgSAE | DPV | 0.2–1 | 0.2 | 57 |
| Hide-powder/CPE | CV/DPV | 0.005–25.2 | 0.016 | 58 |
| SbFE/GCE | CSWSV | 1.0–15 | 1.12 | 59 |
| GCE/MWCNT/CEF-SiO2@Fe3O4 | CV/SWV | 0.0001–0.15 | 0.0001 | 11 |
| HMDE | SWSV | 0.01–0.55 | 0.02 | 25 |
| Zr-UiO-66/FMWCNT/GCE | CV/DPV | 0.1–50 | 0.119 | This work |
| Extract samples | Found (μM) | Expected (μM) | RSD (%) | Spiked (μM) | Found (μM) | Expected (μM) | RSD (%) |
|---|---|---|---|---|---|---|---|
| a PE = potato extract. | |||||||
| 0 μM DNOC in PE | 0 | — | — | 2 | 1.871 | 2 | 1.498 |
| 1.846 | |||||||
| 1.902 | |||||||
| 4 | 3.836 | 4 | 2.694 | ||||
| 3.643 | |||||||
| 3.692 | |||||||
| 0.5 μM DNOC in PE | 0.225 | 0.25 | 2.937 | 2 | 1.973 | 2.227 | 2.255 |
| 1.998 | |||||||
| 0.234 | 2.061 | ||||||
| 4 | 3.927 | 4.227 | 1.783 | ||||
| 0.221 | 3.984 | ||||||
| 3.845 | |||||||
4. Conclusions
An electrochemical sensor based on the composite of zirconium metal–organic framework, Zr-UiO-66, and carboxylic functionalized multiwalled carbon nanotubes, FMWCNTs, has been developed for the detection of phenolic pesticide DNOC. Sensor parameters such as film composition, electrolyte concentration, pH, stability, repeatability, reproducibility, selectivity etc. have been studied. Quantification of DNOC in spiked potato extract reveals satisfactory performance of the sensor. The interfering effects of five different pesticides and five heavy metal ions on the sensor response were studied and it was found that ethion and chloropyriphos inhibit the reduction peak of DNOC with a relatively higher degree of inhibition by the former. No significant interference was shown by the other pesticides and the heavy metals. The exceptional features of the sensor are 1. This is the first report of an electrochemical DNOC sensor that is capable of detecting simultaneously all three redox peaks of DNOC and 2. Its electrochemical responses to DNOC are inhibited by certain other pesticides. The later observation has opened up a new and interesting area for further investigation. Advantages of the present sensor over the other reported sensors includes 1. The highest linear range of detection with an appreciably lower detection limit and 2. A high sensitivity (1249 mA mM−1).Author contributions
Ranjit Hazarika. Formal analysis, methodology, investigation, writing original draft. Gullit Deffo. Formal analysis, methodology, investigation. Honore Nogholesso Wamba. Methodology, synthesis, editing. Nayab Hussain. Methodology, review, editing. Shymali Kalita. Investigation, editing. Mwina Basumatary. Methodology, editing. Evangéline Njanja. Methodology, review, validation. Soumen Dasgupta. Methodology, synthesis, validation. Panchanan Puzari. Conceptualization, methodology, writing, review, editing, validation, supervision, project administration.Conflicts of interest
The authors declare that there are no competing financial interests associated with this work or personal relationships that can influence the work reported in this paper.Acknowledgements
Prof. P. Puzari gratefully acknowledges the Science and Engineering Research Board, SERB- DST Govt. of India, for financial support to carry out the research work through grant number EMR/2016/001711.References
- L. Xu, A. M. Abd El-Aty, J. B. Eun, J. H. Shim, J. Zhao, X. Lei, S. Gao, Y. She, F. Jin, J. Wang and M. Jin, Recent advances in rapid detection techniques for pesticide residue. a review, J. Agric. Food Chem., 2022, 70, 13093–13117 CrossRef.
- H. A. Sapahin, A. Makahleh and B. Saad, Determination of organophosphorus pesticide residues in vegetables using solid phase micro-extraction coupled with gas chromatography–flame photometric detector, Arab. J. Chem., 2019, 12, 1934–1944 CrossRef.
- S. Z. Zaidon, Y. B. Ho, H. Hamsan, Z. Hashim, N. Saari and S. M. Praveena, Improved QuEChERS and solid phase extraction for multi-residue analysis of pesticides in paddy soil and water using ultra-high performance liquid chromatography tandem mass spectrometry, Microchem. J., 2019, 145, 614–621 CrossRef.
- L. Song, W. Zeng, A. Li, C. Pan and L. Pan, Automated multi-plug filtration cleanup method for analysis of 48 pesticide residues in green tea using liquid chromatography-tandem mass spectrometry, Food Control, 2022, 131, 108436 CrossRef.
- E. Tóth, A. Tölgyesi, A. Simon, M. Bálint, X. Ma and V. K. Sharma, An alternative strategy for screening and confirmation of 330 pesticides in ground-and surface water using liquid chromatography-tandem mass spectrometry, Molecules, 2022, 27, 1872 CrossRef.
- S. V. Dozein, M. Masrournia, Z. Es’ haghi and M. R. Bozorgmehr, Development of a new magnetic dispersive solid-phase microextraction coupled with GC-MS for the determination of five organophosphorus pesticides from vegetable samples, Food Anal. Methods, 2021, 14, 674–686 CrossRef.
- C. R. Umapathi, S. M. Ghoreishian, S. Sonwal, G. M. Rani and Y. S. Huh, Portable electrochemical sensing methodologies for on-site detection of pesticide residues in fruits and vegetables, Coord. Chem. Rev., 2022, 453, 214305 CrossRef.
- R. R. Dutta and P. Puzari, Amperometric biosensing of organophosphate and organocarbamate pesticides utilizing polypyrrole entrapped acetylcholinesterase electrode, Biosens. Bioelectron., 2014, 52, 166–172 CrossRef CAS.
- H. Borah, S. Gogoi, S. Kalita and P. Puzari, A broad spectrum amperometric pesticide biosensor based on glutathione S-transferase immobilized on graphene oxide-gelatin matrix, J. Electroanal. Chem., 2018, 828, 116–123 CrossRef CAS.
- H. Borah, R. R. Dutta, S. Gogoi, T. Medhi and P. Puzari, Glutathione-S-transferase-catalyzed reaction of glutathione for electrochemical biosensing of temephos, fenobucarb and dimethoate, Anal. Methods, 2017, 9, 4044–4051 RSC.
- M. Irandoust, M. Haghighi, A. A. Taherpour and N. Zolfaghar, Electrochemical sensing of 2-methyl-4, 6-dinitrophenol by nanomagnetic core shell linked to carbon nanotube modified glassy carbon electrode, Mater. Sci. Eng. C, 2019, 99, 211–221 CrossRef CAS.
- A. Gomez-Caballero, N. Unceta, M. A. Goicolea and R. J. Barrio, Evaluation of the selective detection of 4,6-dinitro-o-cresol by a molecularly imprinted polymer-based microsensor electrosynthesized in a semiorganic media, Sens. Actuators, B, 2008, 130, 713 CrossRef CAS.
- FAO, Revised guidelines on good labelling practices for pesticides, FAO, Rome, 1995 Search PubMed.
- Rotterdam Convention – Operation of the Prior Informed Consent (PIC) procedure for banned or severely restricted chemicals DNOC, http://www.pic.int/Portals/5/DGDs/DGD_DNOC_EN.pdf Search PubMed.
- P. Jeschke, R. Nauen, M. Schindler and A. Elbert, Overview of the status and global strategy for neonicotinoids, J. Agric. Food Chem., 2011, 59, 2897–2908 CrossRef PubMed.
- E. Uzer, H. Ercag, R. Parlar, R. Apak and H. Filik, Spectrophotometric determination of 4,6-dinitro-o-cresol (DNOC) in soil and lemon juice, Anal. Chim. Acta, 2006, 580, 83–90 CrossRef PubMed.
- C. M. Santana, Z. S. Ferrera and J. J. S. Rodriguez, Extraction and determination of phenolic derivatives in water samples by using polyoxyethylene surfactants and liquid chromatography with photodiode array detection, J. A. O. A. C. Int., 2004, 87, 166–171 CrossRef PubMed.
- F. Jaber, C. Schummer, J. Chami, P. Mirabel and M. Millet, Solid-phase microextraction and gas chromatography-mass spectrometry for analysis of phenols and nitrophenols in rainwater, as their t-butyldimethylsilyl derivatives, Anal. Bioanal. Chem., 2007, 387, 2527–2535 CrossRef PubMed.
- J. Polak, Determination of the pesticides dinoseb and DNOC in waters by differential pulse polarography, Chem. Listy, 1983, 77, 306–314 Search PubMed.
- J. Barek, A. G. Fogg, A. Muck and J. Zima, Polarography and voltammetry at mercury electrodes, Crit. Rev. Anal. Chem., 2001, 31, 291–309 CrossRef.
- J. Gajdar, E. Horakova, J. Barek, J. Fischer and V. Vyskocil, Recent applications of mercury electrodes for monitoring of pesticides, a critical review, 2016, 28, 1–14 CrossRef.
- H. J. Ferrari, Polarographic determination of an aromatic nitro compound in the presence of an aromatic amine compound, Microchem. J., 1964, 8, 160–168 CrossRef.
- A. Mikotajek, Die polarographische Bestimmung von 4, 6-Dinitro-o-Kresol (DNOC) in Blut und Blutgerinnseln, Microchim. Acta, 1969, 57, 1229–1236 CrossRef.
- M. Kotouček and M. Opravilová, Voltammetric behaviour of some nitropesticides at the mercury drop electrode, Anal. Chim. Acta, 1996, 329, 73–81 CrossRef.
- M. Cuellar, J. M. Betancourth, V. Pfaffen and P. I. Ortiz, Response surface methodology for optimisation of 4,6-Dinitro-o-cresol quantification using hanging mercury drop electrode, Int. J. Environ. Anal. Chem., 2019, 99, 74–86 CrossRef.
- Z. Liu, J. Tao, Z. Zhu, Y. Zhang, H. Wang, P. Pang, H. Wang and W. Yang, A sensitive electrochemical assay for T4 polynucleotide kinase activity based on Fe3O4@ TiO2 and gold nanoparticles hybrid probe modified magnetic electrode, J. Electrochem. Soc., 2022, 169(2), 027504 CrossRef CAS.
- H. Zhang, Z. Xing, M. Pan, H. Wang and Y. Liu, highly sensitive and selective electrochemical determination of 4-aminophenol based on flower-like Ag-Au nanocomposites modified glassy carbon electrode, J. Electrochem. Soc., 2020, 167, 126504 CrossRef CAS.
- H. Wang, H. Zhang, Y. Zhang, H. Chen, L. Xu, K. Huang and Y. Liu, Tungsten disulfide nano-flowers/silver nanoparticles composites based electrochemical sensor for theophylline determination, J. Electrochem. Soc., 2015, 162, B173 CrossRef CAS.
- I. Anshori, L. N. Rizalputri, R. R. Althof, S. S. Surjadi, S. Harimurti, G. Gumilar, B. Yuliarto and M. Handayani, Functionalized multi-walled carbon nanotube/silver nanoparticle (f-MWCNT/AgNP) nanocomposites as non-enzymatic electrochemical biosensors for dopamine detection, Nanocomposites, 2021, 7, 97–108 CrossRef CAS.
- C. Liu, J. Wang, J. Wan and C. Yu, MOF-on-MOF hybrids. Synthesis and applications, Coord. Chem. Rev., 2021, 432, 213743 CrossRef CAS.
- Z. Zhai, X. Zhang, J. Wang, H. Li, Y. Sun, X. Hao, Y. Qin, B. Niu and C. Li, Washable and flexible gas sensor based on UiO-66-NH2 nanofibers membrane for highly detecting SO2, Chem. Eng. J., 2022, 428, 131720 CrossRef CAS.
- N. Rabiee, A. M. Ghadiri, V. Alinezhad, A. Sedaghat, S. Ahmadi, Y. Fatahi, P. Makvandi, M. R. Saeb, M. Bagherzadeh, M. Asadnia and R. S. Varma, Synthesis of green benzamide-decorated UiO-66-NH2 for biomedical applications, Chemosphere, 2022, 299, 134359 CrossRef CAS PubMed.
- S. P. Tripathy, S. Subudhi, A. Ray, P. Behera, G. Swain, M. Chakraborty and K. Parida, MgIn2S4/UiO-66-NH2 MOF-Based Heterostructure. Visible-Light-Responsive Z-Scheme-Mediated Synergistically Enhanced Photocatalytic Performance toward Hydrogen and Oxygen Evolution, Langmuir, 2023, 39, 7294–7306 CrossRef CAS PubMed.
- K. Jayaramulu, M. E. Dmello, K. Kesavan, A. Schneemann, M. Otyepka, S. Kment, C. Narayana, S. B. Kalidindi, R. S. Varma, R. Zboril and R. A. Fischer, A multifunctional covalently linked graphene–MOF hybrid as an effective chemiresistive gas sensor, J. Mater. Chem. A, 2021, 9, 17434–17441 RSC.
- I. A. Lazaro and R. S. Forgan, Application of zirconium MOFs in drug delivery and biomedicine, Coord. Chem. Rev., 2019, 380, 230–259 CrossRef.
- M. Wu, Q. Zhang, Q. Zhang, H. Wang, F. Wang, J. Liu, L. Guo and K. Song, Research progress of UiO-66-based electrochemical biosensors, Front. Chem., 2022, 10, 842894 CrossRef CAS.
- L. Ma, Y. Wan, T. Wang, Y. Liu, Y. Yin and L. Zhang, Self-Assembled CMC/UiO-66-NH2 Membrane with Anti-Crude Oil Adhesion Property for Highly Efficient Oil–Water Separation, Langmuir, 2022, 38, 12499–12509 CrossRef CAS PubMed.
- Y. Y. Xing, J. Wang, C. X. Zhang and Q. L. Wang, High Proton Conductivity of the UiO-66-NH2-SPES Composite Membrane Prepared by Covalent Cross-Linking, ACS Appl. Mater. Interfaces, 2023, 15, 33003–33012 CrossRef PubMed.
- M. J. Katz, Z. J. Brown, Y. J. Colon, P. W. Siu, K. A. Scheidt, R. Q. Snurr, J. T. Hupp and O. K. Farha, A facile synthesis of UiO-66, UiO-67 and their derivatives, Chem. Commun., 2021, 49, 9449–9451 RSC.
- Z. Zhang, R. Cai, F. Long and J. Wang, Development and application of tetrabromobisphenol A imprinted electrochemical sensor based on graphene/carbon nanotubes three-dimensional nanocomposites modified carbon electrode, Talanta, 2014, 134, 435–442 CrossRef.
- H. Borah, R. R. Dutta, S. Gogoi and P. Puzari, Influence of methanol, ethanol and cypermethrin on the Glutathione S-transferase catalyzed reaction of Glutathione with 1-chloro-2,4-dinitrobenzene. A method for detection and quantification of cypermethrin, Electrochim. Acta, 2016, 205, 198–206 CrossRef.
- M. Karimi, S. Sadeghi, H. Mohebali, H. Bakhti, A. Mahjoub and A. Heydari, Confined-based catalyst investigation through the comparative functionalization and defunctionalization of Zr-MOF, RSC Adv., 2022, 12, 16358 RSC.
- M. Samari, S. Zinadini, A. A. Zinatizadeh, M. Jafarzadeh and F. Gholami, Designing of a novel polyethersulfone (PES) ultrafiltration (UF) membrane with thermal stability and high fouling resistance using melamine-modified zirconium-based metal-organic framework (UiO-66-NH2/MOF), Sep. Purif. Technol., 2020, 251, 117010 CrossRef.
- S. Arrechea, E. M. A. Guerrero-Gutiérrez, L. Velásquez, J. Cardona, R. Posadas, K. Callejas, S. Torres, R. Díaz, C. Barrientos and E. García, Effect of additions of multiwall carbon nanotubes (MWCNT, MWCNT-COOH and MWCNT-Thiazol) in mechanical compression properties of a cement-based material, Materialia, 2020, 11, 100739–100745 CrossRef CAS.
- S. A. Wulandari, Arifin, H. Widiyandari and A. Subagio, Synthesis and characterization carboxyl functionalized Multi-Walled Carbon Nanotubes (MWCNT-COOH) and NH2 functionalized Multi-Walled Carbon Nanotubes (MWCNTNH2), J. Phys.: Conf. Ser., 2018, 1025, 012005–012014 CrossRef.
- Y. Luan, Y. Qi, H. Gao, R. S. Andriamitantsoa, N. Zheng and G. Wang, A general post-synthetic modification approach of amino-tagged metal–organic frameworks to access efficient catalysts for the Knoevenagel condensation reaction, J. Mater. Chem. A, 2015, 3, 17320–17331 RSC.
- R. Atchudan, S. Perumal, T. N. J. I. Edison and Y. R. Lee, Highly graphitic carbon nanosheets synthesized over tailored mesoporous molecular sieves using acetylene by chemical vapor deposition method, RSC Adv., 2015, 5, 93364–93373 RSC.
- H. L. Tcheumi, I. K. Tonle, E. Ngameni and A. Walcarius, Electrochemical analysis of methylparathion pesticide by a gemini surfactant-intercalated clay-modified electrode, Talanta, 2010, 81, 972–979 CrossRef CAS.
- B. P. Ngassa, I. K. Tonlé and E. Ngameni, Square wave voltammetric detection by direct electroreduction of para nitrophenol (PNP) using an organosmectite film-modified glassy carbon electrode, Talanta, 2016, 147, 547–555 CrossRef.
- M. C. D. Ngaha, V. K. Tchieda, A. K. Tamo, G. Doungmo, E. Njanja and I. K. Tonle, Aminoalcohol-functionalization of Alkali Palm Oil Fiber and Application as Electrochemical Sensor for 2-nitrophenol Determination, Electroanalysis, 2022, 34, 1–14 CrossRef.
- G. Deffo, R. C. T. Temgoua, K. Y. Tajeu, E. Njanja, G. Doungmo, I. K. Tonle and E. Ngameni, Signal amplification by electropolymerization of alizarin red S for improved diuron detection at organosmectite modified glassy carbon electrode, J. Chin. Chem. Soc., 2022, 69, 349–358 CrossRef CAS.
- A. J. Bard and L. R. Faulkner, Electrochimie. Principes, Méthodes et Applications. Edition Masson, 1983, pp. 1–246 Search PubMed.
- G. Deffo, R. C. T. Temgoua, S. F. Mbokou, E. Njanja, I. K. Tonle and E. Ngameni, A sensitive voltammetric analysis and detection of Alizarin Red S onto a glassy carbon electrode modified by an organosmectite, Sens. Int., 2021, 2, 100126 CrossRef.
- J. G. Mhalas, A. M. Tripathy and N. V. RamaRao, Determination of 2,6- and 4,6-dinitrocresols by differential pulse polarography, Microchem. J., 1989, 40, 251–262 CrossRef.
- R. T. Krause and Y. Wang, Oxidative detection of coulometrically reduced organo-nitro pesticides in reversed-phase high-performance liquid chromatography, J. Chromatogr., 1988, 459, 151–162 CrossRef.
- A. D. Corcia and M. Marchetti, Method development for monitoring pesticides in environmental waters. liquid-solid extraction followed by liquid chromatography, Environ. Sci. Technol., 1992, 26, 66–74 CrossRef.
- J. Fischer, J. Barek, B. Yosypchuk and T. Navratil, Voltammetric Determination of Trace Amounts of 2-Methyl-4,6-Dinitrophenol at a Silver Solid Amalgam Electrode, Electroanalysis, 2006, 18, 127–130 CrossRef.
- M. D. M. Cordero-Rando, I. Naranjo-RodrõÂguez and J. L. H. H. D. Cisneros, Anal. Chim. Acta, 1988, 370, 231 CrossRef.
- J. M. Betancourth, M. Cuellar, P. I. Ortiz and V. Pfaffen, Multivariate cathodic square wave stripping voltammetry optimization for nitro group compounds determination using antimony film electrodes, Microchem. J., 2018, 139, 139–149 CrossRef CAS.
Footnote |
| † Electronic supplementary information (ESI) available. See DOI: https://doi.org/10.1039/d3ay01723k |
| This journal is © The Royal Society of Chemistry 2024 |

