Development of a split G-quadruplex and DAPI-based fluorescent probe for Hg(II) and Pb(II) ions detection†
Youyang
Xu‡
,
Yuxin
Liu‡
,
Xiangxiang
Li
,
Yule
Cai
,
Zihan
Gao
and
Jieqiong
Qiu
 *
*
Zhejiang Key Laboratory of Silkworm Bioreactor and Biomedicine, College of Life Sciences and Medicine, Zhejiang Sci-Tech University, Hangzhou 310018, People's Republic of China. E-mail: qiujieqiongqjq@163.com; qiujieqiong@zstu.edu.cn; Tel: +86 0571-86843192
First published on 4th December 2023
Abstract
A novel thymine- and guanine-rich oligonucleotide (ODN-7) was engineered explicitly for the detection of Hg(II) and Pb(II) by a single intercalated dye 4′,6-diamidinyl-2-phenylindole (DAPI). Upon the introduction of Hg(II), a rapid formation of T–Hg(II)–T base pairs takes place, triggering the assembly of a split G-quadruplex structure, resulting in a strong fluorescence signal due to DAPI intercalating into the T–Hg(II)–T mismatch. The introduction of Pb(II) initiates an interaction with the split G-quadruplex, causing a significant conformational change in its structure. Consequently, the altered split G-quadruplex structure fails to facilitate the insertion of DAPI into the T–Hg(II)–T complexes, leading to fluorescence quenching. This strategy offers a straightforward means of detecting Hg(II) and Pb(II). Leveraging the split G-quadruplex, the ODN-7 sensor enables the detection limits (3σ) for Hg(II) and Pb(II) to reach an impressive low of 0.39 nM and 4.98 nM, respectively. It exhibited a favorable linear range of 0.39–900 nM for Hg(II) detection (R2 = 0.9993) and 4.98 nM–5 μM for Pb(II) determination (R2 = 0.9953), respectively. Furthermore, the proposed sensor had excellent selectivity for detecting Hg(II) and Pb(II). It was used in milk samples containing mixed Hg(II) and Pb(II) solutions, yielding recovery rates of 99.3–103.8% for Hg(II) detection and 100.1–104.1% for Pb(II) detection.
1. Introduction
Food safety constitutes a paramount public health concern that has garnered substantial attention in recent times.1 The relentless pace of industrialization has exacerbated the severity of food safety issues, particularly those arising from heavy metal contamination.2 Notably, heavy metals such as Hg(II) and Pb(II) are prevalent in the environment primarily as ions and are ubiquitously detected in a range of consumables, including marine products,3 diverse fruits and vegetables4 and potable water sources.5 Exposure to these ions can severely harm vital organs such as the kidneys, heart, cardiovascular system, and nervous system, even at low concentrations.6 Furthermore, heavy metals can accumulate in humans and animals by the food chain, leading to more substantial toxicity and significant harm.7,8 The World Health Organization has established safe limits for Hg(II) and Pb(II) concentrations in wastewater utilized for agriculture at 0.0019 and 0.01 ppm, respectively.8 Although traditional detection methods like atomic absorption spectroscopy,9,10 inductively coupled plasma mass spectrometry,11,12 cold vapor atomic fluorescence spectrometry,13 and enzyme-linked immunosorbent assay14,15 provide high accuracy and sensitivity, they require extensive and expensive machines, specialized professionals, and complicated procedures. For practical applications, these methods often suffer from drawbacks such as being expensive and time-consuming. Consequently, there is a pressing need to develop a sensor that combines high sensitivity and specificity to address these limitations. It would enable efficient and accurate detection of Hg(II) and Pb(II) in various settings, ensuring timely monitoring and mitigation of heavy metal pollution.Recently, DNA biosensors have become increasingly popular due to their unique advantages, which include rapid detection, high sensitivity, and ease of use.16 These biosensors have widespread applications in disease diagnosis, drug analysis, and environmental monitoring by electrochemical, fluorescent, and colorimetric methods.17 Among the different types of biosensors, fluorescence-based detection is desirable due to its real-time capability, high selectivity, and ease of operation. Compared to the dye-labelled methods, “label-free” DNA biosensors have increased flexibility and low-cost advantages. Consequently, it has become a hot topic of research.18 DNA fluorescent biosensors have enormous potential for detecting heavy metal ions, for instance, Cd(II), Hg(II), Ag(I), and Pb(II), relying on the unique interaction between DNA and heavy metal ions. For example, G-quadruplex structures can be readily formed in guanine-containing DNA or RNA sequences.19 However, Pb(II) can promote a conformational change of G-quadruplex structures,20 leading to alterations in the associated fluorescence signal.21 Thus, G-quadruplex structures can be designed and utilized as DNA biosensors for Pb(II) indicators. To detect Pb(II), researchers have successfully used fluorescent agents such as ThT,22 NMM,20 and DFHBIN,23 which can identify G-quadruplex structures and give a fluorescence change by adding Pb(II). In Hg(II) detection, thymine (T)-rich oligonucleotides are commonly employed in the design of DNA biosensors. These biosensors capitalize on forming a stable T–Hg(II)–T structure, which exhibits more excellent stability than natural TA/AT base pairs. DNA molecules can form stable structures like a hairpin, double helix, and triplex, which can be recognized by some intercalated days, such as DAPI,24,25 NMM,26 ThT,27 Genefinder,28 SYBR Green I,29 and Berberine.30 Our previous study discovered that DAPI could effectively intercalate into the T–Hg(II)–T mismatched base pairs, especially with CG base pairs. The fluorescence intensity of DAPI intercalating into T–Hg(II)–T mismatches was comparable to its intercalation into the more commonly studied TA/AT base pairs.24 When Hg(II) is present, it facilitates the formation of T–Hg(II)–T structures. This interaction creates a strong fluorescence signal when introducing DAPI, allowing for Hg(II) detection.
Previous studies have demonstrated the effectiveness of various fluorescent biosensors in detecting Pb(II) and Hg(II) in samples. These biosensors have exhibited super sensitivity and specificity, making them reliable tools for the accurate detection of these heavy metal ions. However, most DNA biosensors can only detect a single type of metal ions, limiting their usefulness for actual metal ion measurements. Real samples often contain multiple heavy metal ions, making detection more complicated. Therefore, there is a need to develop DNA biosensors capable of detecting two or more types of metal ions. To meet the requirement, the label-free fluorescent DNA biosensors were constructed to detect more than two heavy metal ions. As an example, Zhou et al.31,32 designed label-free DNA biosensors to detect Hg(II) and Pb(II), using two distinct fluorescent dyes, SYBR Green I, and GeneFinder™. However, it would give the wrong fluorescence signal when mixed with Hg(II) and Pb(II). To address the issue of detecting both metal ions in the same sample, Zhou et al.33 developed a DNA biosensor incorporating a K(I)-induced G-quadruplex structure and NMM as a fluorescent probe. Although the biosensor offers a straightforward and label-free approach for detecting Hg(II) and Pb(II), its limitation lies in the ability to distinguish the fluorescence signals generated by each metal ion when they coexist in the same sample. Therefore, constructing label-free DNA biosensors can enhance their abilities to discriminate between Hg(II) and Pb(II) in mixed samples.
In this study, we proposed an efficient and rapid method for Hg(II) and Pb(II) detection utilizing DAPI. A label-free sensor was designed using ODN-7 (Table S1†) to form a mixture of hairpin and split G-quadruplex structure potentially. The T–Hg(II)–T complexes were formed in the presence of Hg(II), which induced the formation of the split G-quadruplex. While, the split G-quadruplex structure could change the conformation of the T–Hg(II)–T complexes, which are recognized by DAPI, giving a fluorescent turn-on signal. Furthermore, the split G-quadruplex served as a target for Pb(II) detection. Upon the addition of Pb(II), the split G-quadruplex conformation underwent a change, leading to the release of DAPI from the T–Hg(II)–T structure. It resulted in the absence of a fluorescence signal, as shown in Scheme 1. As a result, the biosensor allowed for the specific detection of Pb(II) through the Hg(II)-assisted mechanism while ensuring that the detection of Hg(II) remained unaffected by the presence of Pb(II) in the Tris–HAc buffer.
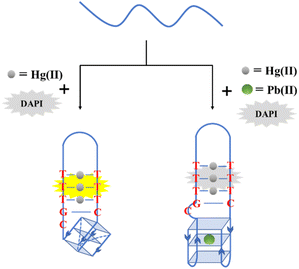 | ||
| Scheme 1 Schematic illustration of the designed nucleic acid fluorescent probes (ODN-7) for the detection of Hg(II) and Pb(II) using T–Hg(II)–T, G-quadruplex, and DAPI. | ||
2. Experimental
2.1 Chemicals and apparatus
The oligonucleotides employed in this study were ordered from Sangon Biotech Co., Ltd (Shanghai, China) and subjected to purification using HAP, as shown in Table S1.† To prepare the stock solution of the oligonucleotide, it was diluted with ddH2O to achieve a concentration of 100 μM. 4′,6-Diamidinyl-2-phenylindole (DAPI) was provided at a concentration of 5 mg mL−1 and ordered from Beyotime Biotechnology Co., Ltd (Shanghai, China) at a concentration of 5 mg mL−1. The mixed buffer used for Hg(II) detection consisted of a 1![[thin space (1/6-em)]](https://www.rsc.org/images/entities/char_2009.gif) :
:![[thin space (1/6-em)]](https://www.rsc.org/images/entities/char_2009.gif) 1, 3
1, 3![[thin space (1/6-em)]](https://www.rsc.org/images/entities/char_2009.gif) :
:![[thin space (1/6-em)]](https://www.rsc.org/images/entities/char_2009.gif) 2, or 3
2, or 3![[thin space (1/6-em)]](https://www.rsc.org/images/entities/char_2009.gif) :
:![[thin space (1/6-em)]](https://www.rsc.org/images/entities/char_2009.gif) 1 volume ratio of two components: 25 mM Tris–HAc buffer (200 mM NaAc, pH 8.5) and 25 mM Tris–HCl buffer (200 mM NaCl, pH 8.5). 25 mM Tris–HCl buffer (200 mM NaCl), and pH values ranged from 7.0 to 9.0, used for Pb(II) detection. All reagents were ordered from Macklin (Shanghai, China). The Hg(II) solution and Pb(II) solution were prepared by diluting the standard Hg(II) and Pb(II) solutions (1000 μg mL−1) procured from Aoke Biology Research Co., Ltd (Beijing, China). All solutions were stored at 4 °C. In this experiment, a Hitachi fluorescence spectrometer (F-4600, Japan) was used, and the measurement was made at room temperature (about 25 °C) to get the fluorescence spectra. The maximum wavelength of excitation was excited at 360 nm, and the emission spectral data from 380–650 nm were recorded. The fluorescence intensity was specifically read at 450 nm, corresponding to the maximum emission wavelength. The excitation slit width was set to 5 nm, and the emission slit width was set to 10 nm.
1 volume ratio of two components: 25 mM Tris–HAc buffer (200 mM NaAc, pH 8.5) and 25 mM Tris–HCl buffer (200 mM NaCl, pH 8.5). 25 mM Tris–HCl buffer (200 mM NaCl), and pH values ranged from 7.0 to 9.0, used for Pb(II) detection. All reagents were ordered from Macklin (Shanghai, China). The Hg(II) solution and Pb(II) solution were prepared by diluting the standard Hg(II) and Pb(II) solutions (1000 μg mL−1) procured from Aoke Biology Research Co., Ltd (Beijing, China). All solutions were stored at 4 °C. In this experiment, a Hitachi fluorescence spectrometer (F-4600, Japan) was used, and the measurement was made at room temperature (about 25 °C) to get the fluorescence spectra. The maximum wavelength of excitation was excited at 360 nm, and the emission spectral data from 380–650 nm were recorded. The fluorescence intensity was specifically read at 450 nm, corresponding to the maximum emission wavelength. The excitation slit width was set to 5 nm, and the emission slit width was set to 10 nm.
2.2 Fluorescence of Hg(II) detection
To prepare the reaction mixture, add 0.2 μL of 100 μM ODN-7 probe and 2 μL of 120 μM Hg(II) solution to a centrifuge tube (0.5 mL). The volume was then adjusted to 199.75 μL by adding the mixed buffer, which was prepared by combining Tris–HAc (25 mM, 200 mM NaAc, pH 8.5) and Tris–HCl (25 mM, 200 mM NaCl, pH 8.5) in a 3![[thin space (1/6-em)]](https://www.rsc.org/images/entities/char_2009.gif) :
:![[thin space (1/6-em)]](https://www.rsc.org/images/entities/char_2009.gif) 1 volume ratio. The mixture was then thoroughly mixed and incubated in a dark environment for 5 minutes. Next, 0.25 μL of 100 μM DAPI was added and incubated in a dark environment for another 20 minutes. The different concentrations of Hg(II) were tested to determine the sensitivity of Hg(II) detection. The concentration ranged from 0, 2, 10, 50, 150, 200, 300, 400, 600, 700, 800, and 900 nM. To evaluate the specificity of Hg(II) detection, various metal ions were tested at the following concentrations: 12 μM K(I), Mg(II), Al(III), Cu(II), Co(II), Ca(II), Ni(II), Fe(II), Mn(II), Cd(II), 25 μM Pb(II) and 10 μM Ag(I). Each sample was measured at least three times.
1 volume ratio. The mixture was then thoroughly mixed and incubated in a dark environment for 5 minutes. Next, 0.25 μL of 100 μM DAPI was added and incubated in a dark environment for another 20 minutes. The different concentrations of Hg(II) were tested to determine the sensitivity of Hg(II) detection. The concentration ranged from 0, 2, 10, 50, 150, 200, 300, 400, 600, 700, 800, and 900 nM. To evaluate the specificity of Hg(II) detection, various metal ions were tested at the following concentrations: 12 μM K(I), Mg(II), Al(III), Cu(II), Co(II), Ca(II), Ni(II), Fe(II), Mn(II), Cd(II), 25 μM Pb(II) and 10 μM Ag(I). Each sample was measured at least three times.
2.3 Fluorescence of Pb(II) detection
Then, add 0.2 μL of 100 μM ODN-7 probe and 2 μL of 120 μM Hg(II) solution to a centrifuge tube (0.5 mL). The mixture was diluted to 195 μL with Tris–HCl buffer (25 mM, pH 7.0–9.0) containing 200 mM NaCl. The mixture was then incubated in a dark environment for 5 minutes. After adding 1.6 μL of 1 mM Pb(II) solution to the same centrifuge tube, the mixture was kept in the dark environment for 20 minutes. Afterward, 0.25 μL of 100 μM DAPI was added and kept for another 20 minutes. To test the sensitivity of Pb(II) detection, the final Pb(II) concentrations were 0, 0.002, 0.05, 0.3, 0.5, 1, 2, 3, 4, 5, 8 and 10 μM. To test the specificity of Pb(II) detection, various metal ions were tested at concentrations of 8 μM, such as Mn(II), Ni(II), Ca(II), Cu(II), Fe(II), Al(III), Mg(II), Co(II), K(I), and Ag(I). Each sample was measured at least three times.3. Results and discussion
3.1 Principle of sensing Hg(II) and Pb(II)
The bifunctional DNA probe described in Scheme 1 is designed to detect Hg(II) and Pb(II) using a single intercalated dye, DAPI, as the fluorescence signal. The probe utilizes that DAPI can recognize T–Hg(II)–T mismatched pairs with the assistance of GC base pairs, giving the fluorescence intensity as strong as intercalated into TA base pairs.24 Moreover, Pb(II) triggers a conformational switch in G-quadruplex structures,34 which has been utilized in other strategies for Pb(II) detection.35,36 Here, we hypothesized that the G-quadruplex could also control the intercalation of DAPI into the T–Hg(II)–T mismatches, allowing for Pb(II) detection using the same principle as for Hg(II). To test this hypothesis, thymine- and guanine-rich oligonucleotide (ODN-7) was designed as the DNA probe and a single DAPI was used as the fluorescence signal. The T–Hg(II)–T complexes were formed in the presence of Hg(II), and DAPI could recognize the T–Hg(II)–T base pairs by the formation of a split G-quadruple, causing an increase in fluorescence. The introduction of Pb(II) caused a conformational change in the G-quadruplex, preventing DAPI from intercalating into the T–Hg(II)–T base pairs, leading to a decrease in fluorescence. This change in fluorescence allowed for Pb(II) detection due to the formation of T–Hg(II)–T structures. To detect Hg(II), the buffer was adjusted to eliminate any interference from Pb(II). As a result, this approach allows for the Hg(II) and Pb(II) detection using a single intercalated dye, providing a convenient and efficient method for two heavy metal ions detection.3.2 Optimization of DNA biosensors for the detection of Hg(II)
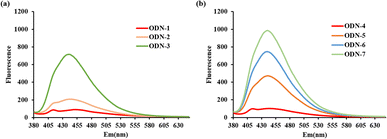
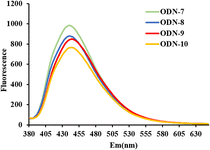
The stability of split G-quadruplex plays a vital role in detecting Hg(II), particularly for the interaction of DAPI into T–Hg(II)–T base pairs. The fluorescence intensity has mainly relied on the conformational G-quadruplex. To demonstrate this, ODN-1–ODN-4 (Table S1†) were designed to evaluate the fluorescence signal with 125 nM DAPI and 1200 nM Hg(II) in 25 mM Tris–HAc buffer (pH 8.5) with 200 mM NaAc. In Fig. 1(a), as the GC base pairs increase, DAPI could better incorporate into the T–Hg(II)–T mismatches, causing the fluorescence signal increases. As expected, this conclusion is consistent with previous studies.24 In comparing ODN-1 and ODN-4 (Fig. 1(b)), there was almost no change in response to Hg(II) by adding DAPI after incubating for 20 minutes. It was suggested that split G-quadruplex was no help for intercalating DAPI into T–Hg(II)–T complexes. We speculated that the split G-quadruplex conformation was incompatible with T–Hg(II)–T base pairs in ODN-4 due to their structural barriers. To confirm the assumption, ODN-5–ODN-7 (Table S1†) were used for further study. Compared to ODN-4, ODN-5–ODN-7 have one or two more GC base pairs between the T–Hg(II)–T base pairs and the split G-quadruplex, which has provided the formation of stable conformation with new possibilities. In contrast, the fluorescence intensity of ODN-5 was much stronger than ODN-2 in the presence of Hg(II) and DAPI, as shown in Fig. 1. This is to say, the conformation of the T–Hg(II)–T complexes was switched by the split G-quadruplex, allowing DAPI to recognize the T–Hg(II)–T formation, and the fluorescence is restored. However, it was not the same story with ODN-3 and ODN-6; there were no fluorescence increases with a split G-quadruplex. It was impossible to estimate that the split G-4 structure played a critical role in the interaction of DAPI and the T–Hg(II)–T mismatches. It was worth mentioning that the fluorescence spectra of ODN-7 gave significantly increased after adding 1200 nM Hg(II) in the solution containing 100 nM ODN-7 and 125 nM DAPI for 20 minutes, shown in Fig. 1(b). ODN-7 has one GC base pair and a free C base to optimize the split G-quadruplex and T–Hg(II)–T structures when Hg(II) is introduced. It is supposed that the presence of a free C base can contribute to the stability of the split G-quadruplex formation. Its stability is crucial for the successful detection of Hg(II). When Hg(II) is presented, the T–Hg(II)–T formation occurs, which can serve as the recognition site for DAPI. With the assistance of the stable split G-quadruplex, DAPI can selectively combine the T–Hg(II)–T structures, giving an excellent fluorescence improvement.To explore the influence of the free nucleotide among the split G-quadruplex and T–Hg(II)–T mismatches in the proposed DNA probes, ODN-8–ODN-10 are designed by changing the free nucleotide C base to A/T/G. The sequences of ODN-8–ODN-10 are shown in Table S1.† We assessed the fluorescence intensity of ODN-7–ODN-10 with 1200 nM Hg(II) and 125 nM DAPI. The fluorescence emission spectra are shown in Fig. 2. The fluorescent signal of ODN-7 with a free C base was much stronger than ODN-8–ODN-10. When the free nucleotide is G, ODN-10 gave the weakest fluorescence signal. ODN-8 with a free A base has a similar fluorescent response to ODN-9 with a free T base. As a result, there was no significant difference in the fluorescent signal for ODN-7–ODN-10 with a different free nucleotide. It indicates that DAPI can be incorporated into the T–Hg(II)–T complexes when a stable split G-4 structure is formed, restoring fluorescence. The stability of split G-4 is contributed by the one base gap, which is allowed the conformation of T–Hg(II)–T mismatches to mimic AT base pairs, and when the base gap is C, giving the strongest fluorescent signal.
3.3 Feasibility of bifunctional DNA biosensors for Hg(II) and Pb(II) detection
To evaluate the effectiveness of the biosensors, ODN-7–ODN-10 were specifically designed to detect Pb(II) based on the T–Hg(II)–T formation, as shown in Fig. S1,† and their sequences were demonstrated in Table S1.† Upon the addition of Pb(II), no fluorescent signal was observed. It confirms that the different free nucleotides do not affect the affinity between Pb(II) and the split G-4 structure. Consequently, the conformational change induced by Pb(II) in the split G-quadruplex structure led to the quenching fluorescence of DAPI. The Hg(II) detection was carried out in Tris–HAc buffer (25 mM, 200 mM NaAc, pH 8.5) to eliminate the interference of Pb(II). However, the fluorescence signal was decreased obviously in the presence of Ag(I), demonstrated in Fig. S2.† It could be attributed to the ability of Ag(I) to disrupt the G-4 structure through reactions with the G bases.37,38 To figure out the matter, the mixed buffers, including a 25 mM Tris–HAc buffer with 200 mM NaAc (pH 8.5) and a 25 mM Tris–HCl buffer with 200 mM NaCl (pH 8.5) in a volume ratio of 1![[thin space (1/6-em)]](https://www.rsc.org/images/entities/char_2009.gif) :
:![[thin space (1/6-em)]](https://www.rsc.org/images/entities/char_2009.gif) 1, 3
1, 3![[thin space (1/6-em)]](https://www.rsc.org/images/entities/char_2009.gif) :
:![[thin space (1/6-em)]](https://www.rsc.org/images/entities/char_2009.gif) 2 and 3
2 and 3![[thin space (1/6-em)]](https://www.rsc.org/images/entities/char_2009.gif) :
:![[thin space (1/6-em)]](https://www.rsc.org/images/entities/char_2009.gif) 1, which were adjusted to get rid of Pb(II) and Ag(I) interferences, as shown in Fig. S3.† It was discovered that the fluorescence of ODN-7 was increased when adding Hg(II) in the mixed buffer with a volume ratio of 3
1, which were adjusted to get rid of Pb(II) and Ag(I) interferences, as shown in Fig. S3.† It was discovered that the fluorescence of ODN-7 was increased when adding Hg(II) in the mixed buffer with a volume ratio of 3![[thin space (1/6-em)]](https://www.rsc.org/images/entities/char_2009.gif) :
:![[thin space (1/6-em)]](https://www.rsc.org/images/entities/char_2009.gif) 1. Almost no fluorescent intensity was changed when presented with both Pb(II) and Ag(I). Thus, it indicates that the ODN-7 biosensor demonstrates excellent selectivity and specificity for Hg(II) detection in the mixed buffer, confirming its effectiveness for accurate and reliable detection of Hg(II). Na(I) is known to effect the formation of G-4. To investigate this, a range of Na(I) concentrations, from 0 to 200 mM, was employed to monitor the split G-4 formation, as described in Fig. S4.† It is suggested that the concentration of Na(I) does not influence incorporating DAPI into the T–Hg(II)–T structure, leading to a change in fluorescence. This is to say, Na(I) does not exert a pivotal role in the establishment of the split G-4 structure, which, in turn, induces the conformational change of the T–Hg(II)–T complexes.
1. Almost no fluorescent intensity was changed when presented with both Pb(II) and Ag(I). Thus, it indicates that the ODN-7 biosensor demonstrates excellent selectivity and specificity for Hg(II) detection in the mixed buffer, confirming its effectiveness for accurate and reliable detection of Hg(II). Na(I) is known to effect the formation of G-4. To investigate this, a range of Na(I) concentrations, from 0 to 200 mM, was employed to monitor the split G-4 formation, as described in Fig. S4.† It is suggested that the concentration of Na(I) does not influence incorporating DAPI into the T–Hg(II)–T structure, leading to a change in fluorescence. This is to say, Na(I) does not exert a pivotal role in the establishment of the split G-4 structure, which, in turn, induces the conformational change of the T–Hg(II)–T complexes.
3.4 Sensitivity of Hg(II) detection
To demonstrate the sensitivity of the designed DNA sensors for detecting Hg(II), the various concentrations of Hg(II) solution were applied in the mixed buffer (3![[thin space (1/6-em)]](https://www.rsc.org/images/entities/char_2009.gif) :
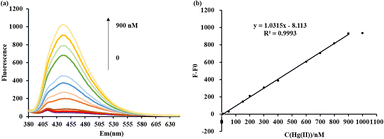
:![[thin space (1/6-em)]](https://www.rsc.org/images/entities/char_2009.gif) 1). From Fig. 3(a), the fluorescence signal of ODN-7 exhibited a gradual increase upon excitation at 360 nm, with the Hg(II) concentration varying from 0.39 to 900 nM. When no Hg(II) was added, no T–Hg(II)–T mismatches formed, and DAPI could not intercalate into their minor grooves to restore the fluorescence. As the Hg(II) concentration increases, the split G-quadruplex structure induces the formation of T–Hg(II)–T complexes. This conformational change allows DAPI to recognize the T–Hg(II)–T mismatches, resulting in the generation of a fluorescent signal. When the Hg(II) concentration was approximately 900 nM, the emission fluorescence reached its maximum intensity. Subsequently, the fluorescence intensity remained relatively unchanged as the Hg(II) concentration continued to increase.
1). From Fig. 3(a), the fluorescence signal of ODN-7 exhibited a gradual increase upon excitation at 360 nm, with the Hg(II) concentration varying from 0.39 to 900 nM. When no Hg(II) was added, no T–Hg(II)–T mismatches formed, and DAPI could not intercalate into their minor grooves to restore the fluorescence. As the Hg(II) concentration increases, the split G-quadruplex structure induces the formation of T–Hg(II)–T complexes. This conformational change allows DAPI to recognize the T–Hg(II)–T mismatches, resulting in the generation of a fluorescent signal. When the Hg(II) concentration was approximately 900 nM, the emission fluorescence reached its maximum intensity. Subsequently, the fluorescence intensity remained relatively unchanged as the Hg(II) concentration continued to increase.
In Fig. 3(b), it can be observed that as the concentration of Hg(II) increases, there is a corresponding increase in the fluorescence change (F–F0) at 450 nm, corresponding to the maximum emission wavelength of DAPI. The fluorescence signal variations of the ODN-7 probe showed a proportionate relationship with the concentration of Hg(II) within the tested range of 0.39–900 nM. The linear correlation equation was determined to be y = 1.0315x − 8.113 (where y stands for F–F0 and x stands for the Hg(II) concentration), with a coefficient of determination (R2) of 0.9993. The observed proportionate relationship between the fluorescence signal variations of the ODN-7 probe and the Hg(II) concentration suggests that quantitative determination of Hg(II) can be achieved using this sensor. By analysing the 3σ slope, it is determined that the sensor's Hg(II) detection limit (LOD) is 0.39 nM, corresponding to the level of toxicity by Hg(II) in drinking water recommended by the WHO.
3.5 Selectivity of Hg(II) detection
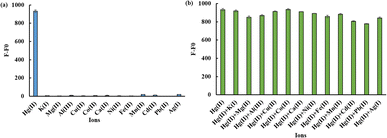
Experiments were carried out to measure the changes in fluorescence emission with or without a 1200 nM Hg(II) solution to evaluate the selectivity of the ODN-7 probe for detecting Hg(II). Under identical detection conditions, various metal ions, including 12 μM K(I), Cu(II), Mg(II), Al(III), Ni(II), Cd(II), Co(II), Ca(II), Fe(II), Mn(II), 25 μM Pb(II) and 10 μM Ag(I), were added to the reaction system. The results, depicted in Fig. 4(a), reveal that only the addition of 1200 nM Hg(II) significantly enhanced the weak fluorescence signal. In contrast, the introduction of other metal ions, even at concentrations increased by more than 8 times, failed to elicit a similar effect in significantly increasing the fluorescence signal intensity. It indicates that the ODN-7 biosensor exhibits high selectivity in detecting Hg(II). Furthermore, with the existence of Hg(II), adding other metal ions, as mentioned above, did not cause a major change in fluorescence signal intensity (Fig. 4(b)). This further validates the biosensor's exceptional selectivity for the detection of Hg(II).3.6 Sensitivity of Pb(II) detection
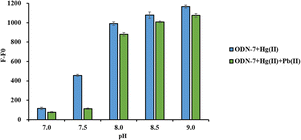
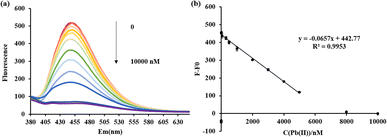
To scrutinize the influence of pH values on the detection of Pb(II), a selection of solutions characterized by varying pH were curated, as shown in Fig. 5. In the absence of Pb(II), the fluorescent response of ODN-7 exhibits an ascending trajectory concomitant with the elevation of pH value. However, when the pH is greater than 7.5, the fluctuation in the fluorescent signal for detecting Pb(II) ions is relatively small. It arises from the inherent instability of Pb(II) ions in alkaline conditions, which would inevitably lead to a reduction in the sensitivity of Pb(II) detection, rendering it ill-suited for the discernment of minute concentrations of Pb(II). Therefore, the pH for detecting Pb(II) is controlled at pH 7.5, while pH 8.5 is used as a reference.Varying concentrations of Pb(II) solution were employed to assess the DNA sensor's sensitivity for Pb(II) detection. As the increment of Pb(II) concentration, the fluorescence emission intensity of ODN-7 exhibited a gradual decrease upon excitation at 360 nm, following the addition of 1200 nM Hg(II) and 125 nM DAPI, as shown in Fig. 6(a). The split G-4 structure is formed in the absence of Pb(II), and DAPI remains in contact with T–Hg(II)–T base pairs, giving the maximum fluorescence intensity of ODN-7. However, Pb(II) can induce a conformational transition in the split G-quadruplex, changing it from a cis structure to a trans structure in the presence of Pb(II). This conformational change disrupts the formation of T–Hg(II)–T base pairs, causing DAPI to be released and exist in a free monomeric form, resulting in the absence of emission. As the Pb(II) concentration increases, the altered G-4 structure fails to induce the formation of T–Hg(II)–T complexes, showing a gradual fluorescence quenching.
When the Pb(II) concentration reaches approximately 8 μM, nearly all of the DAPI is released from the T–Hg(II)–T mismatches, leading to complete quenching of the emission fluorescence. Beyond this point, further increases in Pb(II) concentration do not significantly alter the fluorescence signal, as presented in Fig. 6(b). When the Pb(II) concentration ranged from 4.98 nM to 5 μM, the fluorescence change of the ODN-7 probe displayed a proportional relationship with Pb(II) concentration. The linear correlation equation y = −0.0657x + 442.77 was calculated, where y represents the fluorescence change (F–F0) and x represents the Pb(II) concentration. The coefficient of determination (R2) for this linear correlation was calculated to be 0.9953, and the LOD was determined to be 4.98 nM. The same experiment was performed at pH 8.5, as illuminated in Fig. S5.† The fluorescence intensity is completely quenched when the Pb(II) concentration is 50 μM. An excellent linear relationship exists between the Pb(II) concentration and fluorescence signal when the concentration is 4.57 nM–30 μM.
Different label-free DNA biosensors were developed for Hg(II) or Pb(II) detection, and their respective results are summarized in Table 1. Considering their sensitivity and linear range, we compared our newly presented label-free scheme and previous analytical methods. It is worth noting that our label-free approach has the capability for both Hg(II) and Pb(II) detection, demonstrating a lower LOD and higher sensitivity.
| Detected ions | Intercalator | Liner range/μM | LOD/nM | Ref. |
|---|---|---|---|---|
| Hg(II) | NMM | 0.005–0.5 | 12.9 | 39 |
| Ethidium bromide | 0.03–0.12 | 9.5 | 40 | |
| Pb(II) | PicoGreen | 0.004826–4.826 | 4.826 | 41 |
| SYBR Green I | 0–0.6 | 3.79 | 42 | |
| Hg(II) or Pb(II) | GeneFinder™ | 0.00323–0.3/0.00262–0.5 | 3.23/2.62 | 32 |
| NMM | 0.02–1/0.01–0.2 | 18.6/5 | 33 | |
| SYBR Green I | 0–0.3/0–0.5 | 1.14/2.09 | 31 | |
| Hg(II) and Pb(II) | DAPI | 0.00039–0.9/0.00498–5 | 0.39/4.98 | This work |
3.7 Selectivity of Pb(II) detection
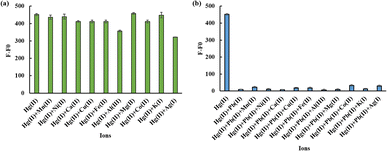
Measurements of fluorescence changes with or without Pb(II) (8 μM), as well as other common metal ions (Mn(II), Ni(II), Ca(II), Cu(II), Fe(II), Al(III), Mg(II), Co(II), K(I), Ag(I)) at the same detection conditions were carried out to estimate the selectivity of ODN-7 in Pb(II) detection. The fluorescence responses are presented in Fig. 7(a), where it can be observed that multiple metal ions at concentrations up to 8 μM do not exert a critical quenching effect on the higher fluorescence intensity induced by 1200 nM Hg(II), apart from a slight decrease in fluorescence signals for Al(III) and Ag(I). When the pH value is 8.5, these two metal ions do not exhibit a significant decrease in signal, as shown in Fig. S6.† However, when Pb(II) is presented, the fluorescence signal is dramatically reduced, almost reaching complete quenching. It demonstrates that other environmental ions have minimal impact on fluorescence quenching. Thereby, the biosensor exhibits a high level of selectivity for detecting Pb(II). Moreover, in the scenario where Hg(II) and 8 μM Pb(II) are present, the subsequent addition of other metal ions at the same concentration as before does not result in significant fluctuations in the quenched fluorescence signals (Fig. 7(b)). It further confirms the excellent selectivity of the biosensor.3.8 Analysis of Hg(II) and Pb(II) in tap water and milk
To assess the ODN-7 biosensor's performance in tap water/milk samples, we conducted tests to measure the recovery rates of Hg(II) and Pb(II). Hg(II) concentrations were 50, 200, and 400 nM, while Pb(II) concentrations were 0.5, 5, and 10 μM for Hg(II) detection, Pb(II) concentrations were 0.5, 1, and 2 μM for Pb(II) detection. The recovered samples were prepared by mixing Hg(II) solution alone, Pb(II) solution alone, and a mixture of Hg(II) and Pb(II) solutions. The recoveries of Hg(II) and Pb(II) in milk contaminated with these ions ranged from 99.3% to 103.8% and from 100.1% to 104.1%, respectively (Table 2). The recovery rates of Hg(II) and Pb(II) in tap water, as displayed in Tables 2S and 3S.† Additionally, RSDs were as low as 5% for each analysis (n = 3). These results indicate that the ODN-7 biosensor is capable of synchronous detection of both Hg(II) and Pb(II), affirming its effectiveness in practical applications.| Sample | Detected ion | Hg(II) (nM) | Pb(II) (μM) | Repeats | Found (nM) | RSD (%) | Recovery (%) |
|---|---|---|---|---|---|---|---|
| 1 | Hg(II) | 50 | 0.5 | 1 | 50.6 | 1.040 | 99.8 |
| 2 | 49.5 | ||||||
| 3 | 49.5 | ||||||
| 2 | 200 | 5 | 1 | 192.2 | 2.723 | 99.3 | |
| 2 | 197.9 | ||||||
| 3 | 205.4 | ||||||
| 3 | 400 | 10 | 1 | 414.3 | 0.159 | 103.8 | |
| 2 | 415.3 | ||||||
| 3 | 415.9 | ||||||
| 4 | Pb(II) | 50 | 0.5 | 1 | 504.7 | 1.481 | 101.9 |
| 2 | 503.2 | ||||||
| 3 | 519.9 | ||||||
| 5 | 200 | 1 | 1 | 1008.5 | 0.569 | 100.1 | |
| 2 | 999.4 | ||||||
| 3 | 994.8 | ||||||
| 6 | 400 | 2 | 1 | 2095.3 | 0.440 | 104.1 | |
| 2 | 2078.5 | ||||||
| 3 | 2074.0 |
4. Conclusions
In summary, our study describes the development of a novel probe named ODN-7, which offers the capability to detect Hg(II) and Pb(II) utilizing a single intercalator of the fluorescent dye DAPI. This innovative approach simplifies the detection process by allowing the identification of both metal ions in a single measurement. The ODN-7 probe operates based on the formation of T–Hg(II)–T complexes and a split G-4. Specifically, when there is a C-base nucleotide between the T–Hg(II)–T complexes and the split G-4, it enhances the stability of the split G-4 structure. As a result, the presence of Hg(II) triggers fluorescence, indicating the detection of Hg(II) ions. This mechanism allows for the selective and sensitive detection of Hg(II) using the ODN-7 probe. In contrast, the presence of Pb(II) induces a conformational transformation in the split G-4 structure, which hinders the recognition of the T–Hg(II)–T complexes by the fluorescent dye DAPI. As a consequence, fluorescence quenching occurs in the presence of Pb(II). It enables the differentiation between Hg(II) and Pb(II) ions based on their distinct effects on the split G-4 structure, further enhancing the selectivity of the ODN-7 probe for the detection of Hg(II) and Pb(II), and offering simplicity in operation and rapid response. Furthermore, the practical application of the ODN-7 probe has been demonstrated successfully detecting Hg(II) and Pb(II) in tap water and yielding satisfactory recovery rates. This advancement in label-free sensing holds promise for various applications in environmental monitoring, water quality assessment, and other fields where the detection of heavy metal ions is of significant importance.Author contributions
Conceptualization, funding acquisition, project administration, resources, supervision, writing – original draft and writing – review and editing, J. Q. Qiu; investigation, methodology and writing – original draft; Y. Y. Xu; L. C. Liu.; data curation, formal analysis; X. X. Li; Y. L. Cai; Z. H. Gao; critical revision of the manuscript for important intellectual content: all authors. All authors have read and agreed to the published version of the manuscript.Conflicts of interest
There are no conflicts to declare.Acknowledgements
This work was supported by “the Foundational Research Funds of Zhejiang Sci-Tech University” under Grant (No. 23042137-Y).References
- Z. Gizaw, Environ. Health Prev. Med., 2019, 24, 68 CrossRef.
- K. Rehman, F. Fatima, I. Waheed and M. S. H. Akash, J. Cell. Biochem., 2018, 119, 157–184 CrossRef CAS.
- E. O. Elvevoll, D. James, J. Toppe, E. G. Gamarro and I. J. Jensen, Foods, 2022, 11, 3992 CrossRef CAS PubMed.
- R. Kaur, S. Das, S. Bansal, G. Singh, S. Sardar, H. Dhar and H. Ram, Physiol. Plant., 2021, 173, 430–448 CAS.
- R. Sivakumar and N. Y. Lee, Chemosphere, 2021, 275, 130096 CrossRef CAS PubMed.
- J. Du, C. Cao and L. Jiang, Gene, 2015, 563, 155–159 CrossRef CAS PubMed.
- Y. Yang, W. Li and J. Liu, Anal. Chim. Acta, 2021, 1147, 124–143 CrossRef CAS.
- G. K. Kinuthia, V. Ngure, D. Beti, R. Lugalia, A. Wangila and L. Kamau, Sci. Rep., 2020, 10, 8434 CrossRef CAS.
- N. A. Panichev and S. E. Panicheva, Food Chem., 2015, 166, 432–441 CrossRef CAS PubMed.
- A. Chahid, M. Hilali, A. Benlhachimi and T. Bouzid, Food Chem., 2014, 147, 357–360 CrossRef CAS PubMed.
- S. Ozdemir, E. Kilinc, K. S. Celik, V. Okumus and M. Soylak, Food Chem., 2017, 215, 447–453 CrossRef CAS.
- X. Jia, D. Gong, J. Zhao, H. Ren, J. Wang and X. Zhang, Mikrochim. Acta, 2018, 185, 228 CrossRef PubMed.
- F. A. D. Cunha, M. J. de Oliveira, P. P. Florez-Rodriguez and J. C. C. Santos, Spectrochim. Acta, Part B, 2022, 192, 106412 CrossRef.
- X. X. Jin, R. He, X. R. Ju, J. Zhang, M. J. Wang, C. R. Xing and J. Yuan, Food Sci. Nutr., 2019, 7, 1615–1622 CrossRef CAS PubMed.
- Y. Zhou, X. L. Tian, Y. S. Li, Y. Y. Zhang, L. Yang, J. H. Zhang, X. R. Wang, S. Y. Lu, H. L. Ren and Z. S. Liu, Biosens. Bioelectron., 2011, 30, 310–314 CrossRef CAS PubMed.
- Z. Chen, M. Xie, F. Zhao and S. Han, Foods, 2022, 11, 1404 CrossRef.
- T. Sun, X. Li, X. C. Jin, Z. Y. Wu, X. C. Chen and J. Q. Qiu, Int. J. Mol. Sci., 2022, 23, 6326 CrossRef PubMed.
- J. R. Hu, D. Y. Wang, L. L. Dai, G. Y. Shen and J. Q. Qiu, Microchem. J., 2020, 159, 105562 CrossRef.
- Y. Zhang, W. Chen, X. Dong, H. Fan, X. Wang and L. Bian, Sens. Actuators, B, 2018, 261, 58–65 CrossRef.
- L. Xu, X. Shen, S. Hong, J. Wang, Y. Zhang, H. Wang, J. Zhang and R. Pei, Chem. Commun., 2015, 51, 8165–8168 RSC.
- A. Ravikumar, P. Panneerselvam and K. Radhakrishnan, Mikrochim. Acta, 2017, 185, 2 CrossRef PubMed.
- Y. Wen, L. Wang, L. Li, L. Xu and G. Liu, Sensors, 2016, 16, 2155 CrossRef PubMed.
- S. DasGupta, S. A. Shelke, N. S. Li and J. A. Piccirilli, Chem. Commun., 2015, 51, 9034–9037 RSC.
- X. C. Jin, T. Sun, Z. Y. Wu, D. Y. Wang, F. Hu, J. X. Xu, X. Li and J. Q. Qiu, Anal. Chim. Acta, 2022, 1221, 340113 CrossRef CAS PubMed.
- Z. Zhu, L. Xu, X. Zhou, J. G. Qin and C. L. Yang, Chem. Commun., 2011, 47, 8010–8012 RSC.
- F. H. Geng, X. Y. Jiang, Y. X. Wang, C. Y. Shao, K. F. Wang, P. Qu and M. T. Xu, Sens. Actuators, B, 2018, 260, 793–799 CrossRef CAS.
- R. M. Kong, L. Ma, X. Han, C. R. Ma, F. L. Qu and L. Xia, Spectrochim. Acta, Part A, 2020, 228, 7 Search PubMed.
- T. Yuan, L. Z. Hu, Z. Y. Liu, W. J. Qi, S. Y. Zhu, R. Aziz ur and G. B. Xu, Anal. Chim. Acta, 2013, 793, 86–89 CrossRef CAS.
- Y. Li, N. Liu, H. Liu, Y. Wang, Y. Hao, X. Ma, X. Li, Y. Huo, J. Lu, S. Tang, C. Wang, Y. Zhang and Z. Gao, Sci. Rep., 2017, 7, 45974 CrossRef CAS.
- X. Song, B. Fu, Y. Lan, Y. Chen, Y. Wei and C. Dong, Spectrochim. Acta, Part A, 2018, 204, 301–307 CrossRef CAS.
- H. Xu, S. Zhan, D. Zhang, B. Xia, X. Zhan, L. Wang and P. Zhou, Anal. Methods, 2015, 7, 6260–6265 RSC.
- S. Zhan, H. Xu, D. Zhang, B. Xia, X. Zhan, L. Wang, J. Lv and P. Zhou, Biosens. Bioelectron., 2015, 72, 95–99 CrossRef CAS PubMed.
- Q. Zhu, L. Liu, Y. Xing and X. Zhou, J. Hazard. Mater., 2018, 355, 50–55 CrossRef CAS.
- Y. M. Liu, H. Yang, R. Wan, M. R. Khan, N. Wang, R. Busquets, R. J. Deng, Q. He and Z. F. Zhao, Biosensors, 2021, 11, 274 CrossRef CAS.
- Z. Khoshbin, M. R. Housaindokht, M. Izadyar, A. Verdian and M. R. Bozorgmehr, Anal. Chim. Acta, 2019, 1071, 70–77 CrossRef CAS.
- Z. Li, H. Sun, X. Ma, R. Su, R. Sun, C. Yang and C. Sun, Anal. Chim. Acta, 2020, 1099, 136–144 CrossRef CAS PubMed.
- D. P. Zhang and H. L. Wang, Anal. Chem., 2019, 91, 14538–14544 CrossRef CAS.
- X. L. Yang, W. Wei, J. H. Jiang, G. L. Shen and R. Q. Yu, Anal. Methods, 2016, 8, 311–315 RSC.
- X. P. Zhang, B. M. Ding, H. W. Wu, J. J. Wang and H. L. Yang, Anal. Sci., 2017, 33, 165–169 CrossRef CAS PubMed.
- Y. Luo, P. Wu, J. Hu, S. He, X. Hou and K. Xu, Anal. Methods, 2012, 4, 1310 RSC.
- Y. Huang, J. Yan, Z. Fang, C. Zhang, W. Bai, M. Yan, C. Zhu, C. Gao and A. Chen, RSC Adv., 2016, 6, 90300–90304 RSC.
- S. Zhan, Y. Wu, Y. Luo, L. Liu, L. He, H. Xing and P. Zhou, Anal. Biochem., 2014, 462, 19–25 CrossRef CAS.
Footnotes |
| † Electronic supplementary information (ESI) available. See DOI: https://doi.org/10.1039/d3ay01839c |
| ‡ These authors contributed equally to the work and can be considered co-first authors. |
| This journal is © The Royal Society of Chemistry 2024 |

