Development of a facile electrochemical sensor based on GCE modified with one-step prepared PNMA-CeO2-fMWCNTs composite for simultaneous detection of UA and 5-FU†
Kübra
Turan
 a,
Ahmet
Üğe
 b,
Bülent
Zeybek
 b and
Gözde
Aydoğdu Tiğ
 *a
*a
aAnkara University, Faculty of Science, Department of Chemistry, Ankara, 06100, Turkey. E-mail: gaydogdu@science.ankara.edu.tr
bKütahya Dumlupınar University, Faculty of Science and Arts, Department of Chemistry, Kütahya, 43100, Turkey
First published on 1st December 2023
Abstract
In this study, a poly(N-methyl aniline)-cerium oxide-functionalized MWCNTs (PNMA-CeO2-fMWCNTs) composite was synthesized in a one-step preparation technique. As a highly efficient modifier, the composite was used to modify the glassy carbon electrode surface for simultaneous detection of uric acid (UA) and 5-fluorouracil (5-FU). Morphological characterization of the GCE/PNMA-CeO2-fMWCNTs was studied using scanning electron microscopy. Structural characterization of the composite was performed using X-ray diffraction and Fourier-transformed infrared spectroscopy. Electron transfer properties of the prepared electrodes were carried out with electrochemical impedance spectroscopy and cyclic voltammetry. The linear working range for UA and 5-FU was found to be 0.25–50 μM and 0.5–750 μM, respectively. The limit of detection values for UA and 5-FU were 0.04 μM and 0.19 μM, respectively. The effects of various interfering substances on the electrochemical response of UA and 5-FU were investigated. The GCE/PNMA-CeO2-fMWCNTs sensor has excellent stability, reproducibility, anti-interference ability, and reproducibility. To demonstrate the practical application of the sensing platform, fetal bovine serum was selected and tested in the spiked samples, and satisfactory results were obtained. The prepared composite proved to be a promising platform for simple, rapid, and simultaneous analysis of UA and 5-FU.
1. Introduction
Uric acid (2,6,8-trihydroxy purine, C5H4N4O3, UA) is the end product of purine metabolism in humans.1–3 Frequent consumption of red meat, seafood, alcohol, fructose-containing beverages, and fatty foods can increase UA levels.1 In healthy people, the level of UA is 149–416 μM in men and 89–357 μM in women.4 Gout is a disease characterized by the production of monosodium urate crystals in joints, synovial fluid, tendons, and surrounding tissues caused by an excess of UA in the blood.2 Moreover, abnormal UA levels can trigger different diseases, such as Wilson's disease, Parkinson's disease, Lesch–Nyhan syndrome, stroke, hyperuricemia, metabolic syndrome, hypertension, various cardiovascular and renal disorders, renal failure, and leukaemia.2–5 Measuring the concentration of UA in the serum and urine is crucial for diagnosing various diseases. Since UA is an electroactive molecule, it can be determined via electrochemical techniques.6 Electroanalytical methods can be used for this purpose due to their reliability, simplicity, sensitivity, and low concentration detection.Anticancer drugs are widely used in oncology patients for treatment.7 5-Fluorouracil (5-fluoro-1H pyrimidine-2,4-dione, 5-FU) is one of the most prominent chemotherapeutic medicines composed of a fluorine atom at the fifth position of uracil.8 It has been used worldwide since 1957 to treat different types of cancer, including metastatic colorectal and breast cancer colon, stomach, breast, pancreas, and cervix.7,9–12 The concentration of 5-FU in blood plasma or serum is regularly maintained in the range of 0.1–1.0 μM, despite its widespread use in chemotherapy.12 Overdosage of 5-FU can produce various side effects with an accumulation of harmful metabolites in cancer patients. Therefore, rapid, reliable, and accurate measurement of 5-FU concentration is necessary to maintain adequate levels of the drug in physiological fluids, regulate it by dosage, and ensure drug quality control and clinical diagnosis. In particular, trace-level quantification of 5-FU is essential in pharmaceutical quality control and clinical diagnosis in anticancer therapy.7,8 Thus, developing highly selective and sensitive analytical methods has gained considerable attention in detecting 5-FU.10 Among several techniques, electrochemical sensors can be considered efficient tools due to their high accuracy, fast response, and ease of application. However, the weak oxidation of 5-FU at the bare electrode poses a significant problem in the electrochemical method.8,12,13 Thus, there is a demand for establishing a high-performance sensor for the trace-level detection of 5-FU. Measuring UA and 5-FU concentrations in biological fluids is critical for diagnosing and treating various disorders. Since UA can also act as a potential inhibitor of the uridine mono-phosphate synthase enzyme, it can effectively reduce the sensitivity of cancerous cells to 5-FU.3 Consequently, developing a sensitive and selective electrochemical sensor platform is essential to detect two analytes simultaneously.
Various analytical methods have been developed in the literature to detect UA and 5-FU analytes in biological samples.9,14–20 Compared to other analytical approaches, the electrochemical methods can allow the detection of the analytes in biological samples without a complex pretreatment method.12,21 Electrochemical techniques have remarkable features such as high sensitivity, fast response time, low cost, instrumental simplicity, and possible miniaturization and integration into portable devices.22,23 These methods are widely used to detect molecules that can easily participate in electrochemical reactions.23 Therefore, it becomes challenging to make simultaneous measurements with bare glass carbon electrodes (GCEs) with low electron transfer kinetics. Consequently, it is necessary to produce a new electrochemical sensor with novel surface modification techniques and advanced electrode materials. The electrochemical performance of the developed sensors depends on the materials used in their production, such as large specific surface area, redox properties, conductivity, good biocompatibility, stability, and good self-compatibility.24 Additionally, as the advanced nanomaterial on the electrode directly impacts the sensing performance, investigating a new functional composite is essential for the simultaneous, accurate, and sensitive determination of UA and 5-FU.18 The modification of electrode surfaces is usually performed using carbon-based nanostructures, metal-based nanomaterials, organic molecules, functionalized nanostructures, surfactants, and dyes with several methods such as electrodeposition, drop-casting, and electrochemical polymerization. Surface modification can provide a higher catalytic effect, higher sensing activity, lower ionization potential, higher electron affinity, higher electronic and ionic conductivity, and more active sites.25 Different conducting polymers, such as polypyrrole6,26 and poly(N-methyl aniline) (PNMA)27,28 were used to prepare modified electrodes targeting various substances. Among these, PNMA is an N-substituted polyaniline derivative polymer that can be synthesized by electrochemical and chemical polymerization. It has been determined to have different chemical properties from polyaniline due to the electronically inducing N-methyl group. However, the inherent disadvantages of PNMA-based sensors are their low electrical conductivity, stability, and selectivity.27,28 PNMA is often functionalized or incorporated with carbon-based materials and metal oxide nanoparticles (NPs) to solve these demerits.
Among the carbon-based nanomaterials, carbon nanotubes (CNTs) and multiwalled carbon nanotubes (MWCNTs) have been widely used as electrode materials in electroanalytical chemistry due to their high surface area, excellent electrical conductivity, and high electrocatalytic activity. Due to their fast electron transfer rates, high electrocatalytic effects, sensitivity, low detection limits, high chemical stability, and excellent biocompatibility, they have been extensively used in modifying sensors.29 Because of their elongated and tubular structure, CNTs may facilitate electron transport between the electrode surface and the electroactive species. The activity of the edge plane-like graphite regions at the CNT tips has been linked to the electrocatalytic effect of CNTs, which CNT functionalization can further improve.13 CNTs also reduce electrode fouling, which could considerably enhance the reusability of such sensors.30 Cerium oxide (CeO2) is a promising electrode material due to CeO2 electrochemical properties, environmental compatibility, and low cost. CeO2 has an exceptional capacity to store or release oxygen due to the oxidation state of the cerium ion varying from +3 to +4, depending on the reducing or oxidizing conditions.31
Recently, Ganesan et al. proposed a nitrogen-doped carbon quantum dots@Fe2O3/MWCNTs/GCE platform for detecting UA, xanthine (XA), and 5-FU. Differently from the literature, in this study, the developed sensor exhibited wide working ranges and lower LOD values about 3.5 and 8 times for UA and 5-FU, respectively.32 This study aimed to fabricate a highly efficient electrochemical sensor to detect UA and 5-FU simultaneously. For this purpose, one step prepared a poly(N-methyl aniline)-cerium oxide-functionalized MWCNTs (PNMA-CeO2-fMWCNTs) composite was fabricated. A GCE modified with PNMA-CeO2-fMWCNTs composite was used for electrochemical sensing of UA and 5-FU. The electroactive performance of the composite-modified GCE was evaluated by cyclic voltammetry (CV) and differential pulse voltammetry (DPV) techniques. The CV and DPV results showed that the PNMA-CeO2-fMWCNTs composite has high electroactivity and is suitable for the simultaneous determination of UA and 5-FU. The GCE/PNMA-CeO2-fMWCNTs sensor has excellent stability, anti-interference ability, and reproducibility. Moreover, the applicability of the sensor was tested with a synthetic human serum sample. The prepared composite was a promising platform for simple, rapid, and simultaneous analysis of UA and 5-FU.
2. Material and method
2.1. Chemicals and apparatus
N-Methyl aniline (J. T. Baker, USA), HCl (J. T. Baker, USA), MWCNT (Sigma-Aldrich, Germany), ammonium persulfate (Merck, Germany), and Ce(IV) oxide nanopowder chemicals were of analytical grade. All solutions were prepared with ultra-pure water. Phosphate buffer saline (PBS) was prepared from sodium phosphate monobasic (NaH2PO4·2H20, Sigma-Aldrich) and sodium phosphate dibasic (Na2HPO4·2H20, Sigma-Aldrich) salts. The pH of the prepared buffer was adjusted with NaOH or H3PO4 solutions. Potassium hexacyanoferrate(II) trihydrate (K4Fe(CN)6·3H2O), potassium hexacyanoferrate(III) (K3Fe(CN)6), and potassium chloride (KCl, Sigma-Aldrich) were used to prepare the redox probe. Alumina polishing solution (0.05 μm Buehler), diamond polish, and ethanol (Sigma-Aldrich) were used to clean the electrodes. Stock solution of 5-fluorouracil (C4H3FN2O2, Sigma-Aldrich) and uric acid (C5H4N4O3, Fluka) at 1 × 10⁻² M were stored at +4.0 °C. As UA is insoluble in water, it was prepared in lithium carbonate of 0.45% (Li2CO3, Merck). L-arginine (Fluka), D-glucose (AnalaR), magnesium chloride (MgCl2, Merck), L-cysteine, L-tryptophan, acetaminophen, L-glutathione reduced, L-ascorbic acid, dopamine. All purchased from Sigma-Aldrich, HCl, and sodium chloride (NaCl) were used for interference studies. Fetal bovine serum (Biological Industries) and synthetic urine were used as real-life samples. Experimental studies were carried out at room temperature.Electrochemical studies were conducted using an AUTOLAB AUT302N equipped with NOVA 2.1.6 software. Electrochemical measurements were performed in a BASI C3 cell stand using a GCE (BASI MF-2012) as a working electrode, Ag/AgCl reference electrode (BASI, MF 2079), and counter electrode platinum wire (BASI, MW 1032). A Bandelin Sonorex ultrasonic bath was used to prepare the dispersion of composite materials and other solutions. In addition, a precision balance (KERN ABT 220-5DM), a magnetic stirrer (CHILTERN HS31), and a pH meter (Thermo ORION 720 A) were used for the preparation of solutions and materials during the study. ELGA Purelab Option-Q DV25 double-distilled water was used in all studies. CV and EIS techniques were used to obtain detailed information about the modification of electrode surfaces. For this purpose, CV between (−0.3 V) and (+0.6 V) and EIS measurements in the frequency range of 0.01 Hz to 100.0 kHz were recorded in 5 mM [Fe(CN)6]3−/4− redox probe containing 0.1 M KCl., DPV and CV analyses were conducted in PBS as a supporting electrolyte for determination of UA and 5-FU analytes simultaneously. DPV conditions were as follows: potential range from (+0.2 V) to (+1.4 V) at a modulation time of 0.02 s, modulation amplitude of 0.05 V, step potential of 0.003 V, and a scan rate of 0.015 V s−1.
An FEI Nova NanoSEM 650 microscope (The Netherlands) was utilized to record field emission scanning electron micrographs of powder samples. The sample surface was coated with Au–Pd alloy using a sputter coater under vacuum before imaging. The X-ray Diffraction (XRD) patterns of samples were obtained with an X-ray diffractometer (PANalytical-Empyrean, The Netherlands) with Cu Kα radiation. Fourier Transfer Infrared Resonance (FT-IR) spectroscopic analyses were conducted using a Bruker Optics Vertex 70 Fourier transform infrared spectrometer (Bruker Corporation Ltd., Germany). Baseline correction and smoothing were performed.
2.2. Preparation of PNMA-CeO2-fMWCNTs composite
CeO2 NPs (2 mM), fMWCNTs (100 mg), and NMA (0.02 mM) were dispersed in 50 mL water with magnetic stirring at room temperature for 30 min. An aqueous solution was prepared by mixing (NH4)2S2O8 (2 mM) and HCl solution (10 mM) in a volumetric flask of 50 mL. Afterward, this solution was slowly added dropwise into the monomer solution, which was continuously stirred for 30 min to perform chemical polymerization. The prepared suspension was allowed to stand for one day to complete the polymerization. After that, ultra-pure water (120 mL) was added into the suspension and ultrasonicated for 5 min to obtain a dispersion. The dispersion was filtered and washed with ultra-pure water until it reached a neutral pH value. Lastly, the composite was dried in an oven at 60 °C. The same procedure was utilized for the preparation of other polymeric materials. NMA was distilled before synthesis.2.3. Preparation of the sensor
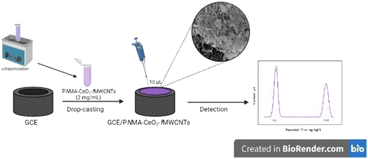
Firstly, the surface of a GCE was cleaned with Buehler alumina (Al2O3, 0.05 μm) solution on a cleaning pad. Then, the surface of the GCE was sequentially polished with 0.1 μm, 0.25 μm, and 0.3 μm diamond polish paste. Finally, the electrode was ultrasonically cleaned with ethyl alcohol and ultrapure water. For the modification process, different amounts of PNMA-CeO2-fMWCNTs were dispersed in an ultrasonic water bath for 1 h. Then, 10 μL of PNMA-CeO2-fMWCNTs was spread on the cleaned GCE surface and dried in an oven at 40 °C for about half an hour. In Scheme 1 given a schematic representation of the preparation of the sensor.2.4. Real-life sample analysis
The fetal bovine serum samples (Biological Industries) were diluted 10 and 100-fold in PBS without any pretreatment. The required amounts of UA and 5-FU were added to 2 mL of the real-life sample at different concentrations by standard addition method, and DPV measurements were performed under optimum conditions. In addition, recovery expressed as a standard deviation was evaluated.3. Results and discussion
3.1. Characterization of modified electrodes
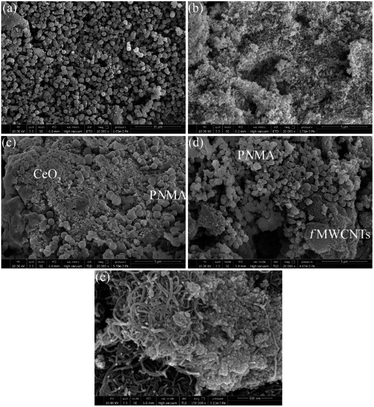 | ||
| Fig. 1 FE-SEM images of (a) PNMA, (b) CeO2 NPs, (c) PNMA-CeO2, (d) PNMA-fMWCNT, and (e) PNMA-CeO2-fMWCNT. | ||
Fig. 2 illustrates the XRD pattern of (a) commercial CeO2 NPs, (b) PNMA, (c) PNMA-CeO2, (d) PNMA-fMWCNTs, and (e) PNMA-CeO2-fMWCNTs composites. The polycrystalline CeO2 with cubic fluorite structure shows the typic diffraction peaks in Fig. 2(a), where the 2θ values coincide with the standard XRD card (JCPDS file no 34-0394). PNMA pattern demonstrates four diffraction peaks at 2θ ∼ 17.2°, 24.4°, 34.9°, and 39.1° (Fig. 2(b)). These peaks can be attributed to the characteristic semi-crystalline structure of PNMA.35–37 As seen in Fig. 2(c), the PNMA-CeO2 pattern exhibits similar to the diffractogram of CeO2 NPs. In the event of PNMA-fMWCNTs (Fig. 2(d)), the peaks of fMWCNTs in the composite are clearly visible. This pattern shows mainly two peaks at 2θ ∼ 25.7° and 43°, which are compatible with the literature.38 The pattern of the PNMA-CeO2-fMWCNTs composite is very similar to that of CeO2 NPs. Also, a small peak of fMWCNTs in the ternary composite is observed at 2θ ∼ 25.7° (Fig. 2(e)). The detailed morphological characterization of the CeO2 NPs was examined by TEM (Fig S2†). The TEM micrograph showed the presence of particles smaller than 100 nm. The CeO2 nanoparticles had cube and truncated octahedral-like morphologies and were found together in small particles.34
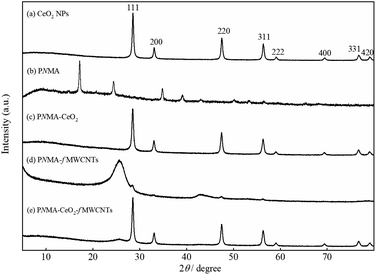 | ||
| Fig. 2 XRD pattern of (a) the CeO2 NPs, (b) PNMA, (c) PNMA-CeO2, (d) PNMA-fMWCNTs, and (e) PNMA-CeO2-fMWCNTs. | ||
Fig. 3 demonstrates the FT-IR spectra of the commercial CeO2 NPs, homopolymer, and composite materials. In the spectrum of the CeO2 NPs (Fig. 3(a)), the bands at 3424 and 1615 cm−1 can be attributed to the O–H vibration of the water adsorbed on the NPs. The bands at 1548, 1420, 1326, 1049, and 720 cm−1 are related to the Ce–O vibrations.39–41 The sharp band at about 472 cm−1 can be assigned to Ce–O39–42 stretching frequency. In the spectrum of PNMA (Fig. 3(b)), the broadband at 3266 cm−1 may be due to the O–H vibration of the water adsorbed onto the polymer and/or the N–H stretching motion of the aromatic units in the polymer chain.43 The bands located at 1598 and 1500 cm−1 are ascribed to the C![[double bond, length as m-dash]](https://www.rsc.org/images/entities/char_e001.gif) C stretching vibrations of the quinoid and the benzenoid units, respectively.43,44 The band at about 1233 cm−1 pertains to the C–N stretching vibration in the benzenoid ring.45,46 The band at about 1111 cm−1 may correspond to the in-plane C–H bending vibrations of the aromatic units.44,46 The band at about 824 cm−1 demonstrates the out-of-plane C–H bending vibrations of the aromatic units, which confirm the presence of 1,4-disubstituted benzene rings, indicating polymer formation.33,43,47 The bands at 1042 and 580 cm−1 can be attributed to the presence of S
C stretching vibrations of the quinoid and the benzenoid units, respectively.43,44 The band at about 1233 cm−1 pertains to the C–N stretching vibration in the benzenoid ring.45,46 The band at about 1111 cm−1 may correspond to the in-plane C–H bending vibrations of the aromatic units.44,46 The band at about 824 cm−1 demonstrates the out-of-plane C–H bending vibrations of the aromatic units, which confirm the presence of 1,4-disubstituted benzene rings, indicating polymer formation.33,43,47 The bands at 1042 and 580 cm−1 can be attributed to the presence of S![[double bond, length as m-dash]](https://www.rsc.org/images/entities/char_e001.gif) O groups of SO42− ions as the dopant to be incorporated into the polymer structure.44
O groups of SO42− ions as the dopant to be incorporated into the polymer structure.44
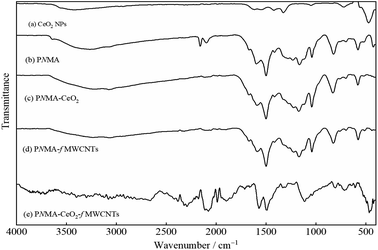 | ||
| Fig. 3 FT-IR spectrum of (a) the CeO2 NPs, (b) PNMA, (c) PNMA-CeO2, (d) PNMA-fMWCNTs, and (e) PNMA-CeO2-fMWCNTs. | ||
As seen in Fig. 3(c) and (d), the FT-IR spectra of PNMA-CeO2 and PNMA-fMWCNTs are similar to the spectrum of the PNMA homopolymer. They exhibit characteristic bands of the polymer, although there are shifts in band locations. The FT-IR spectrum of the PNMA-CeO2-fMWCNTs ternary composite presents mainly bands of PNMA homopolymer and some bands of other components (Fig. 3(e)).
The electrochemical characterizations of the GCE and modified electrodes were carried out in 0.1 M KCl containing 5.0 mM [Fe(CN)6]3−/4. Fig. 4 shows (A) CVs and (B) Nyquist plots at (a) a GCE, (b) a GCE/PNMA, (c) a GCE/PNMA-CeO2, (d) a GCE/fMWCNTs and (e) a GCE/CeO2-PNMA-fMWCNTs. Compared to bare GCE (Fig. 4A(a)), the redox peak currents for GCE/PNMA were almost constant, and its peak-to-peak separation (ΔEp) was slightly reduced (Fig. 4A(b)). After adding CeO2 to the PNMA polymer (Fig. 4A(c)), the peak currents of the modified electrode decreased and showed the highest ΔEp (363.8 mV). These results indicate that the electron transfer kinetics for GCE modified with PNMA-CeO2 are slower than bare GCE (ΔEp = 224.6 mV). On the other hand, when the GCE surface was modified with PNMA-fMWCNTs (Fig. 4A(d)), the redox probe's anodic and cathodic peak currents considerably increased, and a significant decrease in ΔEp (112.3 mV) was observed. We have used these results to infer that the conductivity and electroactive surface area of the fMWCNTs-modified electrode has significantly increased. In the case of the GCE/PNMA-CeO2-fMWCNTs composite electrode, the lowest ΔEp value with 100.1 mV and the significant increase in redox peak currents were observed, as seen in Fig. 4A(e). The prepared ternary composite-modified electrode exhibited better electron transfer properties than bare GCE. EIS was then utilized to investigate the electron transfer features of these electrodes. The Nyquist plots of the bare GCE and modified electrodes are given in Fig. 4B.
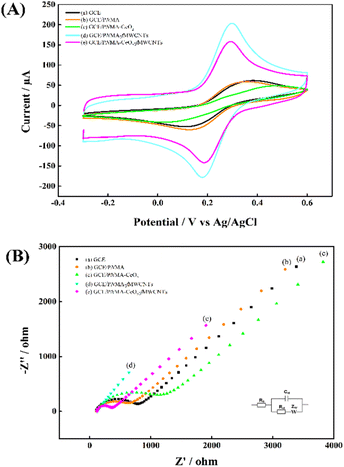 | ||
| Fig. 4 (A) CVs, (B) Nyquist plots of (a) GCE, (b) GCE/PNMA, (c) GCE/PNMA-CeO2, (d) GCE/PNMA-fMWCNTs and (e) GCE/PNMA-CeO2-fMWCNTs electrodes in 0.1 M KCl solution containing 5.0 mM [Fe(CN)6]3−/4−. | ||
The corresponding electron transfer resistance (Rct) of [Fe(CN)6]3−/4− at the bare GCE, GCE/PNMA, GCE/PNMA-CeO2, GCE/PNMA-fMWCNTs, and GCE/PNMA-CeO2-fMWCNTs electrodes were found to be about 659, 538, 1049, 9 and 224 ohms, respectively. As seen in Fig. 4B, the largest semicircular diameter and, therefore, the highest Rct value belong to GCE/PNMA-CeO2 (Fig. 4B(c)). The lowest Rct value was obtained at the GCE/PNMA-CeO2-fMWCNTs electrode. According to the results obtained from the CV and EIS measurements, the ternary hybrid composite modified GCE shows fast electron transfer kinetics.
The effect of scan rate on the performance of the GCE/PNMA-CeO2-fMWCNTs electrode was investigated using cyclic voltammetry. For this purpose, cyclic voltammograms of the prepared electrode versus Ag/AgCl were recorded in 5.0 mM [Fe(CN)6]3−/4− from (−0.3 V) to (+0.6 V) over a scan rate range of 10–250 mV s−1. The results obtained are displayed in (Fig. S3(a)†). As the sweep rate increased, the peak current signals increased, and the anodic and cathodic peak potentials shifted slightly to more positive and negative voltages, respectively. The anodic and cathodic peak currents calculated from the voltammograms against the square root of the scan rate were plotted, and a linear relationship was observed from the plot (Fig. S3(b)†). This result indicates that the electron transfer process at the solution–electrode interface is mainly diffusion-controlled.48 The electroactive surface area (EASA) of the platforms was determined using the Randles–Sevčik equation (eqn (1)) for semi-reversible electron transfer processes34,49,50. The EASA of the GCE/PNMA-CeO2-fMWCNTs electrode was calculated as 0.138 cm2, while that of GCE was 0.071 cm2. Similarly, there was a 2× increase in the surface area of the PNMA-CeO2-fMWCNT composite-modified electrode.
| ip = (2.69 × 10⁵)n3/2ACD1/2v1/2 | (1) |
3.2 Electrochemical behavior of UA and 5-FU at the bare and modified GCEs
CV and DPV measurements were also performed in pH 6.0 PBS to evaluate the response of these electrodes to analytes. Fig. 5 shows (A) CVs, (B) DPVs of (a) GCE, (b) GCE/PNMA, (c) GCE/PNMA-CeO2, (d) GCE/fMWCNTs, and (e) GCE/PNMA-CeO2-fMWCNTs electrodes. The high peak current signal for 5-FU and UA analytes was obtained with the GCE/PNMA-CeO2-fMWCNTs composite electrode (Fig. 5A(e) and B(e)). Considering the increase in the peak current responses for both analytes, it is seen that the PNMA-CeO2-fMWCNTs composite material can be regarded as a good platform material. The increase in peak current signals for the electrochemical oxidation reactions of 5-FU and UA analytes compared to the bare electrode can be attributed to the conductivity and large surface area of the ternary composite material.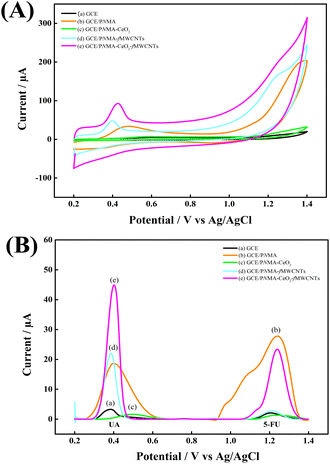 | ||
| Fig. 5 (A) CVs, (B) DPVs in PBS with a concentration of 0.3 mM UA and 1.2 mM 5-FU of (a) GCE, (b) GCE/PNMA, (c) GCE/PNMA-CeO2, (d) GCE/fMWCNTs and (e) GCE/PNMA-CeO2-fMWCNTs electrodes. | ||
The effect of scan rate on the analyte response of the GCE/PNMA-CeO2-fMWCNTs electrode was investigated separately for both analytes using the CV technique. For this purpose, the CVs of the prepared electrode were recorded at scan rates of 25–250 mV s−1 in PBS (pH 6.0). The CV curves for UA and 5-FU were illustrated in Fig. S4 and S5(a),† respectively. The CV measurements for UA and 5-FU were implemented in the potential range of (0.2 V)–(+1.0 V) and (0.9 V)–(+1.7 V), respectively. With a rising scanning rate, while the oxidation peak signals of UA and 5-FU enhance, the oxidation peak potentials move in an anodic direction. The graphs of ipvs. v1/2, ipvs. v, and log![[thin space (1/6-em)]](https://www.rsc.org/images/entities/char_2009.gif) ipvs. log
ipvs. log![[thin space (1/6-em)]](https://www.rsc.org/images/entities/char_2009.gif) v are demonstrated in Fig. S4 and S5(b)–(d).† As seen in Fig. S4 and S5(b) and (c),† the correlation coefficient of the Ipvs. v1/2 graph is higher than the Ipvs. v graph. Furthermore, the slope of the log
v are demonstrated in Fig. S4 and S5(b)–(d).† As seen in Fig. S4 and S5(b) and (c),† the correlation coefficient of the Ipvs. v1/2 graph is higher than the Ipvs. v graph. Furthermore, the slope of the log![[thin space (1/6-em)]](https://www.rsc.org/images/entities/char_2009.gif) Ipvs. log
Ipvs. log![[thin space (1/6-em)]](https://www.rsc.org/images/entities/char_2009.gif) v for UA and 5-FU analytes was found to be 0.568 and 0.567 (Fig. S4 and S5(d)†), respectively, which are close to the theoretical value of 0.5 for a diffusion-controlled process.51,52 These results indicate that the electrochemical oxidation reactions of UA and 5-FU analytes are the mainly diffusion-controlled process at GCE modified with PNMA-CeO2-fMWCNTs ternary composite.
v for UA and 5-FU analytes was found to be 0.568 and 0.567 (Fig. S4 and S5(d)†), respectively, which are close to the theoretical value of 0.5 for a diffusion-controlled process.51,52 These results indicate that the electrochemical oxidation reactions of UA and 5-FU analytes are the mainly diffusion-controlled process at GCE modified with PNMA-CeO2-fMWCNTs ternary composite.
The electron transfer coefficient (α) for the electrochemical oxidation reaction of UA and 5-FU at GCE/PNMA-CeO2-fMWCNTs can be calculated utilizing eqn (2), which is valid for a totally irreversible diffusion-controlled process:53,54
 | (2) |
![[thin space (1/6-em)]](https://www.rsc.org/images/entities/char_2009.gif) v for UA and 5-FU are shown in Fig. S6.† If n = 2 was assumed at 25 °C, the α for UA and 5-FU was found to be 0.66 and 0.63, respectively.
v for UA and 5-FU are shown in Fig. S6.† If n = 2 was assumed at 25 °C, the α for UA and 5-FU was found to be 0.66 and 0.63, respectively.
The diffusion coefficient in a completely irreversible diffusion-controlled process may be determined using eqn (3), representing the linear relationship between the ip and v1/2:55
 | (3) |
 is the bulk concentration of analyte, n′ is the total number of electrons in the oxidation reaction, A is the surface area, and v is the scan rate. The mean D0 value for UA and 5-FU in the range of 0.025–0.200 V s−1 scan rates was determined as (1.8 ± 0.2) × 10−6 and (7.6 ± 0.9) × 10−8 cm2 s−1, respectively. The standard rate constant (k0) at 298 K can be calculated by using eqn (4) in an irreversible electrochemical reaction.56,57
| k0 = 1.11 D01/2 (Ep − Ep/2)−1/2v1/2 | (4) |
The mean k0 value for UA and 5-FU at GCE/PNMA-CeO2-fMWCNTs electrode in the range of 0.025–0.200 V s−1 scan rates was obtained as (2.6 ± 0.7) × 10−3 and (4.8 ± 1.3) × 10−4 cm s−1, respectively.
3.3 Effect of modifier amount
The effect of the modifier amount on the electrochemical responses of UA and 5-FU was studied to determine the optimum composite amount for preparing the GCE/PNMA-CeO2-fMWCNTs electrode. For this purpose, five modified GCEs were designed with 0.25, 0.5, 1.0, 2.0, and 3.0 mg mL−1 of PNMA-CeO2-fMWCNTs dispersion, keeping the pH and analyte concentration constant. CV measurements were performed in a redox probe solution containing 5 mM Fe(CN)63−/4− with the modified electrodes having different composite amounts (Fig. 6A). As shown in Fig. 6A, the highest redox probe response at the 3.0 mg mL−1 concentration of PNMA-CeO2-fMWCNTs. Moreover, the DPV technique was used to assess the response of each electrode to the UA and 5-FU analytes. After each electrode achieved stability by applying successive DPV measurements in pH 5.0 PBS buffer, both analytes were added successively. DPV measurements were taken thrice against Ag/AgCl in the (+0.2 V)–(+1.7 V) range. Fig. 6B shows that the peak signals of UA and 5-FU increase up to the composite amount of 2 mg mL−1. The increase in the oxidation peak current of both analytes may be due to increased conductivity and efficient surface area with increasing the amount of composite. At 3.0 mg mL−1 composite amount, there was a decrease in the peak current. It was thought that this decrease might be due to the shedding of a part of the composite from the electrode that accumulated too much or a reduction of electroactive surface area due to aggregation of PNMA-CeO2-fMWCNTs. The optimum value was the 2.0 mg mL−1 composite amount with the highest peak current (Fig. 6B).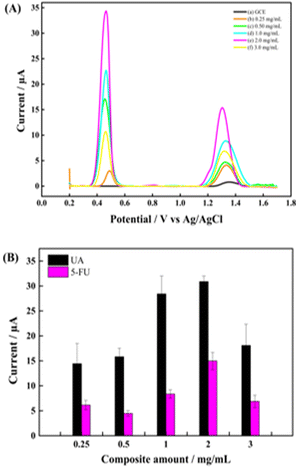 | ||
| Fig. 6 (A) DPVs, and (B) bar chart graph of electrodes in composite amounts (a) GCE, (b) 0.25 mg mL−1, (c) 0.50 mg mL−1, (d) 1.0 mg mL−1 (e) 2.0 mg mL−1 and (f) 3.0 mg mL−1. | ||
3.4 Effect of pH
It is known that the pH of the electrolyte solution significantly affects the electrochemical response of the analytes.18Different PBS buffers in the pH 2.0–8.0 were prepared to investigate the effect of pH on the electrochemical oxidation signals of UA and 5-FU at the GCE/PNMA-CeO2-fMWCNTs electrode. It was observed that the peak potential of both analytes shifted toward the negative direction as the pH of the buffer solution increased (Fig. 7A). This result indicates that the proton is involved in the electrochemical oxidation reactions of the analytes. The results show that the electrochemical response of UA and 5-FU increases up to pH 6.0 and decreases at higher pHs (Fig. 7A(f) and (g)). The highest current responses for each molecule were obtained at pH 6.0 (Fig. 7B). From this point of view, the optimum pH for the analysis medium was determined as 6.0. Subsequent studies have been carried out at this pH. The pH values were plotted against the peak potentials of UA and 5-FU, exhibiting linear relationships. The Epa (mV) = −66.33 pH + 1636.65 (R2 = 0.990) for UA and Epa (mV) = −62.48 pH + 777.05 (R2 = 0.994) for 5-FU are the linear regression equations (Fig. 7C).
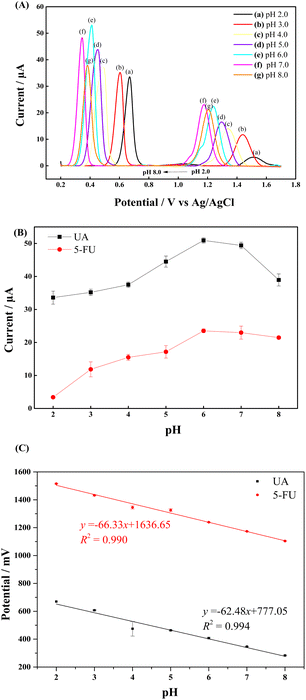 | ||
| Fig. 7 (A) DPV curves of 0.3 mM UA and 1.2 mM 5-FU at various pH values. Effect of pH on (B) DPV peak current and (C) DPV peak potential for the oxidation of 0.3 mM UA and 1.2 mM 5-FU in 0.1 M PBS. | ||
The slopes of the curves for UA and 5-FU are, respectively, 66.33 mV/pH and 62.48 mV/pH, which are almost near to the 59.0 mV/pH theoretical Nernst value (eqn (5)).58
| Epa = −59.0 pH + constant | (5) |
According to this finding, a unity number of protons participating in the reaction equals a unity number of electrons transported.59,60
3.5 Individual and simultaneous determination of UA and 5-FU
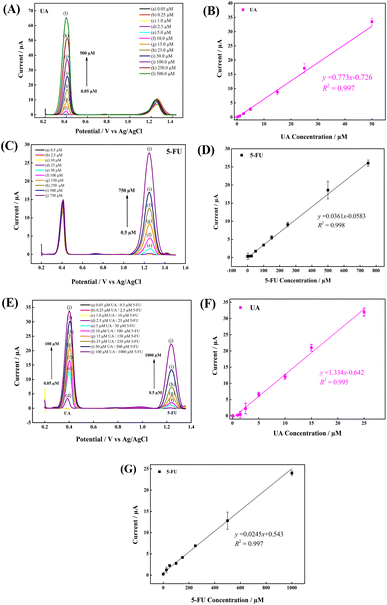
The voltammetric determination of UA and 5-FU was evaluated via the DPV technique in PBS. As shown in Fig. 8, an increase in both peak currents were observed as analyte concentrations increased. Fig. 8(A)–(G) show the DPVs and related calibration plots for individual and simultaneous detection of UA and 5-FU. As shown in Fig. 8(A) and (C), the concentration of one analyte was increased while the concentration of the other analyte was kept constant. Fig. 8A shows the DPV responses of increasing UA concentration from 0.25 μM to 50 μM, while keeping the 5-FU concentration constant at 150 μM, at a GCE/PNMA-CeO2-fMWCNTs, and Fig. 8C shows the corresponding DPV responses of increasing 5-FU concentration from 0.5 μM to 750 μM, while keeping the UA concentration constant at 25 μM. Fig. 8E shows the DPV plots obtained by sequentially increasing both analyte concentrations. In both individual and simultaneous determinations, a sharp increase in DPV responses was observed with the addition of sequential analyte concentrations and a linear relationship. The limits of detection (LOD) and limit of quantification (LOQ) at the GCE/PNMA-CeO2-fMWCNTs were estimated based on the expression ks/m, where k is 3 for the limit of detection and 10 for the limit of quantification, s is the standard deviation of 3 measurements of the lowest concentration of the blank response, and m is the slope of the calibration plot.61The LOD and LOQ values for UA and 5-FU were 0.04 μM, 0.15 μM, and 0.19 μM, 0.63 μM, respectively. The LOD and LOQ values were also calculated for each analyte at the GCE/PNMA-CeO2-fMWCNTs electrode. The LOD and LOQ values were 0.03 μM, 0.09 μM for UA (0.25–25 μM linear range) and 0.29 μM, 0.98 μM for 5-FU (0.5–1000 μM linear range) respectively. All analytical performance values are given in Table 1. The proposed electrode was proven to have a low LOD and a broad linear response for the simultaneous electrochemical detection of UA and 5-FU.
| Analyte | Linear equation | Linear range (μM) | LOD (μM) | LOQ (μM) |
|---|---|---|---|---|
| UA | I pa = 0.773x − 0.726 (R2 = 0.997) | 0.25–50.0 | 0.04 | 0.15 |
| 5-FU simultaneous | I pa = 0.0361x − 0.0583 (R2 = 0.998) | 0.5–750.0 | 0.19 | 0.63 |
| UA | I pa = 1.334x − 0.642 (R2 = 0.995) | 0.25–25.0 | 0.03 | 0.09 |
| 5-FU | I pa = 0.0245 + 0.543 (R2 = 0.997) | 0.5–1000.0 | 0.29 | 0.98 |
In Table 2, the performance of the GCE/PNMA-CeO2-fMWCNTs is compared with other sensors that have been developed with similar materials to determine UA. The developed sensor demonstrates excellent analytical performance for UA. When the newly developed electrode was compared with previous studies, it was seen that the LOD value was three times lower than the electrode prepared with CeO2 (ref. 31) and about ten times lower than the electrode prepared only with MWCNTs62 in UA determination. The obtained sensor has lower LOD values compared to different sensors.32,48,59,66 The production of MOF-71 is generally tricky and complex. However, MOF-71 showed a worse analytical performance with a lower LOD value than the one-step prepared PNMA-CeO2-fMWCNTs composite.48
| Sensor platform | Method | Linear range (μM) | LOD (μM) | Real sample | Ref. |
|---|---|---|---|---|---|
| a MOF-71: metal–organic frameworks, CCE: carbon ceramide electrode, P(Arg): poly(L-arginine), GO: graphene oxide. | |||||
| Co–CeO2/GCE | SWV | 1.0–2200.0 | 0.12 | Human urine | 31 |
| MGCE/MWCNT-COOH-AuNPs | DPV | 2.5–275.0 | 0.050 | Human serum and urine | 66 |
| MOF-71/GCE | DPV | 50–1000.0 | 15.61 | — | 48 |
| MWCNT/CCE | DPV | 0.55–90.00 | 0.42 | Human serum and some commercial pharmaceutical sample | 62 |
| AgNPs/P(Arg)-GO | DPV | 0.5–150.0 | 0.142 | Human urine samples | 59 |
| GO-AgNPs@MWCNTs | DPV | 0.5–6.5 | 0.0258 | Human serum | 67 |
| N-CQD@Fe2O3/MWCNT/GCE | DPV | 0.5–265.0 | 0.106 | Human urine | 32 |
| GCE/PNMA-CeO2-fMWCNTs | DPV | 0.25–25.0 | 0.040 | Fetal bovine serum | This work |
Table 3 compares the performance of the newly developed 5-FU sensor with previously developed sensors prepared with similar materials. The sensor presented an extensive linear range from 0.5 μM to 1000 μM with the LOD value of 0.19 μM for 5-FU which is lower than those reported in the literature63–65,68 The developed sensor presented a wider linear working range than numerous studies in the literature.32,64,65
| Sensor platform | Method | Linear range (μM) | LOD (μM) | Real sample | Ref. |
|---|---|---|---|---|---|
| a BTB: bromothymol blue, N-CQD: nitrogen-doped carbon quantum dots, CPE: carbon paste electrodes modified, AuNps-PFR: porphyrin-capped gold nanoparticles. | |||||
| MWNTs/BTB/GCE | CV | 0.8–5000.0 | 0.267 | Injection sample | 63 |
| Poly(bromocresol purple); double-strand DNA | CV | 32.29–189.96 | 1.17 | Pharmaceutical samples | 65 |
| CPE/AuNps-PFR | DPV | 29.9–234.4 | 0.67 | Pharmaceutical sample | 64 |
| CPE/PFR | DPV | 29.9–234.4 | 5.36 | Pharmaceutical sample | |
| N-CQD@Fe2O3/MWCNT/GCE | DPV | 0.5–120.0 | 0.019 | Human urine | 32 |
| h-MoS2 | DPV | 200.0–7000.0 | 5.62 | Human serum | 68 |
| GCE/PNMA-CeO2-fMWCNTs | DPV | 0.5–1000.0 | 0.19 | Fetal bovine serum | This work |
3.6 Interference study
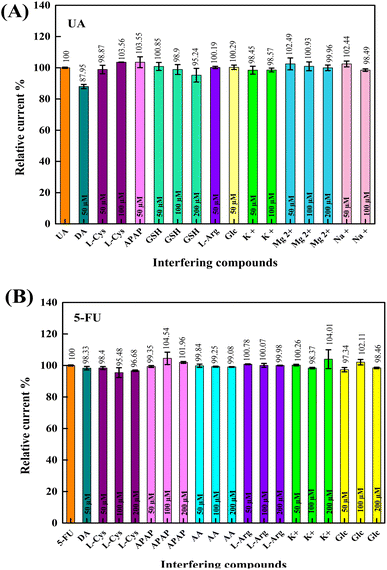
The effects of some interfering substances on the electrochemical responses of UA and 5-FU were investigated under optimum conditions to determine the selectivity of the developed composite sensor. For this purpose, 0.01 M of L-arginine (L-Arg), L-cysteine (L-Cys), L-tryptophan (L-Trp), acetaminophen (APAP), L-glutathione reduced (GSH), L-ascorbic acid (AA), dopamine. HCl (DA), D-glucose (Glc), magnesium chloride, sodium chloride, and potassium chloride were used. In pH 6.0 PBS, interfering substances were added to the analytes at different concentrations, and DPV measured their responses. In this way, the effect of concentration was also analyzed. Stock solutions of the compounds mentioned above were added to the electrochemical cells containing 100 μM UA and 5-FU at the half, the same, and twice the analyte concentration (50, 100, and 200 μM). DPV responses of the analytes were evaluated in terms of the relative current % of each interfering compound. As shown in Fig. 9A and B, there was no significant interference effect on the relative current (88–104%) of UA and 5-FU. It can be concluded that the GCE/PNMA-CeO2-fMWCNTs sensor has an excellent anti-interference ability for the selective detection of UA and 5-FU.3.7 Repeatability, reproducibility, and storage
In sensor applications, it is crucial to determine the repeatability of the same electrode measurements and how long these devices can operate with a reliable and reproducible response. To test the repeatability of the UA and 5-FU composite sensor response, five consecutive measurements were performed with 300 μM UA and 1200 μM 5-FU solution on the same day. The relative standard deviation (RSD%) was calculated as 1.85% and 2.03% for UA and 5-FU, respectively. According to the results, if the sensor was not exposed to any contamination or impact during electrochemical analysis, the sensor is excellent in terms of repeatability. The correspondence between the responses calculated from the same electrode indicates that the response is more precise. The reproducibility of 3 different GCE/PNMA-CeO2-fMWCNTs electrodes was determined by measuring the analyte responses towards 300 μM UA and 1200 μM 5-FU. The RSD value was evaluated as 2.09% and 2.89% for UA and 5-FU, respectively. The storage stability of the sensor was evaluated by measuring the electrode response for 13 days. The current response of UA decreased to 82.27% after 13 days, and the current response of 5-FU decreased to 74.99% after 8 days.3.8 Real-life sample analysis
The applicability of the developed GCE/PNMA-CeO2-fMWCNTs sensor was investigated by standard addition method with DPV measurements of UA and 5-FU in fetal bovine serum samples. Different analyte concentrations were added to the serum samples to examine the applicability of the proposed method. Recovery (%) values for each concentration were calculated. As seen in Table 4, the sensor can detect UA and 5-FU with an acceptable recovery range and has good practical application.| a N = 3 for the determination of mean recovery of three replications. | |||
|---|---|---|---|
| UA | 1/10 | 5 | 99.41 ± 1.72 |
| 10 | 98.44 ± 1.47 | ||
| 25 | 102.11 ± 2.04 | ||
| 5-FU | 1/10 | 25 | 98.16 ± 1.04 |
| 150 | 87.46 ± 4.25 | ||
| 1/100 | 50 | 99.70 ± 0.65 | |
| 100 | 98.82 ± 1.14 | ||
| 150 | 100.32 ± 1.67 | ||
4. Conclusion and future trends
In this study a highly efficient cerium oxide-poly(N-methyl aniline)-functionalized MWCNTs (CeO2-PNMA-fMWCNTs) electrochemical composite was synthesized to modify sensor surface to detect UA and 5-FU simultaneously. In medical practice, they should be kept in a concentration range of 120–450 μM UA in human blood and 0.1–1.0 μM 5-FU during chemotherapy in human blood plasma or serum. Therefore, the measurements of these analytes should be performed regularly for human health, disease detection, and treatment progress. According to the LOQ values obtained with the sensor developed in the study (0.15 and 0.63 μM for UA and 5-FU, respectively), performing the simultaneous determination of these analytes is possible. The GCE/PNMA-CeO2-fMWCNTs sensor was found to have an excellent anti-interference ability for the selective detection of UA and 5-FU. Determining the UA and 5-FU simultaneously at the one-step prepared composite modified GCE will provide benefits such as short analysis time, low material usage, and no need for specialists. The sensor could be successfully applied to real-life samples. In this respect, the developed sensor is a promising material for medical applications.The one-step prepared composites are perfect for utilization in electrochemical sensing because of their special qualities, which include high conductivity, a broad active surface, and high conductivity. Also, these electrode materials can be diversified with different polymeric or carbon materials. Sensors manufactured using composites prepared in a one-step process provide the practicality of sensing. Therefore, it is envisaged that the developed sensor will enable simultaneous, sensitive, and selective determination of different types of pharmaceuticals in future studies.
Author contributions
K. Turan performed formal analysis, obtained the data, and wrote the original draft. A. Üğe performed synthesis procedure. B. Zeybek supervised the whole work, reviewed and analyzed the data. G. Aydoğdu Tığ reviewed and analyzed the data, edited the manuscript.Conflicts of interest
There are no conflicts to declare.Acknowledgements
Kübra Turan was supported by The Scientific and Technological Research Council of Türkiye (TÜBİTAK) with a 2218-National Postdoctoral Research Fellowship Program scholarship in the 121C426 number project. The authors would also thank the Ankara University Scientific Research Projects Coordination Unit (project no. FBA-2022-2628, ADEP).References
- S. J. Lee, B. K. Oh and K. C. Sung, Clin. Hypertens., 2020, 26, 1–7 CrossRef.
- A. Vernerová, L. Kujovská Krčmová, B. Melichar and F. Švec, Clin. Chem. Lab. Med., 2021, 59, 797–812 CrossRef PubMed.
- S. Aafria, P. Kumari, S. Sharma, S. Yadav, B. Batra, J. S. Rana and M. Sharma, Microchem. J., 2022, 182, 107945 CrossRef.
- J. A. Buledi, S. Ameen, S. A. Memon, A. Fatima, A. R. Solangi, A. Mallah, F. Karimi, S. Malakmohammadi, S. Agarwal and V. K. Gupta, Open Chem., 2021, 19, 481–491 CrossRef.
- Q. Wang, X. Wen and J. Kong, Crit. Rev. Anal. Chem., 2020, 50, 359–375 CrossRef PubMed.
- D. Plausinaitis, L. Sinkevicius, U. Samukaite-Bubniene, V. Ratautaite and A. Ramanavicius, Talanta, 2020, 220, 121414 CrossRef PubMed.
- M. K. Muthukumaran, M. Govindaraj, B. K. Raja and J. Arockia Selvi, RSC Adv., 2023, 13, 2780–2794 RSC.
- V. Mariyappan, M. Keerthi, S.-M. Chen and G. Boopathy, J. Electrochem. Soc., 2020, 167, 117506 CrossRef.
- M. Hadi, T. Mollaei and A. Ehsani, Chem. Pap., 2018, 72, 431–439 CrossRef.
- B. Mutharani, P. Ranganathan and S. M. Chen, Sens. Actuators, B, 2020, 304, 127361 CrossRef.
- C. Sethy and C. N. Kundu, Biomed. Pharmacother., 2021, 137, 111285 CrossRef PubMed.
- D. S. K. Vishnu, P. Ranganathan, S. P. Rwei, C. Pattamaprom, T. Kavitha and P. Sarojini, Int. J. Biol. Macromol., 2020, 148, 79–88 CrossRef.
- K. Y. Goud, M. Satyanarayana, A. Hayat, K. V. Gobi and J. L. Marty, Nanomaterial-Based Electrochemical Sensors in Pharmaceutical Applications, Elsevier Inc., 2019 Search PubMed.
- M. Jiao, X. Fan, Z. Wang, K. Wu, A. Deng and J. Li, Microchem. J., 2022, 183, 108066 CrossRef CAS.
- Y. Liu, P. Zhu, Z. Huang, L. Zhou and P. Shi, J. Chromatogr. B: Anal. Technol. Biomed. Life Sci., 2018, 1076, 1–7 CrossRef CAS.
- C. Ma, N. Jiang, X. Sun, L. Kong, T. Liang, X. Wei and P. Wang, Biosens. Bioelectron., 2023, 237, 115495 CrossRef CAS PubMed.
- S. Tvorynska, J. Barek and B. Josypčuk, Sens. Actuators, B, 2021, 344, 130252 CrossRef CAS.
- F. Xu, L. Wang, M. Wu and G. Ma, Sens. Actuators, B, 2023, 386, 133734 CrossRef CAS.
- J. Yu, L. Ge, J. Huang, S. Wang and S. Ge, Lab Chip, 2011, 11, 1286–1291 RSC.
- S. Zhao, J. Wang, F. Ye and Y. M. Liu, Anal. Biochem., 2008, 378, 127–131 CrossRef CAS.
- B. Hatamluyi, Z. Es, F. Modarres and M. Darroudi, Sens. Actuators, B, 2019, 286, 540–549 CrossRef CAS.
- E. Asadian, M. Ghalkhani and S. Shahrokhian, Sens. Actuators, B, 2019, 293, 183–209 CrossRef CAS.
- J. G. Manjunatha, Open Chem. Eng. J., 2020, 14, 52–62 CrossRef CAS.
- B. Dey, W. Ahmad, G. Sarkhel, G. Ho Lee and A. Choudhury, Microchem. J., 2023, 186, 108295 CrossRef.
- P. A. Pushpanjali, J. G. Manjunatha and N. Hareesha, J. Electrochem. Sci. Eng., 2021, 11, 161–177 Search PubMed.
- V. Ratautaite, U. Samukaite-Bubniene, D. Plausinaitis, R. Boguzaite, D. Balciunas, A. Ramanaviciene, G. Neunert and A. Ramanavicius, Int. J. Mol. Sci., 2021, 22, 1–18 Search PubMed.
- X. Lu, J. Zheng, D. Chao, J. Chen, W. Zhang and Y. Wei, J. Appl. Polym. Sci., 2006, 100, 2356–2361 CrossRef.
- L. H. Ai, X. B. Wang, Z. L. Chen and J. Jiang, J. Macromol. Sci., Part B: Phys., 2010, 49, 953–959 CrossRef.
- M. Roushani, Z. Saeidi, S. Hemati and M. Hosseini, Adv. Nanochem., 2019, 1, 73–77 Search PubMed.
- M. Satyanarayana, K. Y. Goud, K. K. Reddy and K. V. Gobi, Electrochim. Acta, 2015, 178, 608–616 CrossRef CAS.
- N. Lavanya, C. Sekar, R. Murugan and G. Ravi, Mater. Sci. Eng. C, 2016, 65, 278–286 CrossRef CAS.
- M. Ganesan, K. D. Ramadhass, H. C. Chuang and G. Gopalakrishnan, J. Mol. Liq., 2021, 331, 115768 CrossRef CAS.
- B. Zeybek, N. Ozcicek Pekmez and E. Kiliç, Electrochim. Acta, 2011, 56, 9277–9286 CrossRef CAS.
- A. Üğe, D. Koyuncu Zeybek and B. Zeybek, J. Electroanal. Chem., 2018, 813, 134–142 CrossRef.
- S. Khasim, Results Phys., 2019, 12, 1073–1081 CrossRef.
- S. Bhadra and D. Khastgir, Polym. Test., 2008, 27, 851–857 CrossRef CAS.
- B. Sydulu Singu, P. Srinivasan and S. Pabba, J. Electrochem. Soc., 2011, 159, A6–A13 CrossRef.
- A. Thamilselvan, V. Rajagopal and V. Suryanarayanan, J. Alloys Compd., 2019, 786, 698–706 CrossRef CAS.
- H. Li, G. Wang, F. Zhang, Y. Cai, Y. Wang and I. Djerdj, RSC Adv., 2012, 2, 12413–12423 RSC.
- R. Pournajaf, S. A. Hassanzadeh-Tabrizi and M. Jafari, Ceram. Int., 2014, 40, 8687–8692 CrossRef.
- M. Singh, N. Nesakumar, S. Sethuraman, U. M. Krishnan and J. B. B. Rayappan, J. Colloid Interface Sci., 2014, 425, 52–58 CrossRef.
- S. Phoka, P. Laokul, E. Swatsitang, V. Promarak, S. Seraphin and S. Maensiri, Mater. Chem. Phys., 2009, 115, 423–428 CrossRef.
- H. Fan, H. Wang, J. Guo, N. Zhao and J. Xu, J. Colloid Interface Sci., 2014, 414, 46–49 CrossRef.
- L. Zhang and M. Wan, Nanotechnology, 2002, 13, 750–755 CrossRef CAS.
- J. L. Camalet, J. C. Lacroix, S. Aeiyach, K. Chane-Ching and P. C. Lacaze, Synth. Met., 1998, 93, 133–142 CrossRef CAS.
- G. A. Planes, G. M. Morales, M. C. Miras and C. Barbero, Synth. Met., 1998, 97, 223–227 CrossRef CAS.
- R. Rajagopalan and J. O. Iroh, Appl. Surf. Sci., 2003, 218, 58–69 CrossRef CAS.
- S. A. Abrori, N. L. W. Septiani, F. N. Hakim, A. Maulana, N. Suyatman, I. Anshori and B. Yuliarto, IEEE Sens. J., 2021, 21, 170–177 CAS.
- G. Aydoğdu, D. K. Zeybek, B. Zeybek and Ş. Pekyardımcı, J. Appl. Electrochem., 2013, 43, 523–531 CrossRef.
- R. O. Kadara, N. Jenkinson and C. E. Banks, Sens. Actuators, B, 2009, 138, 556–562 CrossRef CAS.
- A. S. Kumar and P. Swetha, Colloids Surf., A, 2011, 384, 597–604 CrossRef CAS.
- R. Thangaraj and A. S. Kumar, Anal. Methods, 2012, 4, 2162–2171 RSC.
- A. Masek, E. Chrzescijanska and M. Zaborski, Food Chem., 2014, 148, 18–23 CrossRef CAS PubMed.
- R. J. Klingler and J. K. Kochi, J. Am. Chem. Soc., 1980, 102, 4790–4798 CrossRef CAS.
- Electrochemical Methods Fundamentals and Applications, ed. A. J. Bard and L. R. Faulkner, John Wiley & Sons, Inc., New York, USA, 2nd edn, 2001 Search PubMed.
- J. González Velasco, Electroanalysis, 1997, 9, 880–882 CrossRef.
- M. A. Rashed, M. Faisal, M. Alsaiari, S. A. Alsareii and F. A. Harraz, Electrocatalysis, 2021, 12, 650–666 CrossRef CAS.
- D. A. Skoog, D. M. West, F. J. Holler and S. R. Crouch, Fundamentals of Analytical Chemistry, Cengage Learning, 2013 Search PubMed.
- G. A. Tığ, J. Electroanal. Chem., 2017, 807, 19–28 CrossRef.
- X. Zhang, J. Zhu, Z. Wu, W. Wen, X. Zhang and S. Wang, Anal. Chim. Acta, 2023, 1239, 340743 CrossRef CAS PubMed.
- E. Ö. Bolat, G. A. Tığ and Ş. Pekyardımcı, J. Electroanal. Chem., 2017, 785, 241–248 CrossRef CAS.
- B. Habibi and M. H. Pournaghi-Azar, Electrochim. Acta, 2010, 55, 5492–5498 CrossRef CAS.
- X. Hua, X. Hou, X. Gong and G. Shen, Anal. Methods, 2013, 5, 2470–2476 RSC.
- D. Lima, G. N. Calaça, A. G. Viana and C. A. Pessôa, Appl. Surf. Sci., 2018, 427, 742–753 CrossRef CAS.
- D. Koyuncu Zeybek, B. Demir, B. Zeybek and Ş. Pekyardimci, Talanta, 2015, 144, 793–800 CrossRef CAS PubMed.
- C. Ferrag, M. Noroozifar and K. Kerman, Mater. Sci. Eng. C, 2020, 110, 110568 CrossRef CAS PubMed.
- A. G. K. Tchekep, V. Suryanarayanan and D. K. Pattanayak, Carbon, 2023, 204, 57–69 CrossRef CAS.
- H. H. Ipekci, Anal. Methods, 2023, 15, 2989–2996 RSC.
Footnote |
| † Electronic supplementary information (ESI) available. See DOI: https://doi.org/10.1039/d3ay02099a |
| This journal is © The Royal Society of Chemistry 2024 |

