 Open Access Article
MnO2/Ce6 microbubble-mediated hypoxia modulation for enhancing sono-photodynamic therapy against triple negative breast cancer†
Ping
Li‡
a,
Xiao
Tan‡
 ab,
Qing
Dan‡
a,
Azhen
Hu‡
a,
Zhengming
Hu‡
a,
Xiaoting
Yang
a,
Jianhua
Bai
a,
Xiaoyu
Chen
a,
Bowei
Li
c,
Guanxun
Cheng
c,
Li
Liu
*a,
Yun
Chen
*a,
Desheng
Sun
 *a,
Xintao
Shuai
 *d and
Tingting
Zheng
 *a
*a
aShenzhen Key Laboratory for Drug Addiction and Medication Safety, Department of Ultrasound, Institute of Ultrasonic Medicine, Peking University Shenzhen Hospital, Shenzhen Peking University-The Hong Kong University of Science and Technology Medical Center, Shenzhen 518036, P.R. China. E-mail: liuli@pkuszh.com; yunchen@sphmc.org; szdssun@163.com; kyzs_018@126.com
bZunyi Medical University, Zunyi 563000, P.R. China
cDepartment of Medical Imaging, Peking University Shenzhen Hospital, Shenzhen 518036, P.R. China
dSun Yat-sen University, Guangzhou 510000, P.R. China. E-mail: shuaixt@mail.sysu.edu.cn
First published on 6th February 2024
Abstract
Sono-photodynamic therapy (SPDT) has emerged as a promising treatment modality for triple negative breast cancer (TNBC). However, the hypoxic tumor microenvironment hinders the application of SPDT. Herein, in this study, a multifunctional platform (MnO2/Ce6@MBs) was designed to address this issue. A sono-photosensitizer (Ce6) and a hypoxia modulator (MnO2) were loaded into microbubbles and precisely released within tumor tissues under ultrasound irradiation. MnO2in situ reacted with the excess H2O2 and H+ and produced O2 within the TNBC tumor, which alleviated hypoxia and augmented SPDT by increasing ROS generation. Meanwhile, the reaction product Mn2+ was able to achieve T1-weighted MRI for enhanced tumor imaging. Additionally, Ce6 and microbubbles served as a fluorescence imaging contrast agent and a contrast-enhanced ultrasound imaging agent, respectively. In in vivo anti-tumor studies, under the FL/US/MR imaging guidance, MnO2/Ce6@MBs combined with SPDT significantly reversed tumor hypoxia and inhibited tumor growth in 4T1-tumor bearing mice. This work presents a theragnostic system for reversing tumor hypoxia and enhancing TNBC treatment.
1. Introduction
Triple negative breast cancer (TNBC), accounting for 15%–20% of breast cancer, exhibits poor prognosis and lacks efficient therapy strategies.1–5 Novel treatment modalities are in high demand. Photodynamic therapy (PDT) and sonodynamic therapy (SDT) have emerged as alternative or adjuvant therapy modalities for malignant tumors, including TNBC, due to the non-invasiveness and minimal side effects.6–10 Based on the administration of a photosensitizer or a sonosensitizer, generally non-toxic when used in appropriate concentrations, PDT or SDT produces toxic singlet oxygen (1O2) in the presence of oxygen to cause cancer cell death under light or ultrasound (US) irradiation.11–15 However, the clinical applications of PDT have been limited primarily because of its shallow penetration depth. In contrast, SDT is capable of penetrating deeply into internal tissues and organs. In this scenario, the combination of SDT and PDT, termed sono-photodynamic therapy (SPDT), shows promising potential to overcome the limitations of single modality treatment.16–25The principle of SPDT is using both sound and light to activate a sono-photosensitizer to cause damage to cancer cells, which augments the anti-tumor performance with fewer side effects since cell death may be induced using less exposure to US or light. Additionally, US, combined with microbubbles, remarkably facilitates cell membrane permeability for cellular uptake of sono-photosensitizers, which is well-known as the US targeted microbubble destruction (UTMD) effect, allowing a lower dosage of sono-photosensitizer.26–32 For example, Ce6, as a second-generation sensitizer, is able to produce toxic 1O2 for anti-cancer treatment under US and laser irradiation. Ce6 does not only work as a sono-photosensitizer, but also serves as a fluorescence (FL) imaging contrast agent for in vivo imaging with high resolution and high sensitivity. However, free Ce6 exhibits difficulty in efficiently accumulating into tumour tissues, thus decreasing the therapeutic efficacy of SPDT. Microbubbles, widely accepted as excellent drug carriers, can address this issue. In this context, Ce6 is loaded and delivered into tumor regions, and subsequently precisely released via UTMD effects when combined with US irradiation.
Furthermore, the hypoxic tumor microenvironment (TME), displaying a low oxygen level, limits the therapeutic outcomes of SPDT.33–37 The consumption of oxygen during SPDT could further aggravate the oxygen deficiency within tumor sites, resulting in unfavourable outcomes. Many approaches have been applied to improve tumor hypoxia by enhancing the SPDT efficacy. For example, Li et al. reported a perfluorocarbon-based “oxygen bomb” PSPP-Au980-D, which could carry and deliver oxygen to tumor sites for enhancing PDT against hypoxic orthotopic pancreatic cancer.38 Other strategies designed TME-responsive nanostructures, making use of the overexpression of acid and H2O2 within tumor sites, to alleviate tumor hypoxia. Sheng and co-workers developed an ultrasmall gold nanozyme that catalyzed the decomposition of H2O2 to O2 within tumor regions to increase TME oxygenation and subsequently enhanced PDT against TNBC.39,40 Similarly, Shuai and colleagues developed a series of MnO2-based nanoplatforms which were responsive to H2O2/H+ in the TME, producing oxygen for modulating hypoxia and sequentially promoting PDT.41 Interestingly, MnO2 transferred into Mn2+, thus serving as a T1-weighted magnetic resonance imaging (MRI) contrast agent for distinguishing tumor tissues and the surrounding normal tissues.
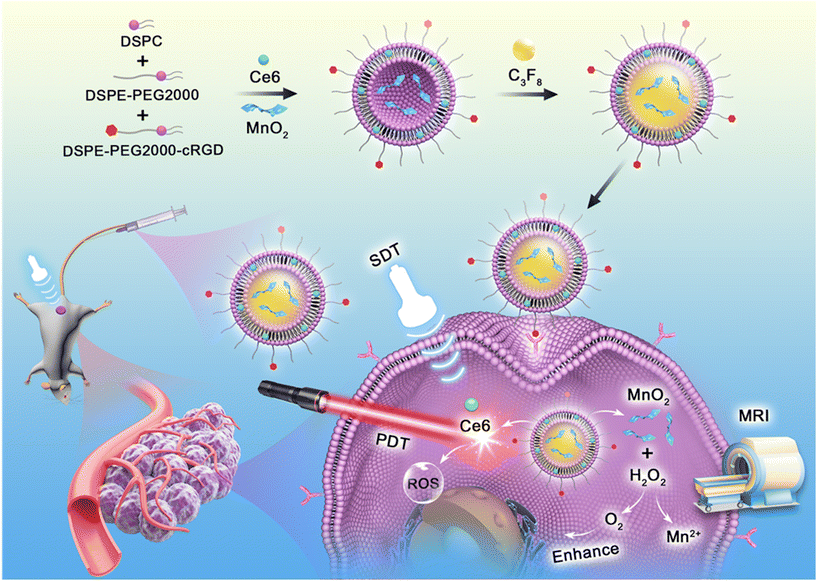
Herein, in this study, we developed a theragnostic strategy for enhanced SPDT against TNBC on the basis of a multifunctional platform (MnO2/Ce6@MBs). As illustrated in Scheme 1, Ce6 and MnO2 were loaded into microbubbles and in situ released into the tumor region by UTMD. The H2O2/pH-responsive MnO2 nanoparticles then modulated tumor hypoxia by generating O2, further enhancing the SPDT efficacy of Ce6. In addition, the as-prepared MnO2/Ce6@MBs, consisting of three crucial imaging contrast agents (Ce6, microbubbles, and Mn2+), allowing FL/US/MR imaging, were able to accurately guide the following therapy procedures. Thus, our proposed TME-responsive and O2 supplying system showed great potential to realize precise and efficient treatment for TNBC.
2. Experimental section
2.1. Materials
DSPC and DSPE-PEG2000 were purchased from Avanti (USA). MnO2 nanosheets and Ce6 were obtained from Xi'an Ruixi Biotechnology Co., Ltd (China). The Singlet Oxygen Sensor Green (SOSG) reagent and Annexin V-IF488/PI assay kit were purchased from Thermo Fisher Scientific (USA). The H2DCFA ROS detection kit was obtained from Invitrogen (USA). The HIF-1α ELISA kit was offered by Shanghai Jianglai Biotechnology Co., Ltd (China).2.2. Preparation of MnO2/Ce6@MBs
We prepared MnO2/Ce6@MBs by the thin film hydration method.42 Briefly, DSPC and DSPE-PEG2000, weighting 3 mg in total, were dissolved in chloroform (125 μL) at a molar ratio of 18![[thin space (1/6-em)]](https://www.rsc.org/images/entities/char_2009.gif) :
:![[thin space (1/6-em)]](https://www.rsc.org/images/entities/char_2009.gif) 1
1![[thin space (1/6-em)]](https://www.rsc.org/images/entities/char_2009.gif) :
:![[thin space (1/6-em)]](https://www.rsc.org/images/entities/char_2009.gif) 1, in which Ce6 was incorporated. The mixture was fully dispersed by using an ultrasonic cleaner for 3 min and subsequently transferred to a sterile glass test tube. Under a fume hood, nitrogen was blown for 1 h until the chloroform in the test tube completely evaporated. After being vacuum pumped for 1 h, the complex was added with MnO2 solution (250 μg mL−1, 1 mL) for ultrasonic hydration, and heated to 60 °C for the lipid phase transition. MnO2/Ce6@Liposomes were obtained and transferred into vials with perfluoropropane to generate MnO2/Ce6 microbubbles (MnO2/Ce6@MBs). The prepared MnO2/Ce6@MBs were stored in the dark at 4 °C.
1, in which Ce6 was incorporated. The mixture was fully dispersed by using an ultrasonic cleaner for 3 min and subsequently transferred to a sterile glass test tube. Under a fume hood, nitrogen was blown for 1 h until the chloroform in the test tube completely evaporated. After being vacuum pumped for 1 h, the complex was added with MnO2 solution (250 μg mL−1, 1 mL) for ultrasonic hydration, and heated to 60 °C for the lipid phase transition. MnO2/Ce6@Liposomes were obtained and transferred into vials with perfluoropropane to generate MnO2/Ce6 microbubbles (MnO2/Ce6@MBs). The prepared MnO2/Ce6@MBs were stored in the dark at 4 °C.
2.3. Characterization of MnO2/Ce6@MBs
The morphology and particle size of MnO2/Ce6@Liposomes were observed using transmission electron microscopy (TEM, JEM-1400plus, Japan). The morphology of MnO2/Ce6@MBs was investigated using an FL microscope (80I, Japan). The particle size distribution and zeta potential of MnO2/Ce6@MBs were measured by dynamic light scattering (DLS) using a zeta-sizer equipment (Malvern Instruments, UK). The ultraviolet absorption spectrum was detected by using an ultraviolet-visible (UV-Vis) spectrometer (UV-1200, Shanghai Mipuda). The concentration of MnO2/Ce6@MBs was detected by using a particle counter (PSS, 780-A 7000APS, USA).2.4. ROS generation of MnO2/Ce6@MBs
A singlet oxygen (1O2) probe (SOSG) was employed to determine the in vitro1O2 generation of MnO2/Ce6@MBs solutions under SPDT treatment. In brief, SOSG agents were added to PBS, MnO2/Ce6@Liposomes, and MnO2/Ce6@MBs solutions (at an equivalent desired concentration of Ce6), respectively. The concentration of Ce6 and MnO2 was 40 μg mL−1 and 20 μg mL−1, respectively. US and laser irradiation were subsequently applied for 1 min. The parameters of the ultrasound and laser irradiation were as follows: 1 MHz, 50% duty cycle, 300 mW cm−2; 660 nm, 150 mW cm−2. Then, an FL spectrometer (FLS920, Edinburgh Instruments) was used to determine the FL intensity of SOSG (excitation/emission = 504 nm/525 nm) every 2 min.For ROS determination at the cellular level, confocal FL microscopy and flow cytometry were employed. There were five groups: (1) control; (2) MnO2/Ce6@MBs; (3) MnO2/Ce6@MBs + SDT; (4) MnO2/Ce6@MBs + PDT; and (5) MnO2/Ce6@MBs + SPDT. For SDT, the conditions were set as: 1 MHz, 50% duty cycle, 300 mW cm−2, 1 min. For PDT, the conditions were set as: 660 nm, 150 mW cm−2, 1 min. For SPDT, the cell received SDT and PDT in sequence. The concentration of Ce6 and MnO2 were 40 μg mL−1 and 20 μg mL−1, respectively. Of note, all US and laser illumination treatments at the cellular level in this study followed the protocol mentioned above.
Murine 4T1 cells (5 × 10⁴ cells per well) were seeded into an 8-well culture dish overnight. The cells received different treatments and then the H2DCFA ROS detection reagents were added. After further incubation for 30 min, the cells were washed 3 times with PBS and observed under a confocal microscope (CLSM; LSM719, Carl Zeiss, Jena, Germany).
Likewise, quantitative analysis was performed by flow cytometry. The 4T1 cells were seeded into a 6-well plate at a density of 2 × 10⁵ per well and incubated overnight. After various treatments, ROS reagents were supplemented, and the cells were then incubated for another 30 min. The cells were collected in Eppendorf tubes after washing with PBS, trypsinization, and centrifugation (3000 rpm, 10 min) for flow cytometry assay. The FL signals of H2DCFA were collected on the FITC channel. Data were analyzed using the FlowJo program.
For ROS determination at the tissue level, 4T1 tumor-bearing mice were randomly divided into five groups: (1) control; (2) MnO2/Ce6@MBs; (3) MnO2/Ce6@MBs + SDT; (4) MnO2/Ce6@MBs + PDT; (5) MnO2/Ce6@MBs + SPDT. For SDT, the conditions were set as: 1 MHz, 50% duty cycle, 300 mW cm−2, 10 min. For PDT, the conditions were set as: 660 nm, 800 mW cm−2, 10 min. For SPDT, the cells received SDT and PDT in sequence. The dosage of MnO2/Ce6@MBs was 200 μL with the Ce6 concentration of 500 μg mL−1 and the MnO2 concentration of 250 μg mL−1. In brief, the mice were intravenously injected with MnO2/Ce6@MBs, followed by the corresponding US and laser treatments. After 24 h, the tumor-bearing mice were intratumorally injected with SOSG reagents (50 μM, 25 μL). Thirty minutes later, iced tumor tissue sections were obtained and observed under an inverted FL microscope.
2.5. In vitro anti-tumor effects
2.6. In vivo imaging
2.7. In vivo anti-tumor effects
4T1 tumor-bearing mice were randomly divided into five groups: (1) control; (2) MnO2/Ce6@MBs; (3) MnO2/Ce6@MBs + SDT; (4) MnO2/Ce6@MBs + PDT; and (5) MnO2/Ce6@MBs + SPDT. The dosage of MnO2/Ce6@MBs was 200 μL with the Ce6 concentration of 500 μg mL−1 and the MnO2 concentration of 250 μg mL−1. The conditions for SDT were set as: 0.8 MHz, 900 mVpp, 1 × 10⁴ cycles, and 10 min. The conditions for PDT were set as: 660 nm, 800 mW cm−2, 10 min. For SPDT, the cell received SDT and PDT in sequence. Mice received different treatments on the 2nd, 4th, 6th, 8th, 10th, and 12th day. Every two days, the tumor volumes and body weights were recorded. On the 14th day post-treatment, the main organs, including the heart, liver, spleen, lungs, and kidneys, and tumor tissues from mice were collected for hematoxylin and eosin (H&E) staining and Ki67 stainingThe liver and kidney function indicators, including alanine aminotransferase (ALT), aspartate aminotransferase (AST), and blood urea nitrogen (BUN), were analyzed. For hypoxia modulation studies, RT-qPCR, western blotting and ELISA were used to evaluate HIF-1α. The specific primers for RT-qPCR experiments were ACAAGTCACCACAGGACAG (HIF-1α-F) and AGGGAGAAAATCAAGTCG (HIF-1α-R).
2.8. Statistical analysis
The data were presented as the mean ± standard deviation. The statistical significance was evaluated by a two-tailed Student's t-test or one-way analysis of variance. p < 0.05 was considered as statistically significant.3. Results and discussion
3.1. Synthesis and characterization of MnO2/Ce6@MBs
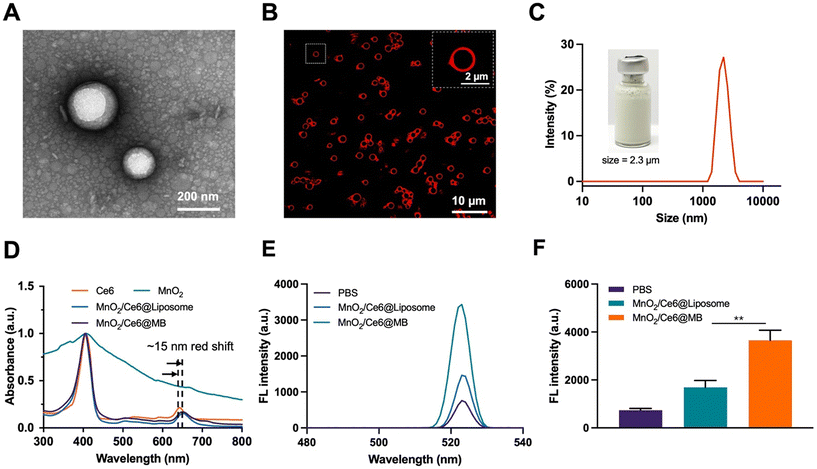
MnO2/Ce6@MBs with suitable particle sizes and uniform dispersion were successfully prepared by the thin film hydration method.42 The TEM image showed that the MnO2/Ce6@Liposomes had spherical structures with an average size of approximately 200 nm (Fig. 1A). The morphology of MnO2/Ce6@MBs observed by FL imaging showed that the MnO2/Ce6@MBs had uniform dispersion, spherical structures, and red rims due to the intrinsic FL signal of Ce6 (Fig. 1B), which enabled MnO2/Ce6@MBs to serve as an FL contrast agent for in vitro and in vivo visualization studies. The mean hydrodynamic size of MnO2/Ce6@MBs was about 2.3 μm with the polydispersity index of 0.12, which was in the range of a typical microbubble size, allowing further biomedical applications. The zeta potential of MnO2/Ce6@MBs was about −31 mV. The encapsulation efficiency and loading content of Ce6 were about 95.30% ± 1.63% and 9.53 wt% ± 0.13 wt%, respectively. Similarly, the encapsulation efficiency and loading content of MnO2 were about 73.8% ± 1.45% and 3.69 wt% ± 0.32 wt%, respectively. The concentration of MnO2/Ce6@MBs was 5 × 10⁸ mL−1 determined by using a particle counter. Additionally, the size and concentration stability of MnO2/Ce6@MBs were investigated. The results showed that MnO2/Ce6@MBs had a stable mean size of about 2 μm and the mean concentration of 3 × 10⁸ within 24 hours (Fig. S1†), which allowed further in vivo imaging and therapy studies of MnO2/Ce6@MBs.The 1O2 generation capability of MnO2/Ce6@MBs was studied using a SOSG agent. PBS, MnO2/Ce6@Liposomes, and MnO2/Ce6@MBs received SPDT treatment and their 1O2 generation were determined. As shown in Fig. 1E and F, the SOSG FL intensity of MnO2/Ce6@Liposomes was lower than that of MnO2/Ce6@MBs, which was due to higher Ce6 release from microbubbles than liposomes by US irradiation. We also found that with MnO2/Ce6@MBs could produce higher 1O2 with multiple irradiation processes. MnO2/Ce6@MBs were exposed to SPDT treatment every two minutes and were tested by using an FL spectra instrument. No obvious SOSG FL intensity changes were observed in PBS solution for 14 min, whereas the SOSG FL intensity rapidly increased in MnO2/Ce6@Liposomes and MnO2/Ce6@MBs solutions within 4 min. Then, gradual decreases occurred after 4 min (Fig. S2†). These results suggested that multiple doses of MnO2/Ce6@MBs + SPDT might present an improved anti-tumor efficacy.
3.2. In vitro anti-tumor effects
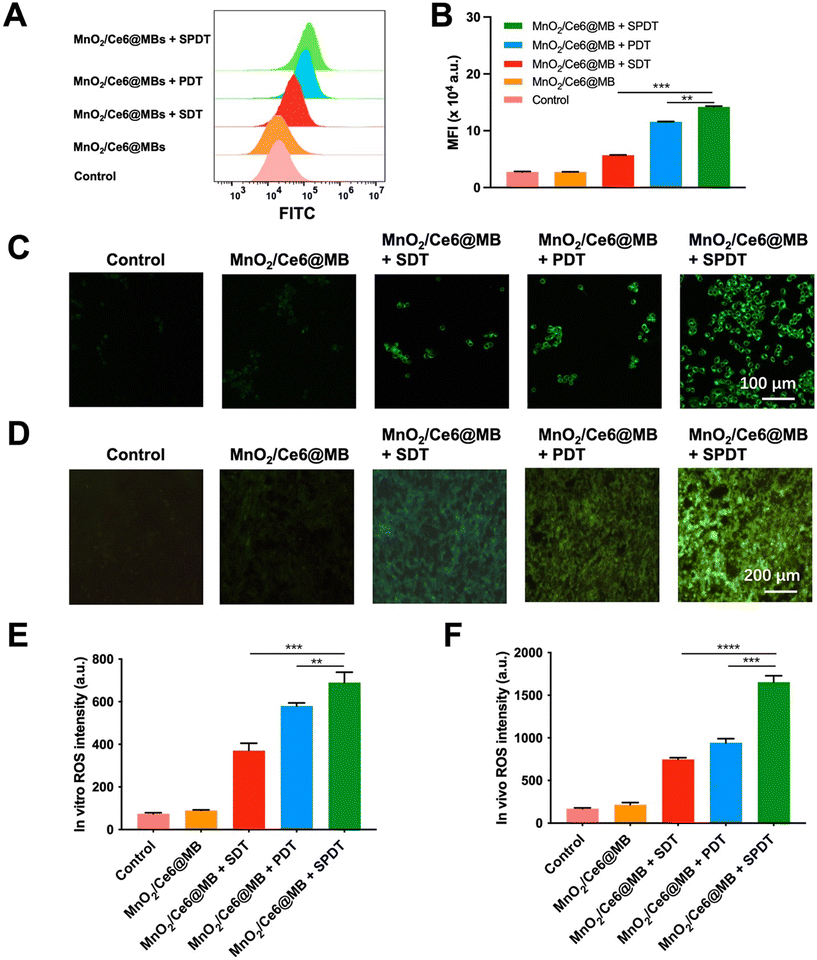
We firstly evaluated the ROS generation ability of MnO2/Ce6@MBs at the cellular level. Murine TNBC 4T1 cells were divided into five groups: (1) control; (2) MnO2/Ce6@MBs; (3) MnO2/Ce6@MBs + SDT; (4) MnO2/Ce6@MBs + PDT; (5) MnO2/Ce6@MBs + SPDT.A H2DCFDA ROS detection assay kit was applied for flow cytometry analysis. It showed that the control group and MnO2/Ce6@MBs group exhibited a very weak ROS FL intensity, which was the physical ROS level in tumor cells. The 4T1 cells treated with MnO2/Ce6@MBs + SDT, MnO2/Ce6@MBs + PDT, and MnO2/Ce6@MBs + SPDT displayed increasing ROS levels, with that of MnO2/Ce6@MBs + SPDT significantly higher than those of MnO2/Ce6@MB + SDT and MnO2/Ce6@MB + PDT (Fig. 2A and B).
Visualization of ROS generation in 4T1 cells and 4T1-tumor tissues were achieved by FL imaging. As shown in Fig. 2C–F, MnO2/Ce6@MBs + SPDT exhibited most ROS generation compared with that produced by solely SDT or PDT, suggesting that the combination of SDT and PDT was beneficial for enhancing ROS generation and further improving cell killing effects.
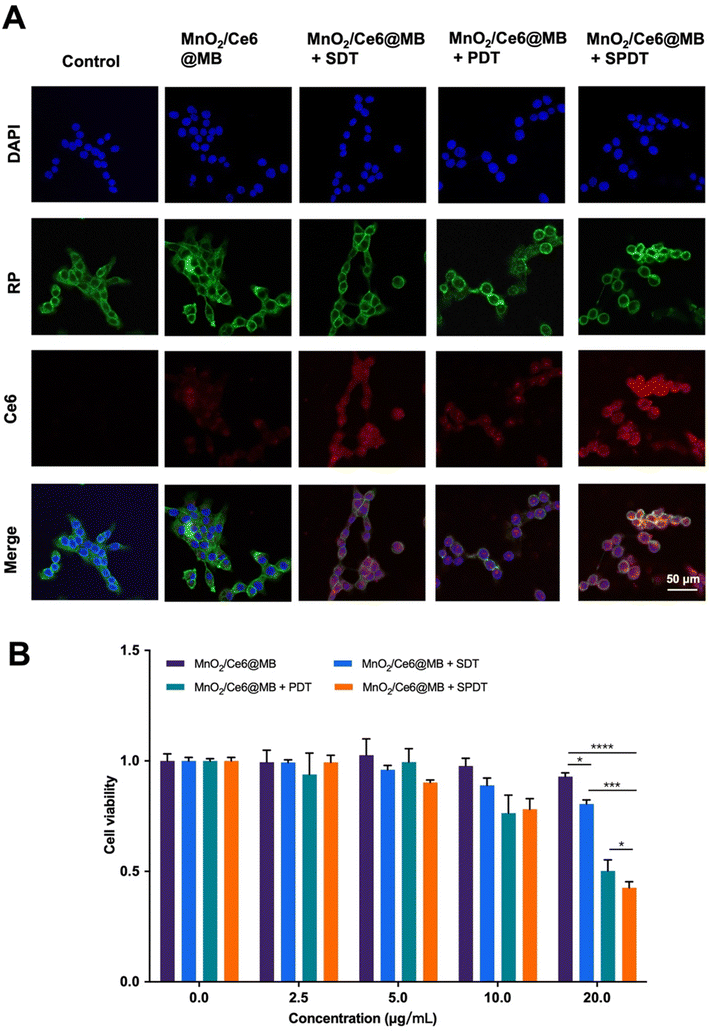
We subsequently investigated colocalization and cell uptake of MnO2/Ce6@MBs making use of the intrinsic red FL of Ce6. Using a multiple staining assay, including the cell nucleus and cytoskeletons, we found that Ce6 was localized in the cell nucleus. Post various treatments, the 4T1 cells were observed under a confocal microscope. No FL signals of Ce6 were found in the control group, while there were weak Ce6 FL signals in the cells incubated with MnO2/Ce6@MBs. The Ce6 FL signals increased in MnO2/Ce6@MBs + PDT, which might be caused by the mild thermal effect from laser irradiation. More interestingly, MnO2/Ce6@MBs + SDT significantly enhanced the cell uptake of MnO2/Ce6@MBs (Fig. 3A and Fig. S3†). This is due to the UTMD effect that promotes the release of Ce6 from MnO2/Ce6@MBs as well as 4T1 cell membrane permeation. Eventually, combining US and laser irradiation, 4T1 cells exhibited strongest FL signals of Ce6, which demonstrated the optimal cell uptake of MnO2/Ce6@MBs, allowing further anti-tumor investigations.
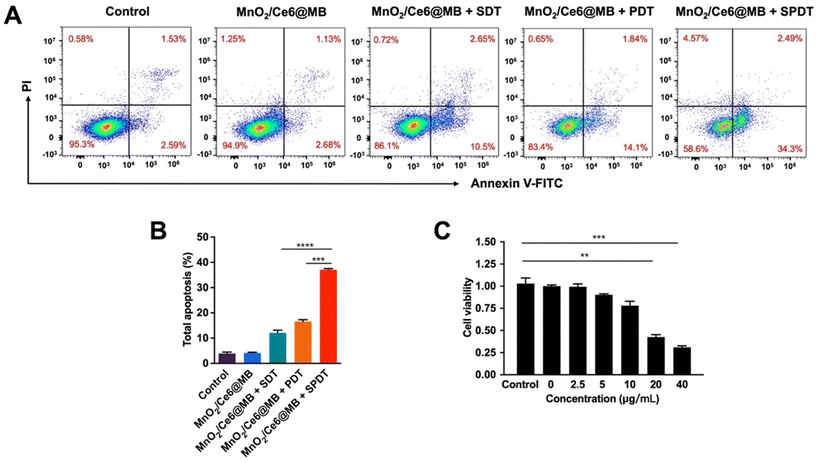
Based on the synergistic effect of SPDT to produce toxic ROS, we verified the cancer cell killing capability of MnO2/Ce6@MBs + SPDT. We firstly identified the optimal concentration of MnO2/Ce6@MBs used for in vitro studies. Different concentrations of MnO2/Ce6@MBs (Ce6 concentration: 0 μg mL−1, 2.5 μg mL−1, 5 μg mL−1, 10 μg mL−1, 20 μg mL−1) were incubated with 4T1 cells. Cell viability was determined after SDT, PDT, and SPDT were applied on 4T1 cells, respectively. It showed that MnO2/Ce6@MBs were biocompatible when 4T1 cells treated with MnO2/Ce6@MBs of concentration below 20 μg mL−1. However, MnO2/Ce6@MBs (>20 μg mL−1) combined with SDT exhibited slightly cytotoxicity. MnO2/Ce6@MBs (20 μg mL−1) + PDT caused about 50% cell death. In contrast, SPDT augmented a cell killing effect compared to SDT or PDT, with cell viability decreasing to about 40% (Fig. 3B). When the Ce6 concentration climbed up to above 20 μg mL−1, it showed negligible cytotoxicity towards 4T1 cells. Hence, the concentration of Ce6 (20 μg mL−1) was chosen for in vitro anti-tumor effect studies. Of note, at the cellular level, penetration depth was not a limitation for PDT, thus the assistance with SDT did not play a great role in enhancing PDT.
Flow cytometry was additionally used to analyze the apoptosis of 4T1 cells induced by MnO2/Ce6@MBs combined with SPDT. After incubation with MnO2/Ce6@MBs (20 μg mL−1) and then treatment with SDT, PDT, or SPDT, the total apoptosis, including early and late apoptosis, was analysed. In Fig. 4A and B, MnO2/Ce6@MBs + SPDT presented the apoptosis rate of above 35% compared to MnO2/Ce6@MBs + SDT (13%) and MnO2/Ce6@MBs + PDT (16%). We also found the MnO2/Ce6@MB-mediated SPDT damage cells in a concentration-dependent manner (Fig. 4B), which suggested that with more Ce6 taken up by 4T1 cells and accumulating within tumor tissues, the anti-tumor ability would improve. The outcomes supported our hypothesis that with the assistance of SDT, mainly due to the UTMD effect, the cancer cell killing capability of PDT got significantly enhanced by improving targeted drug release, cell membrane permeation, and cell uptake. It showed that the synergistic therapy strategy would provide satisfactory outcomes in further in vivo studies.
3.3. Multimodal imaging in vivo
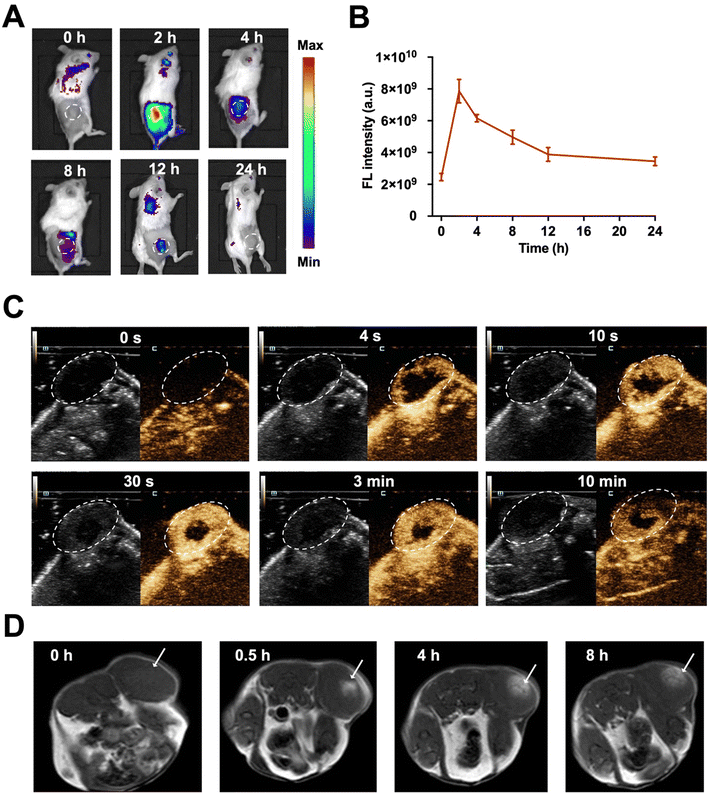
The key elements, Ce6, microbubbles, and Mn2+, in MnO2/Ce6@MBs, were supposed to enhance multimodal imaging. Ce6 is an FL imaging contrast agent and microbubbles were usually applied for contrast-enhanced US (CEUS) imaging. In addition, in the tumor microenvironment, the acid (H+) reacts with MnO2 to produce Mn2+ for enhanced MRI imaging. Herein, we first evaluated the in vivo multimodal imaging performance of MnO2/Ce6@MBs with FL imaging, US imaging, and MRI.The tumor accumulation and metabolism of MnO2/Ce6@MBs were visualized using a small animal in vivo FL imaging system. Fig. 5A shows that after the intravenous injection of MnO2/Ce6@MBs into TNBC tumor-bearing mice, FL images of the whole mouse body were obtained at 0, 2, 4, 8, 12, and 24 h. Obviously, MnO2/Ce6@MBs reached within tumor sites at 2 h, with the peak tumor accumulation about 4-fold higher compared to that at 0 h. The FL intensity signals of MnO2/Ce6@MBs within tumor tissues then gradually decreased starting from 4 h post injection of MnO2/Ce6@MBs. It also demonstrated that MnO2/Ce6@MBs were mainly metabolized via the lungs with the peak accumulation at 12 h, which is the typical metabolic pathway of microbubbles (Fig. 5B). At 24 h after injection, the FL signals of MnO2/Ce6@MBs nearly went down back to the background signal, indicating that within 24 h, the MnO2/Ce6@MBs were cleared out from the bodies.
We further examined the US imaging capability of MnO2/Ce6@MBs on both brightness mode (B mode) and CEUS mode. As expected, CEUS was remarkably superior to the B mode for US perfusion imaging. In the 4th second after the intravenous injection of MnO2/Ce6@MBs, the contour of tumor was distinctly visualized in the CEUS mode. The enhancement intensity reached the peak value in the 30th second and then gradually decreased starting from the 3rd min. The tumor was clearly imaged until the 10th min (Fig. 5C). The results exhibited the desirable retention and imaging-enhancing abilities of MnO2/Ce6@MBs, showing its potential for serving as a novel CEUS agent.
Since the tumor microenvironment is mildly acidic, primarily attributed to hypoxia and increased lactate levels in cancer cells, it offered a physical “reaction chamber” for the degradation of MnO2. MnO2 interacted with H2O2 and H+ within the tumor, decomposing into Mn2+, which presented high T1 relaxivity in MRI. As shown in Fig. 5D, at 0.5 h post administration of MnO2/Ce6@MBs, the T1 MRI signals of the tumor were strengthened, significantly distinct from muscle tissues. At 4 h post-injection, the tumor region showed a climax on the MRI signal, which was evidently higher than that in the pre-injection tumor. At 8 h post-injection, the tumor signal in T1 MRI decreased, similar to that at 0.5 h, showing that Mn2+ was gradually removed out via blood circulation. Thus, MnO2/Ce6@MBs being H2O2-/pH-degradable had great potential for enhancing cancer MRI imaging, supplementary to FL imaging and CEUS imaging.
3.4. Anti-tumor effect in vivo
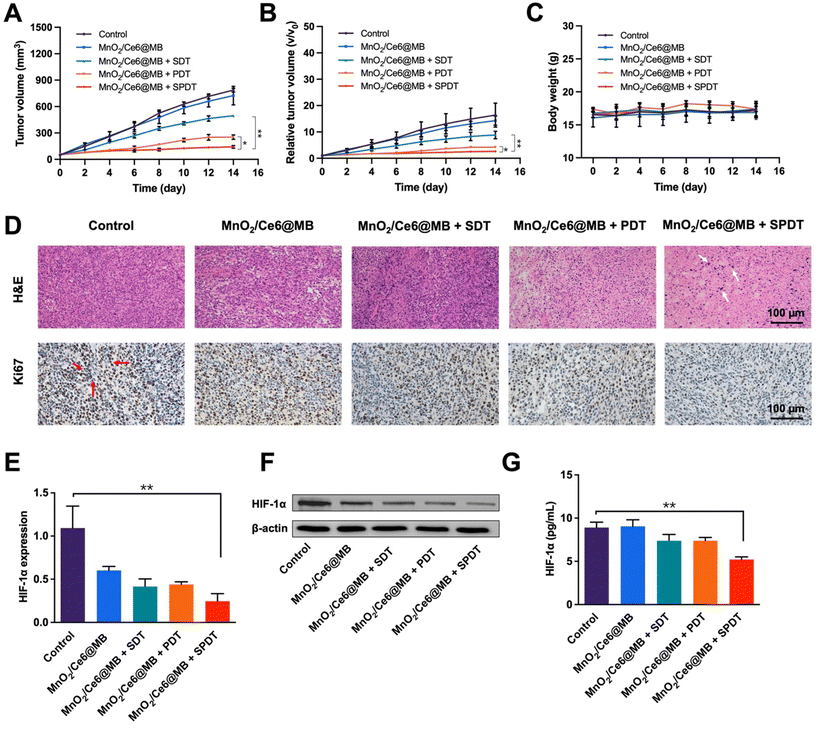
Inspired by the remarkable tumor accumulation and ROS generation capability of MnO2/Ce6@MBs, we conducted tumor growth inhibition studies to evaluate the in vivo anti-cancer performance of MnO2/Ce6@MBs. Tumor-bearing mice were randomly divided into five groups (n = 6): (1) control; (2) MnO2/Ce6@MBs; (3) MnO2/Ce6@MBs + SDT; (4) MnO2/Ce6@MBs + PDT; (5) MnO2/Ce6@MBs + SPDT.The mice were injected with PBS in the control group and MnO2/Ce6@MBs in the other four groups, followed by SDT, PDT, and SPDT. Tumor sizes and body weights were recorded every two days. The tumors of the control group and MnO2/Ce6@MBs group grew rapidly as expected. In contrast, the tumor sizes were suppressed in the mice that received MnO2/Ce6@MBs combined with SDT, PDT, and SPDT. MnO2/Ce6@MBs + SPDT presented the most satisfactory therapeutic outcomes among all treatments (Fig. 6A). On the 14th day of the treatments, the mean tumor volume was about 140 mm3 in the MnO2/Ce6@MBs + SPDT group compared to that in the control group (about 780 mm3). In tumor size change analysis, we found that the tumors increased by about 2.68-, 4.21-, 8.84-, 14.31-, and 16.39-fold, respectively, in the corresponding groups on the 14th day compared to those in the pre-treated mice (Fig. 6B).
During the period of treatments, the body weights of the mice were recorded. No apparent body loss was observed in all mice. Additionally, the H&E staining of the main organs, including the heart, liver, spleen, lungs and kidneys, showed no apparent histological changes in all mice after 14 days (Fig. S4†). Furthermore, the AST, ALT and BUN as liver and renal function indicators were also examined, without abnormal changes after various treatments (Fig. S5†).
The mechanism of the cancer killing effect was analyzed by multiple methods. Histological studies of tumor tissues demonstrated that there was obvious cell damage in H&E staining, such as cell apoptosis and necrosis, in the MnO2/Ce6@MBs + SPDT group, while the Ki67 index was much lower in the MnO2/Ce6@MBs + SPDT group compared to the other four groups, indicating less cancer cell proliferation (Fig. 6D). Hypoxia modulation was further investigated at genetic and protein levels. HIF-1α is an important indicator for assessing tissue hypoxia. The expression of the HIF-1α gene was determined by the RT-qPCR method. It was found that after the MnO2/Ce6@MBs + SPDT treatment, the HIF-1α expression reversed markedly compared to the control group. Notably, the MnO2/Ce6@MBs itself could also improve tumor hypoxia to some extent (Fig. 6E). The protein levels of HIF-1α were further evaluated by western blotting and ELISA. Accordingly, the HIF-1α protein significantly decreased in the MnO2/Ce6@MBs + SPDT group (Fig. 6F and G and Fig. S6†). These results demonstrated that the prepared MnO2/Ce6@MBs were able to generate sufficient toxic 1O2 under SPDT treatment to cause cancer cell death via hypoxia environment regulation.
4. Conclusions
In summary, we successfully developed a multifunctional theragnostic platform for enhancing precise TNBC treatment. The as-prepared MnO2/Ce6@MBs, consisting of three crucial imaging contrast agents (Mn2+, Ce6, and microbubbles), showed high-performance imaging function for FL/MR/US imaging and were able to guide the following therapy procedures. Microbubbles combined with US, as drug “missiles”, precisely delivered the sono-photosensitizer (Ce6) to the tumor “nests” for efficient treatment. Additionally, the MnO2 nanoparticles were tumor microenvironment (H2O2/pH)-responsive, modulating tumor hypoxia to enhance SPDT. This study provides a promising platform for the imaging and therapy of TNBC.Ethical statement
All procedures were approved by the Animal Use and Care Committee of Shenzhen Peking University-The Hong Kong University of Science and Technology Medical Center (SPHMC) with the NIH Guidelines for the Care and Use of Laboratory Animals and Public Health Policy (protocol number 2020-032).Author contributions
Manuscript drafting, data curation, investigation, and visualization: Ping Li, Xiao Tan, and Qing Dan; methodology, validation, and project administration: Azhen Hu and Zhengming Hu; in vitro experiments: Azhen Hu, Xiaoting Yang and Jianhua Bai; in vivo imaging experiments: Xiaoyu Chen, Bowei Li, and Guanxun Cheng; in vivo anti-cancer experiments: Ping Li, Xiao Tan, and Qing Dan; study design and conceptualization: Tingting Zheng and Xintao Shuai; resources and funding acquisition: Li Liu, Yun Chen, Zhengming Hu and Tingting Zheng; supervision and manuscript editing: Desheng Sun and Zhengming Hu. All authors have approved the manuscript and agree with its submission to Biomaterials Science.Conflicts of interest
The authors have no conflicts to declare.Acknowledgements
This work was supported by the Natural Science Foundation of Guangdong Province (2022A1515010296, 2022A1515010986), the Science and Technology Project of Shenzhen (JCYJ20200109140212277, JCYJ20210324110211031, JCYJ20210324131402008, KXCFZ202002011010487), the Shenzhen Key Medical Discipline Construction Fund (SZXK051), and the Sanming Project of Medicine in Shenzhen (SZSM202111011). We appreciate all the work Yulin Ye, Die Hu, and Xiaoxin He have done to help us conduct the animal experiments.References
- H. Sung, J. Ferlay, R. L. Siegel, M. Laversanne, I. Soerjomataram, A. Jemal and F. Bray, Ca-Cancer J. Clin., 2021, 71, 209–249 CrossRef PubMed.
- P. Zagami and L. A. Carey, npj Breast Cancerr, 2022, 8, 95 CrossRef CAS PubMed.
- K.-S. Parham, C.-G. L. Luis and A. S. Maria Inmaculada, Breast J., 2019 DOI:10.1111/tbj.13369.
- A.-M. S. Sumayah, S. J. Justin, G. Olga B and M. T. Tamara, Drug Delivery Transl. Res., 2018 DOI:10.1007/s13346-018-0551-3.
- S. Ma, Y. Zhao, W. C. Lee, L.-T. Ong, P. L. Lee, Z. Jiang, G. Oguz, Z. Niu, M. Liu, J. Y. Goh, W. Wang, M. A. Bustos, S. Ehmsen, A. Ramasamy, D. S. B. Hoon, H. J. Ditzel, E. Y. Tan, Q. Chen and Q. Yu, Nat. Commun., 2022, 13, 4118 CrossRef CAS PubMed.
- Z. Zeng, C. Zhang, J. Li, D. Cui, Y. Jiang and K. Pu, Adv. Mater., 2021, 33, e2007247 CrossRef PubMed.
- M. Yang, T. Yang and C. Mao, Angew. Chem., Int. Ed., 2019, 58, 14066–14080 CrossRef CAS PubMed.
- M. Wysocki, B. Czarczynska-Goslinska, D. Ziental, M. Michalak, E. Güzel and L. Sobotta, ChemMedChem, 2022, 17, e202200185 CrossRef CAS PubMed.
- S. Son, J. H. Kim, X. Wang, C. Zhang, S. A. Yoon, J. Shin, A. Sharma, M. H. Lee, L. Cheng, J. Wu and J. S. Kim, Chem. Soc. Rev., 2020, 49, 3244–3261 RSC.
- Um Wooram, E. K. Pramod Kumar, L. Jeongjin, K. Chan Ho, Y. Dong Gil and P. Jae Hyung, Chem. Commun., 2021, 57, 2854–2866, 10.1039/d0cc07750j.
- A. P. McHale, J. F. Callan, N. Nomikou, C. Fowley and B. Callan, Adv. Exp. Med. Biol., 2016, 880, 429–450 CrossRef CAS PubMed.
- M. Xu, L. Zhou, L. Zheng, Q. Zhou, K. Liu, Y. Mao and S. Song, Cancer Lett., 2021, 497, 229–242 CrossRef CAS PubMed.
- P. Sarbadhikary, B. P. George and H. Abrahamse, Theranostics, 2021, 11, 9054–9088 CrossRef CAS PubMed.
- J. H. Correia, J. A. Rodrigues, S. Pimenta, T. Dong and Z. Yang, Pharmaceutics, 2021, 13, 1332 CrossRef CAS PubMed.
- Z. Gong and Z. Dai, Adv. Sci., 2021, 8, 2002178 CrossRef CAS PubMed.
- P. Wang, C. Li, X. Wang, W. Xiong, X. Feng, Q. Liu, A. W. Leung and C. Xu, Ultrason. Sonochem., 2015, 23, 116–127 CrossRef CAS PubMed.
- D. Sun, Z. Zhang, M. Chen, Y. Zhang, J. Amagat, S. Kang, Y. Zheng, B. Hu and M. Chen, ACS Appl. Mater. Interfaces, 2020, 12, 40728–40739 CrossRef CAS PubMed.
- H. Wang, J. Shang, F. Yang, S. Zhang, J. Cui, X. Hou, Y. Li, W. Liu, X. Shu, Y. Liu and B. Sun, Photodiagn. Photodyn. Ther., 2023, 42, 103642 CrossRef CAS PubMed.
- Y. Yang, J. Tu, D. Yang, J. L. Raymond, R. A. Roy and D. Zhang, Curr. Pharm. Des., 2019, 25, 401–412 CrossRef CAS PubMed.
- Y. Zheng, J. Ye, Z. Li, H. Chen and Y. Gao, Acta Pharm. Sin. B, 2021, 11, 2197–2219 CrossRef CAS PubMed.
- L. Liu, J. Zhang, R. An, Q. Xue, X. Cheng, Y. Hu, Z. Huang, L. Wu, W. Zeng, Y. Miao, J. Li, Y. Zhou, H.-Y. Chen, H. Liu and D. Ye, Angew. Chem., Int. Ed., 2023, 62, e202217055 CrossRef CAS PubMed.
- K. C. Sadanala, P. K. Chaturvedi, Y. M. Seo, J. M. Kim, Y. S. Jo, Y. K. Lee and W. S. Ahn, Anticancer Res., 2014, 34, 4657–4664 CAS.
- X. Wang, W. Zhang, Z. Xu, Y. Luo, D. Mitchell and R. W. Moss, Integr. Cancer Ther., 2009, 8, 283–287 CrossRef PubMed.
- B. M. Borah, J. Cacaccio, F. A. Durrani, W. Bshara, S. G. Turowski, J. A. Spernyak and R. K. Pandey, Sci. Rep., 2020, 10, 21791 CrossRef CAS PubMed.
- Q. Li, Q. Liu, P. Wang, X. Feng, H. Wang and X. Wang, Ultrasonics, 2014, 54, 981–989 CrossRef CAS PubMed.
- Y. Wu, T. Sun, J. Tang, Y. Liu and F. Li, Ultrasound Med. Biol., 2020, 46(3) DOI:10.1016/j.ultrasmedbio.2019.09.017.
- T. Benjamin, B. Maike, O. Tarun, M. Diana, V. Seena Koyadan, S. Julia, B. Louis, S. Gert, K. Fabian and L. Twan, J. Controlled Release, 2016, 23, 77–85 Search PubMed.
- Y. Tian, Z. Liu, H. Tan, J. Hou, X. Wen, F. Yang and W. Cheng, Int. J. Nanomed., 2020, 1178–2013 Search PubMed.
- G. Fan, J. Qin, X. Fu, X. Si, L. Li, K. Yang, B. Wang, H. Lou and J. Zhu, Front. Oncol., 2022, 12 DOI:10.3389/fonc.2022.823956.
- C. B. Walton, C. D. Anderson, R. Boulay and R. V. Shohet, J. Visualized Exp., 2011, 52, 2963 Search PubMed.
- I. Lentacker, I. De Cock, R. Deckers, S. De Smedt and M. Moonen, Adv. Drug Delivery Rev., 2014, 72, 49–64 CrossRef CAS PubMed.
- J. Deprez, G. Lajoinie, Y. Engelen, S. De Smedt and I. Lentacker, Adv. Drug Delivery Rev., 2021, 172, 9–36 CrossRef CAS PubMed.
- K. Graham and E. Unger, Indian J. Nephrol., 2018, 13, 6049–6058 CAS.
- X. Jing, F. Yang, C. Shao, K. Wei, M. Xie, H. Shen and Y. Shu, Mol. Cancer, 2019, 18, 157 CrossRef PubMed.
- W. R. Wilson and M. P. Hay, Nat. Rev. Cancer, 2011, 11, 393–410 CrossRef CAS PubMed.
- P. Vaupel, Oncologist, 2004, 9, 10–17 CrossRef CAS PubMed.
- M. Hockel and P. Vaupel, JNCI, J. Natl. Cancer Inst., 2001, 93, 266–276 CrossRef CAS PubMed.
- S. Zhang, Z. Li and Q. Wang, Adv. Mater., 2022, 34(29), e2201978 CrossRef PubMed.
- Q. Dan, D. Hu, Y. Ge, S. Zhang, S. Li, D. Gao, W. Luo, T. Ma, X. Liu, H. Zheng, Y. Li and Z. Sheng, Biomater. Sci., 2020, 8, 973–987 RSC.
- Q. Dan, Z. Yuan, S. Zheng, H. Ma, W. Luo, L. Zhang, N. Su, D. Hu, Z. Sheng and Y. Li, Pharmaceutics, 2022, 14, 1645 CrossRef CAS PubMed.
- M. Yu, X. Duan, Y. Cai, F. Zhang, S. Jiang, S. Han, J. Shen and X. Shuai, Adv. Sci., 2019, 6, 1900037 CrossRef PubMed.
- V. Daeichin, T. van Rooij, I. Skachkov, B. Ergin, P. A. C. Specht, A. Lima, C. Ince, J. G. Bosch, A. F. W. van der Steen, N. de Jong and K. Kooiman, IEEE Trans. Ultrason. Ferroelectr. Freq. Control, 2017, 64, 555–567 Search PubMed.
Footnotes |
| † Electronic supplementary information (ESI) available: Fig. S1–S6. See DOI: https://doi.org/10.1039/d3bm00931a |
| ‡ These authors contributed equally to this work. |
| This journal is © The Royal Society of Chemistry 2024 |

