 Open Access Article
Creative Commons Attribution 3.0 Unported Licence
Correction: Virtual screening, identification and in vitro validation of small molecule GDP-mannose dehydrogenase inhibitors
Jonathan P.
Dolan
ab,
Sanaz
Ahmadipour
e,
Alice J. C.
Wahart
ab,
Aisling Ní
Cheallaigh
ab,
Suat
Sari
f,
Chatchakorn
Eurtivong
g,
Marcelo A.
Lima
bd,
Mark A.
Skidmore
bd,
Konstantin P.
Volcho
h,
Jóhannes
Reynisson
bc,
Robert A.
Field
e and
Gavin J.
Miller
*ab
aLennard-Jones Laboratory, School of Chemical & Physical Sciences, Keele University, Keele, Staffordshire, ST5 5BG, UK. E-mail: g.j.miller@keele.ac.uk
bCentre for Glycoscience, Keele University, Keele, Staffordshire, ST5 5BG, UK
cHornbeam Building, School of Pharmacy & Bioengineering, Keele University, Keele, Staffordshire, ST5 5BG, UK
dSchool of Life Sciences, Keele University, Keele, Staffordshire, ST5 5BG, UK
eDepartment of Chemistry & Manchester Institute of Biotechnology, The University of Manchester, 131 Princess Street, Manchester, M1 7DN, UK
fHacettepe University, Faculty of Pharmacy, Department of Pharmaceutical Chemistry, 06100, Ankara, Turkey
gDepartment of Pharmaceutical Chemistry, Faculty of Pharmacy, Mahidol University, 447 Si Ayutthaya Road, Ratchathewi, Bangkok 10400, Thailand
hN. Vorozhtsov Novosibirsk Institute of Organic Chemistry, Siberian Branch of the Russian Academy of Sciences, 630090 Novosibirsk, Russia
First published on 8th July 2024
Abstract
Correction for ‘Virtual screening, identification and in vitro validation of small molecule GDP-mannose dehydrogenase inhibitors’ by Jonathan P. Dolan et al., RSC Chem. Biol., 2023, 4, 865–870, https://doi.org/10.1039/D3CB00126A.
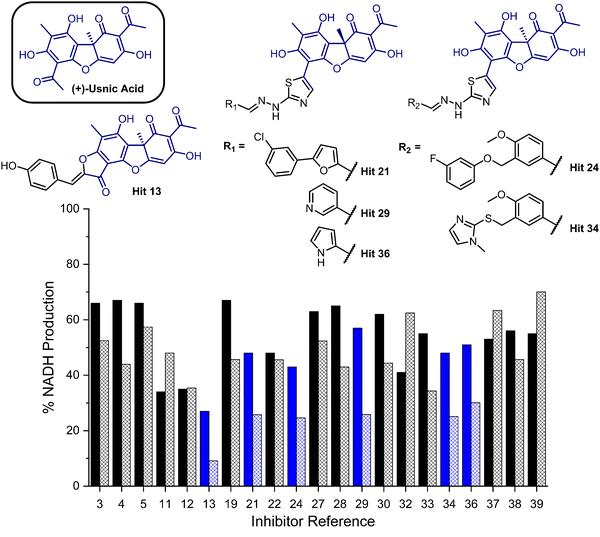
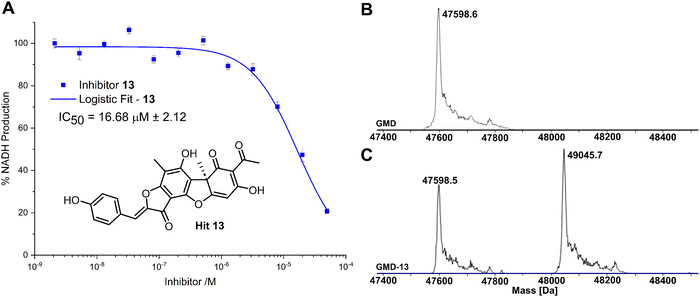
The authors regret an error in the published article whereby the stereochemistry of one carbon within compound 13 in Fig. 2 and 3 was incorrect. All other designations of compound 13 in the article and supplementary information were correct. The corrected article figures are below.
The Royal Society of Chemistry apologises for these errors and any consequent inconvenience to authors and readers.
| This journal is © The Royal Society of Chemistry 2024 |


