Observing atomically precise nanocluster aggregates in solution by mass photometry†‡
Jayoti
Roy
a,
Ila
Marathe
b,
Vicki
Wysocki
b and
Thalappil
Pradeep
 *ac
*ac
aDST Unit of Nanoscience (DST UNS) & Thematic Unit of Excellence (TUE), Department of Chemistry, Indian Institute of Technology Madras (IITM), Chennai 600036, India. E-mail: pradeep@iitm.ac.in
bDepartment of Chemistry and Biochemistry and Native Mass Spectrometry Guided Structural Biology Center, The Ohio State University, Columbus, Ohio 43210, USA
cInternational Centre for Clean Water, 2nd Floor, B-Block, IIT Madras Research Park, Kanagam Road, Taramani, Chennai 600113, India
First published on 16th May 2024
Abstract
We report the first mass photometric characterization of nanoaggregates of atomically precise nanoclusters (NCs) in solution. The differently-sized nanoaggregates of silver–gold alloy NCs, [Ag11−xAux(DPPB)5Cl5O2]2+ [x = 1–5 and DPPB = 1,4-bis(diphenylphosphino)butane], formed in solution, were examined by mass photometry (MP) with a protein calibration. In addition, we conducted MP studies of varying solvent composition to understand the structural evolution of nanoaggregates. The masses of nanoaggregates were correlated to structures of 15 to 50 nm diameter observed in cryo-electron microscopy.
Atomically precise metal nanoclusters (NCs) belong to an emerging family of materials with potential applications in areas such as energy, environment, and biology.1–3 These NCs, resembling macromolecules, are typically characterized by high-resolution mass spectrometry (MS), single-crystal X-ray diffraction, and other spectroscopic studies.4–6 They undergo structural changes and interact with various molecular entities or with each other in solution.7 In such processes, under specific conditions, they form aggregates that are observable by dynamic light scattering (DLS) and related in situ spectroscopic/microscopic techniques.8–10 Aggregation of NCs is central to building NC-based multi-dimensional materials.8,11 Exploring such assemblies of NCs is an emerging area of interest in nanotechnology due to its relevance in deriving tuneable collective properties as well as for exploring novel applications in a wide range of fields.12–15 Determining accurate number of building units in superstructures in the multi-dimensional closed-packed molecular aggregates of NCs is a grand challenge, particularly in solution. However, metal NCs themselves can exhibit a wide range of arrangements, from monomeric species to large multimeric complexes. Consequently, the presence of heterogeneity in complex systems poses a significant challenge for accurately determining the number of building units, especially when ligand-protected NCs form superstructures such as chains, helices, spheres, capsids, and prisms.16 At the same time, it is a challenge to construct nanoassemblies of precise morphology due to the lack of control of kinetics and assembly dynamics.
Over the years, several techniques have been applied to characterize NC-based multidimensional assemblies and investigate their potential applications in the solid state.17 Among these techniques, electron microscopy and X-ray scattering have been most relevant to understand their structural integrity.18 Unfortunately, these techniques have inherent limitations, primarily in determining the number of monomeric units responsible for the formation of such structures. The most efficient way to assess composition of these NC-aggregates is to investigate their masses.19 The traditional mass analysis technique, mass spectrometry, has focused on measuring ensembles of hundreds or thousands of atoms/molecules in the gas phase by imparting multiple charges on them.20 These methods have been successful in analysing biomolecules, NCs, and NC-based supramolecular-oligomeric small complexes.21,22 However, mass spectrometry cannot examine the NC-assembled species directly in solution and consequently their structural evolution.
Here we report the first investigation of the structural evolution of such nanoaggregates in solution using interferometric scattering microscopy (iSCAT), later renamed as mass photometry (MP).23 MP is an emerging optical technique with a high dynamic mass range, needing only nanomolar concentrations of analyte, and has been used generally for examining biomolecules such as proteins.23 Earlier, the iSCAT technique has been employed in materials science to accurately infer the size-distribution of nanoparticles of various sizes without probing their masses.24–26 Grant et al. employed this method to determine size distributions of gold nanoparticles and compared the results with those obtained from transmission electron microscopy (TEM).25 The iSCAT technique can be demonstrated to have superior accuracy in measuring the particle size distribution of nanoparticles compared to DLS. However, the use of MP for nanoparticle mass determination has remained unexplored. Individual proteins, protein complexes, and their aggregates in the 30 kDa–5 MDa mass range have been examined by this technique, giving new insights into their structural and functional properties; namely, polymerization, host–guest interactions, and self-assembly.23,27 These nano-sized nanoparticles are comparable in size to that of many biomolecules such as proteins, antibodies and nucleic acids.28 Thus, MP can be used to study solution-phase aggregation dynamics of NCs, similar to its use in biomolecular interactions. With this objective, we used MP to examine a particular NC system that is known to form precise nanoaggregates in solution.8
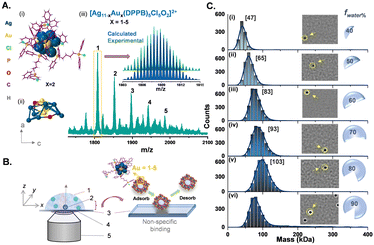
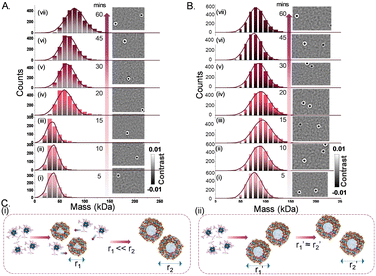
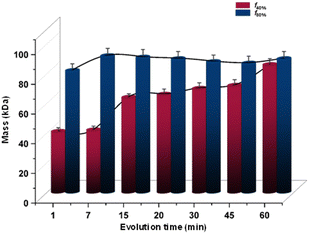
We used a new series of Ag–Au alloy nanoclusters denoted as [Ag11−xAux(DPPB)5Cl5O2]2+ [x = 1–5]. They are co-protected by 1,4-bis(diphenylphosphino)butane (DPPB) and chloride ligands and exhibit useful photophysical properties.8 The unique solvophobic property of this Ag–Au alloy NC leads to the formation of luminescent solution phase self-assemblies. Size-dependent luminescence characteristics of these aggregates and their potential applications have been explored previously.8 In this report, we investigated these alloy NCs and their precisely formed nanostructures, by varying the compositions of the solvent system (methanol:water). This investigation was conducted using a Refeyn TwoMP mass photometer (Refeyn Ltd), complemented by cryogenic electron microscopy (cryo-EM).29 Details of the experimental protocol are discussed in the ESI.‡ To examine the suitability of MP for studying the solution phase self-assembly of atomically precise NCs, we used an equimolar mixture of β-amylase and thyroglobulin with a broad mass range of 50–660 kDa as a standard, in 30% (v/v) methanol solution. A calibration graph (r2 = 0.9999) was obtained from the measurements and the error was estimated to be ±5%. Details of the calibration method are described in ESI.‡ The stability of protein calibrants in 30% (v/v) methanol was confirmed by comparing the same in ammonium acetate (AmAc) solution by MP measurements (see histograms in ESI‡). In Fig. 1, we show the electrospray ionization mass spectrometric (ESI MS) characterization of the parent NC system used in this study. The peaks marked with 1–5 correspond to different NCs with varying number of gold atoms, i.e., [Ag10Au(DPPB)5Cl5O2]2+, [Ag9Au2(DPPB)5Cl5O2]2+, [Ag8Au3(DPPB)5Cl5O2]2+, [Ag7Au4(DPPB)5Cl5O2]2+, and [Ag6Au5(DPPB)5Cl5O2]2+, with the same nuclearity (Ag11−xAux = M11, with x = 1–5). The position and isotopic distribution of each of these help us to assign the precise composition of the NC (see inset of Fig. 1A(ii)). The well-defined NC aggregates formed with varying solvent compositions was revealed in a previous report by DLS and TEM studies.8 As demonstrated, the nature and quantity of the nanoaggregates are dependent on the solution composition. Specifically, an increase in solution polarity, achieved by increasing the fraction of water (i.e., fwater%), corresponds to an increase in the size of nanoaggregates. To understand the possible intercluster interaction, we tried to predict the structure of NC and its ligand orientation theoretically (see Fig. S1, ESI‡). To measure the mass of each nanoaggregates corresponding to a specific composition, MP experiments were carried out by dropcasting the solution on the pre-treated glass slide (see details in ESI‡), as shown in Fig. 1B. Data for the first set of measurements with NC-aggregates at f40% solution of the solvent mixture (sol mix) i.e., 40% (v/v) water and 60% (v/v) methanol, are shown in Fig. 1C(i). The nanoaggregates exhibit non-specific binding events on the glass slide during their landing on the substrate, which are captured as microscopic events, as presented in Fig. 1C(i) images. The size distribution resulting from such multiple-binding events was captured and plotted, corresponding to a mass of 47 kDa as determined using protein calibration, at f40%. Several such MP measurements were carried out by increasing fwater%. Upon gradually increasing the water percentage in the sol mix (water%: 50%, 60%, 70%, and 80%), different sets of equimolar NC solutions were prepared, and their mass distributions were measured immediately. The stacked MP histogram presented in Fig. 1C(i)–(vi) are indicative of the average mass distributions (Mav) of promptly generated-nanoaggregates across the different sets of NC solutions. It is evident that an increment in the water percentage leads to a systematic increase in Mav. It increases from 65 to 83 to 93 to 103 kDa with an increase in water content. This systematic evolution in mass agreed with the previously reported DLS data.8 A table containing various percentages of solvents, the corresponding masses of aggregates, and the number of NCs present in each of them is presented in ESI‡ (Table S1). Aggregation numbers (NNCs) of 13, 18, 23, 26, 29, and 50 for various solvent compositions corresponding to smaller aggregates, growing aggregates, and bigger aggregates were observed. However, at water% = 90%, the size of nanoaggregates decreases, consistent with the previously reported DLS data (an explanation will be presented later).8 As expected, aggregation depends strongly on the input concentration of the NC and the binary solvent composition. In Fig. 2, we show the data obtained at a constant input concentration (∼60 nM) in two distinct solvent compositions: (i) f40% which correspond to the formation of the smallest nanoaggregates with Mav = 47 kDa, and (ii) f80% forming the largest nanoaggregates with Mav = 103 kDa. Here are two different aggregate dimensions at a given point of growth. A smaller aggregate (i.e., at f40%) grows systematically with time while the larger aggregates remain essentially invariant in time. When the water% is high, e.g., at f80%, individual NCs become unstable in solution, which make them aggregate rapidly. Lower solvent polarity results in a gradual increase in the diameter of the nanoaggregates, whereas higher solvent polarity leads to rapid aggregation, as schematically shown in Fig. 2(C). Fig. 3 illustrates the comparative size-evolution (mass) of nanoaggregates at f40% and f80% with changes in solvent polarity, represented as a function of evolution time. The total number of particles non-specifically interacting with the uncoated coverslip during measurements was recorded, and subsequently the mass of a single particle was calculated by spatio-temporal isolation (see ESI‡ for more details about data processing and mass calculations). In the case of f40% (Fig. S3, ESI‡), time-dependent measurements show a gradual increase in the mass from 39 to 47 kDa (Fig. S3(i)–(iii), ESI‡), implying solution phase growth of aggregates during the initial 20 min. After 45 min of incubation, along with simultaneous growth in smaller aggregates (<100 kDa), larger aggregates (>500 kDa) were also recorded in single particle mass analysis. These two mass distributions are shown in Fig. S3(iv) (ESI‡). This phenomenon continued until 60 min of measurement [as shown in Fig. S3(v)(a and b), ESI‡]. Similar measurements were performed in the case of f80%. Here, systematic growth of smaller particles in the smaller mass range was absent (see Fig. S3(i)–(iii), ESI‡). Moreover, the presence of bigger particles was recorded coherently throughout the entire tracking timeframe, i.e., 5–60 min. The possible NNCs were calculated from the recorded mass (see Fig. S3, ESI‡). The evolution of the size and structure of the nanoaggregates was captured first by room-temperature TEM (RT-TEM). Standard time-dependent TEM examination showed that the aggregates were well-defined NCs with a hollow-cage sphere-shaped or vesicle-like structures (as shown in Fig. S5–S7, ESI‡). For additional understanding, time dependent RT-TEM micrographs (see S7, ESI‡ for RT-TEM sample preparation) of f40% and f80% were collected. In Fig. S5–S7 (ESI‡), time dependent RT-TEM micrographs at f40% are presented, which in turn reflects that with increasing growth time (i.e., from 0 to 30 to 60 min), there is a gradual increase in Mav along with thickening of the wall of the nanoaggregates, corroborating the MP observations (see Table S2, ESI‡).
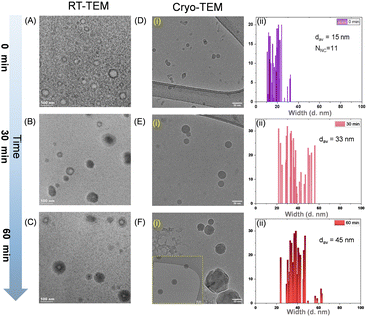
To obtain more precise information about the gradual increase in diameter during solution-phase growth, we employed cryo-EM, as shown in Fig. 4. Detailed cryo-TEM methodology is provided in the ESI.‡ While RT-TEM images suggest the presence of a hollow-cage morphology within individual nanoaggregates, this feature is less distinct in the cryo-TEM micrographs. This disparity may be attributed to differences in sample preparation methods used in the respective TEM studies. Cryo-TEM micrographs display the size evolution of nanoaggregates over time, revealing sizes of 12.5, 33, and 45 nm at 0, 30, and 60 min of aggregation, respectively. Notably, the trend in gradual increase of diameter derived from cryo-TEM data align well with the MP data. In the case of f80%, cryo-TEM and RT-TEM observations indicate the minimal size evolution of donut-shaped nanoaggregates as a function of growth time (Fig. S5–S11, ESI‡). Our data suggest that the aggregates are hollow in nature as we described previously.8 As water and methanol are miscible, we believe that the solvent molecules encapsulated within the nanoaggregates also have the same composition as in the bulk. Due to the limited mass accuracy of MP, an exact number of solvent molecules encapsulated in the aggregates is unclear. By assuming a donut-/vesicle-shaped assembly of NCs, we calculated the NNC mathematically from the average radius of the nanoaggregates obtained from the cryo-TEM micrographs. The NNC value, initially (i.e., ∼1 min incubation) was 12 which is in very good agreement with the mass calculated by MP (see Fig. S3(iv), ESI‡). A detailed mechanism of formation of NC-based nanoaggregates and their solution phase evolution are discussed in ESI‡ (see SI11). To carefully assess the applicability of MP measurements for investigating nanoparticle systems, we tried to correlate the observed MP data with cryo-TEM (see SI12, ESI‡).
In conclusion, we presented the first MP studies of atomically precise NC aggregates showing their systematic assembly leading to hollow spheres of precise composition. MP is simple, highly sensitive, intrinsically quantitative, and fast technique in measuring masses of protein complexes. We showed that atomically precise cluster aggregates could be quantified in terms of their NNC in solution. The results could be correlated with cryo-TEM and RT-TEM, which confirmed that the aggregates are hollow spheres. Their solution phase size evolution and dynamics could be observed in real-time (in MP). In conjunction with computational studies, MP makes it possible to propose structures and correlate those with emerging properties such as enhanced luminescence in such aggregates. Our study show that mass photometry is a new way to explore the properties of nanoparticle assemblies in solution.
Conflicts of interest
There are no conflicts to declare.Notes and references
- I. Chakraborty and T. Pradeep, Chem. Rev., 2017, 117, 8208–8271 CrossRef CAS PubMed.
- S. M. van de Looij, E. R. Hebels, M. Viola, M. Hembury, S. Oliveira and T. Vermonden, Bioconjugate Chem., 2021, 33, 4–23 CrossRef PubMed.
- G. Yang, Z. Wang, F. Du, F. Jiang, X. Yuan and J. Y. Ying, J. Am. Chem. Soc., 2023, 145, 11879–11898 CrossRef CAS PubMed.
- P. Chakraborty and T. Pradeep, NPG Asia Mater., 2019, 11, 48 CrossRef.
- B. Nieto-Ortega and T. Bürgi, Acc. Chem. Res., 2018, 51, 2811–2819 CrossRef CAS PubMed.
- J. B. Benedict and P. Coppens, J. Am. Chem. Soc., 2010, 132, 2938–2944 CrossRef CAS PubMed.
- P. Chakraborty, A. Nag, A. Chakraborty and T. Pradeep, Acc. Chem. Res., 2019, 52, 2–11 CrossRef CAS PubMed.
- M. Jash, A. Jana, A. K. Poonia, E. Khatun, P. Chakraborty, A. Nagar, T. Ahuja, K. V. Adarsh and T. Pradeep, Chem. Mater., 2023, 35, 313–326 CrossRef CAS.
- Y. Pei, P. Wang, Z. Ma and L. Xiong, Acc. Chem. Res., 2018, 52, 23–33 CrossRef PubMed.
- L. Yang, H. Cheng, Y. Jiang, T. Huang, J. Bao, Z. Sun, Z. Jiang, J. Ma, F. Sun, Q. Liu, T. Yao, H. Deng, S. Wang, M. Zhu and S. Wei, Nanoscale, 2015, 7, 14452–14459 RSC.
- M. Sugiuchi, J. Maeba, N. Okubo, M. Iwamura, K. Nozaki and K. Konishi, J. Am. Chem. Soc., 2017, 139, 17731–17734 CrossRef CAS PubMed.
- Q. Yao, L. Liu, S. Malola, M. Ge, H. Xu, Z. Wu, T. Chen, Y. Cao, M. F. Matus, A. Pihlajamäki, Y. Han, H. Häkkinen and J. Xie, Nat. Chem., 2023, 15, 230–239 CrossRef CAS PubMed.
- X. Wang, B. Yin, L. Jiang, C. Yang, Y. Liu, G. Zou, S. Chen and M. Zhu, Science, 2023, 381, 784–790 CrossRef CAS PubMed.
- S. Chen, W. Du, C. Qin, D. Liu, L. Tang, Y. Liu, S. Wang and M. Zhu, Angew. Chem., 2020, 132, 7612–7617 CrossRef.
- T. Li, H. Zhu and Z. Wu, Nanomaterials, 2023, 13, 1–23 Search PubMed.
- N. Nonappa, ACS Mater. Au, 2024, 4(3), 238–257 CrossRef PubMed.
- W. A. Dar, A. Jana, K. S. Sugi, G. Paramasivam, M. Bodiuzzaman, E. Khatun, A. Som, A. Mahendranath, A. Chakraborty and T. Pradeep, Chem. Mater., 2022, 34, 4703–4711 CrossRef CAS.
- A. Pinkard, A. M. Champsaur and X. Roy, Acc. Chem. Res., 2018, 51, 919–929 CrossRef CAS PubMed.
- S. Basu, H. Fakhouri, C. Moulin, S. Dolai, I. Russier-Antoine, P. F. Brevet, R. Antoine and A. Paul, Nanoscale, 2021, 13, 4439–4443 RSC.
- M. Kinter, Anal. Chem., 1995, 67, 493–497 CrossRef.
- M. M. Alvarez, J. T. Khoury, T. G. Schaaff, M. N. Shafigullin, I. Vezmar and R. L. Whetten, J. Phys. Chem. B, 1997, 101, 3706–3712 CrossRef CAS.
- V. Liljeström, A. Ora, J. Hassinen, H. T. Rekola, N. Nonappa, M. Heilala, V. Hynninen, J. J. Joensuu, R. H. A. Ras, P. Törmä, O. Ikkala and M. A. Kostiainen, Nat. Commun., 2017, 8, 1–10 CrossRef PubMed.
- A. Sonn-Segev, K. Belacic, T. Bodrug, G. Young, R. T. VanderLinden, B. A. Schulman, J. Schimpf, T. Friedrich, P. V. Dip, T. U. Schwartz, B. Bauer, J.-M. Peters, W. B. Struwe, J. L. P. Benesch, N. G. Brown, D. Haselbach and P. Kukura, Nat. Commun., 2020, 11, 1772 CrossRef CAS PubMed.
- R. W. Taylor and V. Sandoghdar, Nano Lett., 2019, 19, 4827–4835 CrossRef CAS PubMed.
- L. Melo, A. Hui, M. Kowal, E. Boateng, Z. Poursorkh, E. Rocheron, J. Wong, A. Christy and E. Grant, J. Phys. Chem. B, 2021, 125, 12466–12475 CrossRef CAS PubMed.
- E. D. B. Foley, M. S. Kushwah, G. Young and P. Kukura, Nat. Methods, 2021, 18, 1247–1252 CrossRef CAS PubMed.
- M. Liebthal, M. S. Kushwah, P. Kukura and K.-J. Dietz, iScience, 2021, 24, 103258 CrossRef CAS PubMed.
- M. Bamburowicz-Klimkowska, M. Poplawska and I. P. Grudzinski, J. Nanobiotechnol., 2019, 17, 48 CrossRef PubMed.
- TwoMP Mass Photometer for Protein Characterization|Refeyn, https://www.refeyn.com/twomp-mass-photometer, accessed 18 July 2023.
Footnotes |
| † Dedicated to Archita Patnaik, a colleague and valued friend, to celebrate her 65th birthday. |
| ‡ Electronic supplementary information (ESI) available. See DOI: https://doi.org/10.1039/d4cc00363b |
| This journal is © The Royal Society of Chemistry 2024 |


