 Open Access Article
Modelling and analysis of polarisation characteristics in lithium insertion electrodes considering charge transfer and contact resistances†
Kingo
Ariyoshi
 * and
Yuma
Nagashima
Department of Chemistry and Bioengineering, Graduate School of Engineering, Osaka Metropolitan University, 3-3-138 Sugimoto, Sumiyoshi, Osaka 558-8585, Japan. E-mail: ariyoshi@omu.ac.jp
First published on 10th October 2024
Abstract
The polarisation behaviour of Li[Li0.1Al0.1Mn1.8]O4 (LAMO) electrodes is influenced by charge transfer resistance (Rct) and contact resistance (Rcont). In this study, using symmetric LAMO/LAMO cells, we find that polarisation curves shift from exponential (Tafel-like) to linear (Ohm's law-like) as Rct decreases relative to Rcont, particularly at lower temperatures and higher frequencies. A new polarisation equation, based on an equivalent circuit model, explains the transition from exponential to linear polarisation curves observed in experiments. Our results indicate that reducing Rcont is more crucial than Rct for improving electrode power capability.
The power capability of lithium-ion batteries (LIBs) is determined by the polarisation behaviour of the lithium insertion electrodes used as positive and negative electrodes. Electrochemical impedance spectroscopy (EIS) is most often used to analyse the reaction kinetics of lithium insertion electrodes,1–5 as it allows the quantitative evaluation of the resistance components of the electrodes, such as charge transfer and contact resistances. However, because a linear relationship does not exist between the overpotential and current in electrochemical reactions, the polarisation behaviour of the electrode cannot be simply predicted from Ohm's law, assuming a linear response, even if the values of each resistance component obtained by EIS are identified. According to the electrochemical kinetic theory, the polarisation characteristic obeys the Tafel (more rigorously Butler–Volmer) equation; therefore, the current response should exhibit an exponential dependence on the overpotential. However, when steady-state polarisation measurements were performed for lithium insertion electrodes, a linear relationship between the applied voltage and current response was frequently observed.6,7 In this study, to provide a reasonable explanation for the discrepancy between the polarisation behaviours—exponential relationship predicted by electrochemical theory versus linear relationship observed in actual lithium insertion electrodes—we developed a polarisation equation based on the equivalent circuit model determined from EIS measurements using symmetric cells.
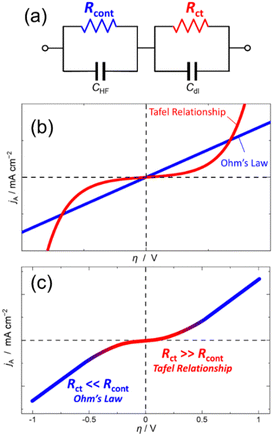
As shown in Fig. 1a, the equivalent circuit of the lithium insertion electrodes comprising a series connection of the charge transfer resistance (Rct) caused by the lithium insertion reaction and the contact resistance (Rcont) caused by the electron transfer between the electrode and current collector.8–10 The overvoltage required for each process can be calculated by the Tafel equation for the activation overvoltage due to the charge transfer reaction (ηct), and the Ohm's law for the resistance overvoltage due to the contact resistance (ηcont) (Fig. 1b). Therefore, the following polarisation equation for the lithium insertion electrode is obtained (see ESI† for derivation of the equation).
 | (1) |
 | ||
| Fig. 1 (a) An equivalent circuit of lithium insertion electrodes comprising contact resistance (Rcont) and charge transfer resistance (Rct) connected in series. (b) Current versus overvoltage relationship based on Ohm's law (blue) and Tafel equation (red). (c) Polarisation curve of lithium insertion electrodes calculated from eqn (1) based on the equivalent circuit of (a). | ||
To depict the polarization curve, total current was obtained by sum of the cathodic and anodic currents calculated from eqn (1). The polarisation curve (Fig. 1c) can be divided into two regions: an exponential relationship similar to the Tafel relation at a small overvoltage, and a linear relationship similar to Ohm's law at a large overvoltage. When ηct is much larger than ηcont at low current density, η is virtually equal to ηct. Consequently, the polarisation curve follows Tafel's law. Conversely, when ηct is significantly smaller than ηcont at high current density, η approaches to ηcont with increasing the current density. As such, the shape of the polarisation curve changes with the overpotential because the overpotential dependences of the two types of resistances comprising the equivalent circuit of the lithium insertion electrode are different.
Li[Li0.1Al0.1Mn1.8]O4 (LAMO) has a spinel structure (Fig. S1, ESI†) that was used as the active material. The electrochemical behaviour of the LAMO was examined using diluted-LAMO electrodes11–13via constant-current charge–discharge measurements. Procedures of electrode preparation and cell fabrication can be found in the ESI.† The charge–discharge curves of the Li/LAMO cells (Fig. S2, ESI†) show an operating voltage of 4 V with 103 mA h g−1 of rechargeable capacity, which is similar to that reported previously.14 A LAMO/LAMO symmetric cell comprising two identical diluted-LAMO electrodes with the same weight, thickness, and capacity exhibited the same reversible capacity of 103 mA h g−1 as that of the Li/LAMO cell (Fig. S3, ESI†).
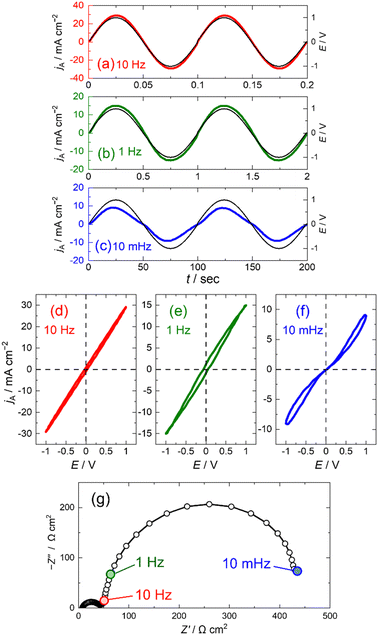
Steady-state polarisation measurements of the LAMO/LAMO-symmetric cells were performed to investigate the polarisation behaviour of the LAMO electrode (Fig. 2a–c). For steady-state polarisation measurements, a sinusoidal voltage with large amplitude of 1000 mV was applied to the cell to measure the response current (see ESI† for experimental details).6,7 At frequencies of 10 and 1.0 Hz, current profiles were sinusoidal in shape as the same as the applied voltage without any phase difference, while the current was distorted at frequency of 10 mHz especially in small overvoltage region. The maximum current density increased with the frequency. Steady-state polarisation curves were obtained by plotting the output current against the applied voltage (Fig. 2d–f). The shapes of the polarisation curves changed significantly depending on the frequency. At low frequency (10 mHz), the polarisation curve was distorted to an exponential relationship, although the polarisation curves were linear at high frequencies of 1 and 10 Hz, indicating that the polarisation behaviour of the LAMO electrode is based on Tafel relationship and Ohm's law at low and high frequencies, respectively.
EIS measurements were performed on the LAMO/LAMO symmetric cell to investigate the frequency dependence of the polarisation curves (Fig. 2g). The Nyquist plot shows two semicircles attributed to contact resistance (Rcont) and charge transfer resistance (Rct) for the high- and low-frequency arcs, respectively.15–20 In the Nyquist plot, the impedance (Z) of 10 and 1.0 Hz were located at the end of the high-frequency arc, while the Z of 10 mHz at the end of the low-frequency arc, indicating that Rct should be ignored in the polarisation measurements at 10 and 1.0 Hz, and the resistance of the LAMO electrodes is dominated by Rcont alone.
Consequently, the polarisation curves at 10 and 1 Hz were determined using Ohm's law, which resulted in a linear curve owing to the contribution of Rcont. However, at frequency at 10 mHz, the resistance of the LAMO electrode includes Rct in addition to Rcont. Therefore, the polarisation behaviour at low frequency can be described by eqn (1), considering both Rct and Rcont, results in a distorted polarisation curve with an exponential shape. These results indicate that to calculate the polarisation curves of lithium insertion electrodes, it is necessary to consider not only Rct for the lithium insertion/extraction reaction but also Rcont originating from the electronic conduction between the active materials and the current collector.
Previous studies show that Rct follows the Arrhenius relationship, wherein Rct increases significantly as temperature decreases, whereas Rcont is almost constant regardless of the temperature.9,21 Therefore, polarisation measurements at different temperatures enable the investigation of how the polarisation curves change with the ratio of the two resistances. In the steady-state polarisation curves measured at different temperatures of −15, −2, and 25 °C (Fig. S4, ESI†), the output current at 25 °C exhibits sinusoidal shape in spite of the large voltage of 1000 mV; however, it was distorted at −15 °C especially in the low overvoltage region.
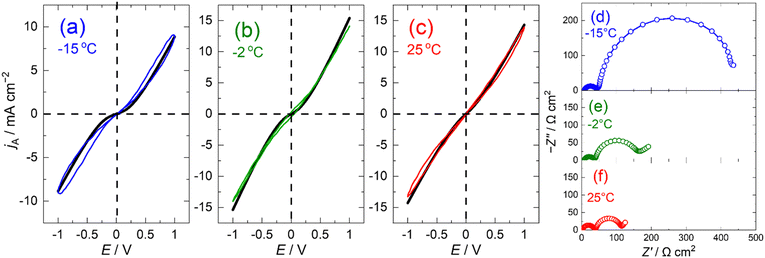
The polarisation curves obtained by plotting the output current against the applied voltage exhibited different shapes depending on the temperature (Fig. 3a–c). Although the measured frequencies are different, this difference does not affect the shape of polarization curves (Fig. S5, ESI†). The curves at 25 and −2 °C showed linear relationship, whereas the curve at −15 °C showed an exponential relationship. This indicates that the polarisation curve of the lithium insertion electrodes changed from linear to exponential when the measurement temperature decreased. Such a change in the shape of the polarisation curves can occur when Rct decreases as the temperature decreases.
To confirm that the curve shape was related to the resistance ratio Rct/Rcont, the polarisation curves were fitted using eqn (1). By adjusting the values of Rct and Rcont, the calculated polarisation curves (black lines) were well-fitted to the observed curves. At −15 °C, where the polarisation curve showed an exponential shape, the Rct and Rcont were 400 and 80 Ω cm2, respectively, and Rct was 5 times larger than Rcont. Conversely, Rct significantly decreased as the temperature increased. At −2 or 25 °C where the polarisation curve was linear, Rct was two times larger or virtually the same as Rcont, respectively.
To verify the validity of Rct and Rcont estimated by fitting the polarisation curves, EIS measurements were performed on the LAMO/LAMO symmetric cell at −15, −2, and 25 °C. (Fig. 3d–f). The size of the high-frequency arc attributed to the contact resistance was approximately constant regardless of the temperature, whereas the size of the low-frequency arc attributed to the charge-transfer resistance increased significantly with decreasing temperature. Comparing Rct and Rcont at each temperature determined from the curve fitting and EIS (Table 1), Rcont showed a slight deviation owing to the solution resistance, but the Rct values were approximately consistent. The good agreement between Rct and Rcont determined by EIS and polarisation curve fitting proves that the polarisation equation developed in this study enables the prediction of the power capability of the lithium insertion electrodes and provides a rational explanation of the polarisation curves from a linear to exponential shape.
| Temp. (°C) | Impedance | Polarisation | |
|---|---|---|---|
| −15 | R ct | 400 | 400 |
| R cont | 50 | 80 | |
| −2 | R ct | 125 | 100 |
| R cont | 40 | 60 | |
| 25 | R ct | 70 | 70 |
| R cont | 40 | 60 |
It has been reported that the temperature change of Rct follows the Arrhenius equation.8–10 Thus, by taking into account the temperature dependence of Rct, the polarization equation is expressed by the following equation.
However, in this paper, it is difficult to estimate Arrhenius parameters of the activation energy Ea and pre-exponential factor A due to the small number of measurement points at different temperatures. In previous reports,8–10Rcont has almost no temperature dependence, and the temperature dependence of Rct follows the Arrhenius relationship. Consequently, by obtaining the Arrhenius parameters, it is possible to predict polarization behaviour over a wide temperature range with a single polarization equation, but it will be a research topic in the future.
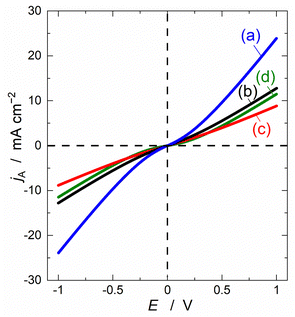
As discussed above, the shape of polarisation curves of lithium insertion electrodes is determined by the ratio of Rcont and Rct. The polarisation curve shows a linear relationship for Rct < Rcont, whereas it has an exponential relationship for Rct > Rcont. To clarify the impact of Rct and Rcont on the power density of the lithium insertion electrodes, the polarisation curves were calculated based on eqn (1) for various ratios of Rct to Rcont, as shown in Fig. 4. When Rcont decreased and Rct remained constant, the output current varied significantly in the large-overvoltage region, which was associated with the change in the polarisation curves from linear to exponential. Conversely, no change in the output current was observed with varying Rct. From these results, we can conclude that as Rcont decreases, the power capability of the electrodes improves dramatically. In other words, the power capability is significantly affected by Rcont rather than Rct.
 | ||
| Fig. 4 Simulated polarisation curves of a lithium insertion electrode calculated from eqn (1) based on the equivalent circuit in Fig. 1a. Values of Rct and Rcont are (a) 60 and 30, (b) 60 and 60, (c) 60 and 90 and (d) 180 and 60 Ω cm2, respectively. | ||
In summary, the polarisation behaviour of lithium insertion electrodes was investigated using a symmetric LAMO/LAMO cell, and the polarisation curve changed from linear to exponential depending on the temperature and frequency. The polarisation equation derived from an equivalent circuit model in which the charge transfer and contact resistances were connected in series was successfully used to reproduce the observed polarisation curves. The values of Rct and Rcont estimated by fitting the polarisation curves are in good agreement with those obtained by EIS measurements. Therefore, the shape of the polarisation curve is determined by the ratio of Rct and Rcont; Rct > Rcont leads to the distorted curve versus Rct < Rcont to linear curve. Furthermore, reducing Rcont rather than Rct plays a more important role in increasing the power capability of the lithium insertion electrodes.
This work was supported by a grant from the GteX Program Japan (JPMJGX23S5) and the 2024 Osaka Metropolitan University (OMU) Strategic Research Promotion Project (Priority Research).
Data availability
The data supporting this article have been included as part of the ESI.†Conflicts of interest
There are no conflicts to declare.References
- T. Osaka, D. Mukoyama and H. Nara, J. Electrochem. Soc., 2015, 162, A2529–A2537 CrossRef CAS.
- H. Nara, T. Yokoshima and T. Osaka, Curr. Opin. Electrochem., 2020, 20, 66–77 CrossRef CAS.
- K. Ariyoshi, Z. Siroma, A. Mineshige, M. Takeno, T. Fukutsuka, T. Abe and S. Uchida, Electrochemistry, 2022, 90, 102007 CrossRef CAS.
- K. Ariyoshi, Z. Siroma, A. Mineshige, M. Takeno, T. Fukutsuka, T. Abe and S. Uchida, Electrochemistry, 2022, 90, 102008 CrossRef CAS.
- K. Nakura, K. Ariyoshi, F. Ogaki, K. Takaoka and T. Ohzuku, J. Electrochem. Soc., 2014, 161, A841–A846 CrossRef CAS.
- T. Ohzuku, R. Yamato, T. Kawai and K. Ariyoshi, J. Solid State Electrochem., 2007, 12, 979–985 CrossRef.
- K. Ariyoshi, Y. Maeda, T. Kawai and T. Ohzuku, J. Electrochem. Soc., 2011, 158, A281–A284 CrossRef CAS.
- H. Nara, D. Mukoyama, T. Yokoshima, T. Momma and T. Osaka, J. Electrochem. Soc., 2016, 163, A434–A441 CrossRef CAS.
- H. Nara, D. Mukoyama, R. Shimizu, T. Momma and T. Osaka, J. Power Sources, 2019, 409, 139–147 CrossRef CAS.
- K. Ariyoshi, Electrochemistry, 2024, 92, 37007 CrossRef CAS.
- K. Ariyoshi, S. Mizutani, T. Makino and Y. Yamada, J. Electrochem. Soc., 2018, 165, A3965–A3970 CrossRef CAS.
- K. Ariyoshi, J. Sugawa and S. Masuda, J. Electrochem. Soc., 2020, 167, 140517 CrossRef CAS.
- K. Ariyoshi, J. Sugawa and S. Masuda, J. Power Sources, 2021, 509, 230349 CrossRef CAS.
- K. Ariyoshi, E. Iwata, M. Kuniyoshi, H. Wakabayashi and T. Ohzuku, Electrochem. Solid-State Lett., 2006, 9, A557–A560 CrossRef CAS.
- A. S. Keefe, S. Buteau, I. G. Hill and J. R. Dahn, J. Electrochem. Soc., 2019, 166, A3272–A3279 CrossRef CAS.
- K. Ariyoshi, S. Mizutani and Y. Yamada, J. Power Sources, 2019, 435, 226810 CrossRef CAS.
- K. Ariyoshi, M. Tanimoto and Y. Yamada, Electrochim. Acta, 2020, 364, 137292 CrossRef CAS.
- L. A. Middlemiss, A. J. R. Rennie, R. Sayers and A. R. West, Energy Rep., 2020, 6, 232–241 CrossRef.
- M. Gaberšček, Nat. Commun., 2021, 12, 6513 CrossRef PubMed.
- L. Stolz, M. Gaberšček, M. Winter and J. Kasnatscheew, Chem. Mater., 2022, 34, 10272–10278 CrossRef CAS.
- N. Ogihara, S. Kawauchi, C. Okuda, Y. Itou, Y. Takeuchi and Y. Ukyo, J. Electrochem. Soc., 2012, 159, A1034–A1039 CrossRef CAS.
Footnote |
| † Electronic supplementary information (ESI) available: Experimental section; derivation of the polarisation equation of lithium insertion electrodes; XRD pattern of LAMO; charge–discharge profiles of a diluted-LAMO electrode; charge–discharge profiles of a symmetric cell; polarisation measurements of a symmetric cell; steady-state polarisation curves of a symmetric cell. See DOI: https://doi.org/10.1039/d4cc04375h |
| This journal is © The Royal Society of Chemistry 2024 |


