Cd(II) coordination polymers constructed from tris-pyridyl-tris-amide and polycarboxylic acid: synthesis, structures and sensing properties†
Chia-Ling
Chen
,
Song-Wei
Wang
,
Shih-Ying
Zhong
and
Jhy-Der
Chen
 *
*
Department of Chemistry, Chung Yuan Christian University, Chung-Li, Taiwan, Republic of China. E-mail: jdchen@cycu.edu.tw
First published on 18th December 2023
Abstract
Reactions of N,N′,N′′-tris(3-methylpyridyl)trimesic amide (L) and Cd(OAc)2·2H2O with various polycarboxylic acids afforded {[Cd2(L)(1,4-BDC)2(H2O)2]·2H2O}n (1,4-H2BDC = benzene-1,4-dicarboxylic acid), 1, {[Cd(L)(4,4′-BDC)(H2O)]·H2O}n (4,4′-H2BDC = biphenyl-4,4′-dicarboxylic acid), 2, and {[Cd3(L)2(1,3,5-BTC)2(H2O)6]·15H2O}n (1,3,5-H3BTC = benzene-1,3,5-tricarboxylic acid), 3, which have been structurally determined by using single-crystal X-ray diffraction. Complexes 1–3 display 2D layers with (3·82)2(32·4)2(36·44·52·84·96·105·11), (44·62)-sql and (42·124)3(43)4-3,4L129 topologies, respectively, indicating that the identities of the polycarboxylate ligands involving length and shape play important roles in determining the structural diversity. Complexes 1 and 2 show stabilities in various solvents and display high selectivity toward sensing of Fe3+ ions with low detection limits and good reusability of up to five cycles.
Introduction
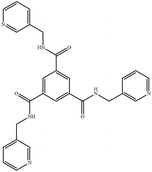
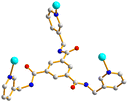
Coordination polymers (CPs) have shown various intriguing structures and properties and are applicable in fields such as gas storage and separation, ion exchange, magnetism, luminescence, catalysis and sensors.1–10 Spacer ligands provide lone pairs of electrons and metal atoms afford empty orbitals for the formation of metal–ligand bonds, which extend through self-assembly to form 1- (1D), 2- (2D) or 3-dimensional (3D) structures. The structural diversity is governed by several factors, including the identity of the metal, and the softness, coordination ability and donor-atom directions of the ligands as well as the reaction conditions (solvent system, temperature and time).11The chemistry of bis-pyridyl-bis-amide (bpba) based CPs has been investigated extensively and interesting structural types thus prepared have been identified.12,13 The bpba ligands bear pairs of pyridyl nitrogen atoms and amide oxygen atoms that may coordinate with the transition metal atoms to form CPs with different dimensionality, whereas the two amide groups play important roles as abundant potential hydrogen bond sites.14 Extension of the bpba to tripodal ligands with the C3 symmetry containing three amide groups and three pyridyl rings (tris-pyridyl-tris-amide, tpta) may result in CPs with different structural diversity.15–18 In addition, by adjusting the –(CH2)n– skeleton, the flexibility of the ligand can be enhanced, thus affecting the final structures of the target CPs. Several CPs based on the flexible tpta, N,N′,N′′-tris(3-methylpyridyl)trimesic amide (L), Fig. 1, have been reported. While interesting luminescence properties have been shown for [CuI(L)]n,11 the complex [Ag(L)N3]n displays an intriguing two-fold interpenetrated 3D structure with interlocked cage-like moieties.12 The pyridyl nitrogen atoms of L usually show better coordination ability than the amide oxygen atoms and the amide oxygen atoms may provide opportunity for metal sensing through the C![[double bond, length as m-dash]](https://www.rsc.org/images/entities/char_e001.gif) O⋯Mn+ interaction.
O⋯Mn+ interaction.
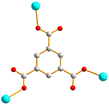
Herein, the syntheses and structures of three CPs based on L and supported by the polycarboxylate ligands, including {[Cd2(L)(1,4-BDC)2(H2O)2]·2H2O}n (1,4-H2BDC = benzene-1,4-dicarboxylic acid), 1, {[Cd(L)(4,4′-BDC)(H2O)]·H2O}n (4,4′-H2BDC = biphenyl-4,4′-dicarboxylic acid), 2, and {[Cd3(L)2(1,3,5-BTC)2(H2O)6]·15H2O}n (1,3,5-H3BTC = benzene-1,3,5-tricarboxylic acid), 3, are reported. The sensing properties of 1 and 2 toward the metal ions are also investigated.
Experimental details
General procedures
IR spectra (KBr disk) were obtained from a JASCO FT/IR-460 plus spectrometer. Elemental analyses were performed on an Elementar Vario EL III or an Elementar Vario EL cube type analyzer. Thermal gravimetric analyses (TGA) measurements were carried out on a SII Nano Technology Inc. TG/DTA 6200 over the temperature range of 30 to 900 °C at a heating rate of 10 °C min−1 under N2. Powder X-ray diffraction measurements were performed on a Bruker D2 PHASER diffractometer with CuKα (λα = 1.54 Å) radiation. Emission spectra were collected by using a Hitachi F-7000 spectrometer and the setting of PMT voltage was 250 V. Gas sorption measurements were conducted on a Micromeritics ASAP 2020 system. XPS patterns were measured on a hard X-ray photoelectron spectrometer-ULVAC-PHI (Quantes).Materials
The reagent Cd(OAc)2·2H2O was purchased from Fisher Scientific Co., 1,3,5-benzenetricarboxylic acid from Alfa Aesar Co., 1,4-benzendicarboxylic acid from SHOWA Co., and biphenyl-4,4′-dicarboxylic acid from Nova. The ligand N,N′,N′′-tris(3-methylpyridyl)trimesic amide (L) was prepared according to a published procedure.19Preparation of {[Cd2(L)(1,4-BDC)2(H2O)2]·2H2O}n, 1
A mixture of Cd(OAc)2·2H2O (0.027 g, 0.10 mmol), L (0.048 g, 0.10 mmol), terephthalic acid (1,4-H2BDC) (0.017 g, 0.10 mmol) and 10 mL of H2O/EtOH (5![[thin space (1/6-em)]](https://www.rsc.org/images/entities/char_2009.gif) :
:![[thin space (1/6-em)]](https://www.rsc.org/images/entities/char_2009.gif) 5) was sealed in a 23 mL Teflon-lined stainless-steel autoclave which was heated under autogenous pressure to 120 °C for two days and then the reaction system was cooled to room temperature at a rate of 2 °C per hour. The colorless crystals suitable for single-crystal X-ray diffraction were obtained. Yield: 0.029 g (52%). Anal. calcd for C43H40N6O15Cd2 (MW = 1105.61): C, 46.71; H, 3.64; N, 7.60%. Found: C, 46.36; H, 3.58; N, 7.35%. FT-IR (cm−1): 3465(s), 1645(m), 1560(s), 1385(m), 1289(m), 830(w), 745(w), Fig. S1.†
5) was sealed in a 23 mL Teflon-lined stainless-steel autoclave which was heated under autogenous pressure to 120 °C for two days and then the reaction system was cooled to room temperature at a rate of 2 °C per hour. The colorless crystals suitable for single-crystal X-ray diffraction were obtained. Yield: 0.029 g (52%). Anal. calcd for C43H40N6O15Cd2 (MW = 1105.61): C, 46.71; H, 3.64; N, 7.60%. Found: C, 46.36; H, 3.58; N, 7.35%. FT-IR (cm−1): 3465(s), 1645(m), 1560(s), 1385(m), 1289(m), 830(w), 745(w), Fig. S1.†
Preparation of {[Cd(L)(4,4′-BDC)(H2O)]·H2O}n, 2
Complex 2 was prepared by following the similar procedure for 1, except that a mixture of Cd(OAc)2·2H2O (0.027 g, 0.10 mmol), L (0.048 g, 0.10 mmol), and biphenyl-4,4′-dicarboxylic acid (4,4′-H2BDC) (0.024 g, 0.10 mmol) in 10 mL of 0.01 M NaOH solution was used. Colorless crystals were obtained. Yield: 0.049 g (56%). Anal. calcd for C41H36N6O9Cd (MW = 869.16): C, 56.66; H, 4.17; N, 9.67%. Found: C, 56.74; H, 3.99; N, 9.11%. FT-IR (cm−1): 3440(s), 1679(w), 1643(m), 1581(s), 1535(s), 1397(m), 1385(m), 1299(w), 1286(w), 855(w), 764(w), 710(w), 668(w), Fig. S2.†Preparation of {[Cd3(L)2(1,3,5-BTC)2(H2O)6]·15H2O}n, 3
Complex 3 was prepared by following the similar procedure for 1, except that a mixture of Cd(OAc)2·H2O (0.080 g, 0.30 mmol), L (0.048 g, 0.10 mmol), and benzene-1,3,5-tricarboxylic acid (1,3,5-H3BTC) (0.042 g, 0.20 mmol) in 10 mL of 0.01 M NaOH solution was used. Colorless crystals were obtained. Yield: 0.083 g (40%). Anal. calcd for C72H96Cd3N12O39 (MW = 2090.80): C, 41.36; H, 4.62; N, 8.03%. Anal. calcd for C72H96Cd3N12O39 + 5.5 H2O (MW = 2189.90): C, 39.48; H, 4.92; N, 7.68%. Found: C, 39.03; H, 4.19; N, 7.44%. FT-IR (cm−1): 3426(s), 3248(s), 1640(s), 1595(m), 1555(m), 1431(m), 1345(w), 1298(m), 1190(w), 1108(w), 1032(w), 909(w), 841(w), 796(m), 720(m), 689(m), 494(w), Fig. S3.†X-ray crystallography
The diffraction data for complexes 1–3 were collected on a Bruker AXS SMART APEX II CCD diffractometer, which was equipped with a graphite-monochromated Mo Kα (λα = 0.71073 Å) radiation. Data reduction was carried out by standard methods with the use of well-established computational procedures.20 The structure factors were obtained after Lorentz and polarization corrections. An empirical absorption correction based on “multi-scan” was applied to the data for all complexes. The position of some of the heavier atoms were located by the direct or pattern method. The remaining atoms were found in a series of alternating difference Fourier maps and least-square refinements, while the hydrogen atoms except those of the water molecules were added by using the HADD command in SHELXTL 6.1012.21Table 1 lists the crystal data for complexes 1–3. The alert B in the checkcif file of complex 3 is related to the weak diffraction of the crystal.| Complex | 1 | 2 | 3 |
|---|---|---|---|
| a R 1 = ∑‖Fo| − |Fc‖/∑|Fo|. b wR2 = [∑w(Fo2 − Fc2)2/∑w(Fo2)2]1/2. w = 1/[σ2(Fo2) + (ap)2 + (bp)], p = [max(Fo2 or 0) + 2(Fc2)]/3. a = 0.0229, b = 1.3367 for 1; a = 0.0511, b = 0.0000 for 2; a = 0.0387, b = 128.7402 for 3. c Quality-of-fit = [∑w(|Fo2| − |Fc2|)2/Nobserved − Nparameters]1/2. | |||
| Formula | C43H40Cd2N6O15 | C41H36CdN6O9 | C72H96Cd3N12O39 |
| Formula weight | 1105.61 | 869.16 | 2090.80 |
| Crystal system | Triclinic | Monoclinic | Trigonal |
| Space group |
P![[1 with combining macron]](https://www.rsc.org/images/entities/char_0031_0304.gif) |
P21/n | R3c |
| a, Å | 9.9297(1) | 10.6729(2) | 20.134(4) |
| b, Å | 10.5228(1) | 27.5687(4) | 20.134(4) |
| c, Å | 21.8433(3) | 13.9401(2) | 38.292(8) |
| α, ° | 94.3066(7) | 90 | 90.00 |
| β, ° | 95.3186(6) | 108.0009(9) | 90.00 |
| γ, ° | 107.1061(6) | 90 | 120.00 |
| V, Å3 | 2159.41(4) | 3900.93(11) | 13![[thin space (1/6-em)]](https://www.rsc.org/images/entities/char_2009.gif) 443(6) 443(6) |
| Z | 2 | 4 | 6 |
| D calc, Mg m−3 | 1.700 | 1.480 | 1.550 |
| F(000) | 1112 | 1776 | 6408 |
| μ(Mo Kα), mm−1 | 1.064 | 0.624 | 0.800 |
| Range (2θ) for data collection, deg | 3.768 to 56.728 | 2.954 to 56.618 | 3.160 to 51.986 |
| Independent reflections | 10![[thin space (1/6-em)]](https://www.rsc.org/images/entities/char_2009.gif) 631 [R(int) = 0.0343] 631 [R(int) = 0.0343] |
10![[thin space (1/6-em)]](https://www.rsc.org/images/entities/char_2009.gif) 631 [R(int) = 0.0343] 631 [R(int) = 0.0343] |
5878 [R(int) = 0.1748] |
| Data/restraints/parameters | 10![[thin space (1/6-em)]](https://www.rsc.org/images/entities/char_2009.gif) 631/0/595 631/0/595 |
9706/0/545 | 5878/1/342 |
| Quality-of-fit indicatorc | 1.014 | 1.006 | 1.032 |
| Final R indices[I > 2σ(I)]a,b | R 1 = 0.0346, wR2 = 0.0626 | R 1 = 0.0498, wR2 = 0.0966 | R 1 = 0.0582, wR2 = 0.1069 |
| R indices (all data) | R 1 = 0.0539, wR2 = 0.0687 | R 1 = 0.1120, wR2 = 0.1148 | R 1 = 0.1134, wR2 = 0.1292 |
Results and discussion
Crystal structure of 1
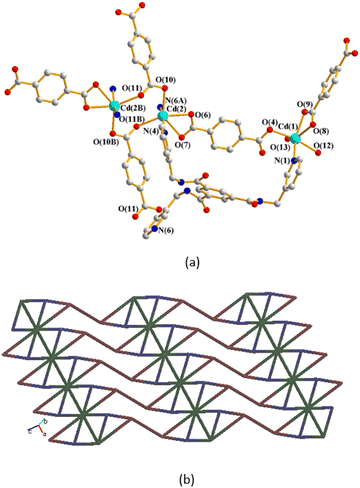
The single-crystal X-ray diffraction analysis shows that 1 crystallizes in the triclinic space group P![[1 with combining macron]](https://www.rsc.org/images/entities/char_0031_0304.gif) . The asymmetric unit consists of two Cd(II) cations, one L ligand, one and two halves of a 1,4-BDC2− ligand, two coordinated water molecules and two lattice water molecules. Fig. 2(a) depicts a drawing showing the coordination environments about the Cd(II) ions of 1. Both the Cd(1) and Cd(2) metal centers adopt the distorted octahedral geometry. While the Cd(1) atom is six-coordinated by five oxygen atoms from two 1,4-BDC2− ligands and two coordinated water molecules [Cd–O = 2.2647(20)–2.4833(16) Å], and one pyridyl nitrogen atom from the L ligand [Cd–N = 2.2962(23) Å], the Cd(2) metal center is six-coordinated by four oxygen atoms from three 1,4-BDC2− ligands [Cd–O = 2.3171(20)–2.5714(20) Å] and two pyridyl nitrogen atoms from two L ligands [Cd–N = 2.3305(22)–2.2778(23) Å], resulting in dinuclear units with a Cd(II)⋯Cd(II) distance of 11.3579(6) Å. The Cd(II) atoms are further linked by 1,4-BDC2− and L ligands to afford a 2D layer. If the Cd(2) dinuclear units are defined as 8-connected nodes, whereas the Cd(1) atoms and the L ligands as 3-connected nodes and the 1,4-BDC2− ligands as linkers, the structure of 1 can be regarded as a 3,3,8-connected 2D net with a new (3·82)2(32·4)2(36·44·52·84·96·105·11) topology, as shown in Fig. 2(b), determined using ToposPro.22
. The asymmetric unit consists of two Cd(II) cations, one L ligand, one and two halves of a 1,4-BDC2− ligand, two coordinated water molecules and two lattice water molecules. Fig. 2(a) depicts a drawing showing the coordination environments about the Cd(II) ions of 1. Both the Cd(1) and Cd(2) metal centers adopt the distorted octahedral geometry. While the Cd(1) atom is six-coordinated by five oxygen atoms from two 1,4-BDC2− ligands and two coordinated water molecules [Cd–O = 2.2647(20)–2.4833(16) Å], and one pyridyl nitrogen atom from the L ligand [Cd–N = 2.2962(23) Å], the Cd(2) metal center is six-coordinated by four oxygen atoms from three 1,4-BDC2− ligands [Cd–O = 2.3171(20)–2.5714(20) Å] and two pyridyl nitrogen atoms from two L ligands [Cd–N = 2.3305(22)–2.2778(23) Å], resulting in dinuclear units with a Cd(II)⋯Cd(II) distance of 11.3579(6) Å. The Cd(II) atoms are further linked by 1,4-BDC2− and L ligands to afford a 2D layer. If the Cd(2) dinuclear units are defined as 8-connected nodes, whereas the Cd(1) atoms and the L ligands as 3-connected nodes and the 1,4-BDC2− ligands as linkers, the structure of 1 can be regarded as a 3,3,8-connected 2D net with a new (3·82)2(32·4)2(36·44·52·84·96·105·11) topology, as shown in Fig. 2(b), determined using ToposPro.22
Crystal structure of 2
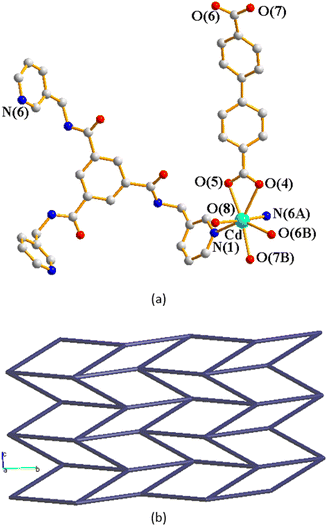
Crystals of complex 2 conform to the monoclinic space group P21/n and each asymmetric unit consists of one Cd(II) cation, one L ligand, one 4,4′-BDC2− ligand, one coordinated water molecule and one lattice water molecule. Fig. 3(a) depicts a drawing showing the coordination environment about the Cd(II) ion of 2, which is seven-coordinated by four oxygen atoms from two 4,4′-BDC2− ligands and one water molecule [Cd–O = 2.285(2)–2.520(2) Å] and two pyridyl nitrogen atoms from two L ligands [Cd–N = 2.348(3)–2.406(3) Å], resulting in the distorted pentagonal bipyramidal geometry. The Cd(II) cations are further linked together by 4,4-BDC2− and L ligands to afford a 2D layer. If the Cd(II) cations are defined as 4-connected nodes, whereas the ligands as linkers, the structure of 2 can be simplified as a 4-connected net with the (44·62)-sql topology, as shown in Fig. 3(b).Crystal structure of 3
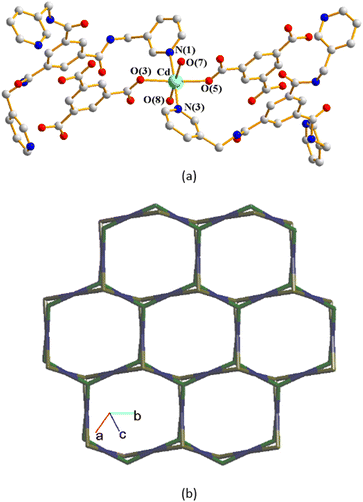
The structure of complex 3 was solved in the trigonal space group R3c. The asymmetric unit consists of one Cd(II) cation, two thirds of an L ligand, two thirds of a 1,3,5-BTC3− ligand, two coordinated water molecules and five lattice water molecules. Fig. 4(a) depicts a drawing showing the coordination environment about the Cd(II) ion of 3, which is six-coordinated by four oxygen atoms from two 1,3,5-BTC3− ligands and two water molecules [Cd–O = 2.265(11)–2.305(8) Å], and two pyridyl nitrogen atoms from two L ligands [Cd–N = 2.317(16)–2.320(16) Å], resulting in the distorted octahedral geometry. The Cd(II) units are further linked together by 1,3,5-BTC3− and L ligands to afford a 2D structure. If the Cd(II) cations are defined as 4-connected nodes, whereas 1,3,5-BTC3− and L ligands as 3-connected nodes, the structure of complex 3 can be regarded as a 3,4-connected 2D net with the (42·124)3(43)4-3,4L129 topology, Fig. 4(b).A structural comparison of complexes 1–3 demonstrates that the length and shape of the polycarboxylate ligands, 1,4-BDC2−, 4,4′-BDC2− and 1,3,5-BTC3−, play important roles in determining the structural diversity of the Cd(II) CPs supported by the C3 symmetry-imposed L ligand.
Ligand conformations, bonding modes and structural types
Based on the descriptor for the bpba ligand, cis and trans conformations can be shown if the two adjacent C![[double bond, length as m-dash]](https://www.rsc.org/images/entities/char_e001.gif) O groups are in the same and the opposite direction, respectively.14 Because of the different orientations adopted by the pyridyl nitrogen atoms and the amide oxygen atoms, more conformations, such as anti–anti–anti, anti–anti–syn, anti–syn–syn and syn–syn–syn, can be expressed for the L ligand. Accordingly, the L ligand conformations of 1–3 are listed in Table 2. Moreover, the L ligands in 1–3 bridge three, two and three metal ions, respectively, through the pyridyl nitrogen atoms, leaving one of the pyridyl nitrogen atoms in 2 uncoordinated. Table 2 also indicates that various coordination modes for the polycarboxylate ligands in 1–3 are observed and the polycarboxylate ligands bridge two to four metal ions.
O groups are in the same and the opposite direction, respectively.14 Because of the different orientations adopted by the pyridyl nitrogen atoms and the amide oxygen atoms, more conformations, such as anti–anti–anti, anti–anti–syn, anti–syn–syn and syn–syn–syn, can be expressed for the L ligand. Accordingly, the L ligand conformations of 1–3 are listed in Table 2. Moreover, the L ligands in 1–3 bridge three, two and three metal ions, respectively, through the pyridyl nitrogen atoms, leaving one of the pyridyl nitrogen atoms in 2 uncoordinated. Table 2 also indicates that various coordination modes for the polycarboxylate ligands in 1–3 are observed and the polycarboxylate ligands bridge two to four metal ions.
It is worthy of note that the two topological types of 1 and 3, (3·82)2(32·4)2(36·44·52·84·96·105·11) and (42·124)3(43)4-3,4L129, respectively, are in marked contrast to those reported for the bpba-based CPs, indicating that the use of the C3 symmetrical L may afford CPs with diverse topologies.
Powder X-ray analysis and thermal properties
In order to check the bulk purities of the products, powder X-ray diffraction (PXRD) experiments have been carried out for all complexes. As shown in Fig. S4 and S5,† the peak positions of the experimental and simulated PXRD patterns are in agreement with each other, which demonstrate that the crystal structures of 1 and 2 are truly representative of the bulk materials. However, there is a subtle difference between experimental and simulated PXRD patterns around 2θ = 16.2° for 3, Fig. S6,† probably indicating the existence of unresolved impurity. Thermal gravimetric analysis (TGA) was carried out to examine the thermal decomposition of all complexes. The sample data were recorded from 30 to 800 °C at 10 °C min−1 under a N2 atmosphere, as shown in Table 3 and Fig. S7–S9.† The results indicate two-step weight losses involving the removal of solvents and the loss of organic ligands for the three complexes and the starting temperatures for the decomposition of the frameworks are in the range 300–320 °C.| Weight loss of solvent, T, °C (found/calc), % | Weight loss of ligand, T, °C (found/calc), % | |
|---|---|---|
| 1 | 4H2O 30–200 (6.91/6.51) | L + 2 (1,4-BDC2−) 320–900 (73.50/75.71) |
| 2 | 2H2O 30–150 (4.14/4.23) | L + (4,4′-BDC2−) 320–800 (83.16/83.60) |
| 3 | 21H2O 30–250 (17.17/18.07) | 2L + 2 (1,3,5-BTC3−) 300–800 (66.50/66.05) |
Chemical stability
Complexes 1 and 2 were immersed in different organic solvents for 7 days to study the chemical stability. The results showed that all the complexes were stable in the solvents, except that complexes 1 and 2 would collapse in DMF, as shown in Fig. S10 and S11.†Luminescence properties
The CPs with d10 metal centers have the ability to enhance, shift, and quench the emissions of organic ligands, which are of great interest due to the potential applications of these CPs in areas such as sensors and displays. Table 4 summarizes the luminescence properties of complexes 1 and 2 and L, 1,4-H2BDC and 4,4′-H2BDC, whereas Fig. S12–S16† depict the corresponding solid-state excitation/emission spectra. The spectra of L, 1,4-H2BDC, and 4,4′-H2BDC show emissions in the range of 330–400 nm, which may be ascribed to the intraligand (IL) n to π* or π to π* transitions. The red shifts of 1 and 2 with respect to the free organic ligands can be ascribed to the different ligand conformations and coordination modes adopted by the organic ligands and the formation of different structural types. It is well known that the Cd(II) ions are hardly susceptible to oxidation or reduction. It is thus not probable that the luminescence of 1 and 2 are due to ligand-to-metal charge transfer (LMCT) or metal-to-ligand charge transfer (MLCT). Therefore, these luminescence may be attributed to intraligand or ligand-to-ligand charge transfer (LLCT).23| Compound | λ ex (nm) | λ em (nm) | Complex | λ ex (nm) | λ em (nm) |
|---|---|---|---|---|---|
| L | 290 | 330 | 1 | 322 | 340, 380 |
| 1,4-H2BDC | 331 | 380 | 2 | 325 | 357, 400 |
| 4,4′-H2BDC | 340 | 400 |
Metal cation detection
In order to explore the potential applications of 1 and 2, which show better yields and easier preparation than 3, in luminescence sensing of metal cations, 60 mg samples of 1 and 2 were immersed into 10 mL different aqueous solutions of Fe(NO3)3 and M(OAc)2 (M = Fe2+, Co2+, Ni2+, Cu2+, Zn2+) with a concentration of 1 × 10⁻² M under room temperature. After 12 hours, the solids were filtered and then the solid-state emission spectra were measured at room temperature. As shown in Fig. 5, S17 and S18,† remarkable luminescence quenching of about 89% for 1 and 90% for 2 were found in the detection of Fe3+ ions, based on the emissions at 340 and 357 nm, respectively.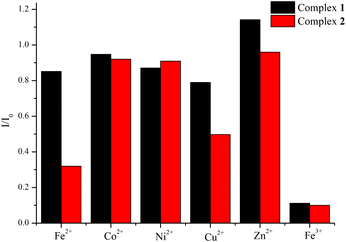 | ||
| Fig. 5 Bar diagrams showing the emission intensities of 1 and 2 immersed in the solutions of the various cations. | ||
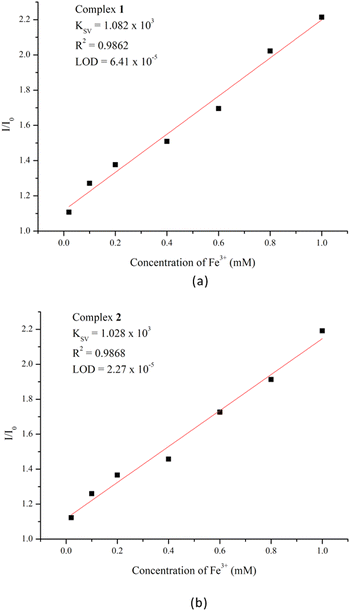
To further explore the quenching effect of Fe3+ ions, sensing dependence of luminescence intensity on the concentration of Fe3+ was investigated by immersing samples of 1 and 2 into Fe3+ aqueous solutions with various concentrations (1 × 10⁻²–1 × 10⁻⁶ M). Fig. S19 and S20† indicate that the emission intensities were getting lower and almost completely quenched upon increasing the concentration of Fe3+. Quantitatively, the quenching capacity of Fe3+ ion can be rationalized by the Stern–Volmer equation: I0/I = 1 + Ksv × [Q], where [Q] is the concentration of Fe3+, Ksv is the quenching constant and I0 and I are the emission intensities in the absence and presence of Fe3+, respectively.24 As demonstrated in Fig. 6(a) and (b), the titration curves for Fe3+ ions in 1 and 2 are virtually linear at low concentrations, giving the linear correlation coefficients (R2) of 0.9862 and 0.9868 and Ksv values of 1.082 × 10³ for 1 and 1.028 × 10³ M−1 for 2, respectively. Furthermore, the detection limits were calculated according to the standard equation 3σ/k, where σ is the standard deviation from the blank measurements and k is the absolute value of the calibration curve at lower concentration, giving 6.41 × 10⁻⁵ and 2.27 × 10⁻⁵ M for 1 and 2, respectively. Further, to determine the recyclability of Fe3+ adsorption in complexes 1 and 2, their luminescence sensing abilities were explored for five regeneration cycles. The PXRD patterns in Fig. S21 and S22† indicate that the main diffraction peaks of 1 and 2 are quite identical with those of the Fe3+-treated samples, suggesting that their frameworks remain rigid for five cycles.
To explore the possible factors that govern the quenching of the luminescence of 1 and 2 by Fe3+, the PXRD patterns of complexes 1 and 2 after treatment with metal ions were measured. As shown in Fig. S23 and S24,† the PXRD patterns of the complexes before and after the sensing experiment are in good agreement. Therefore, their fluorescence quenching is not subject to the framework collapse.25 The UV-vis absorption spectrum of Fe3+ in aqueous solution and the corresponding excitation and emission spectra of complexes 1 and 2 are shown in Fig. S25.† Partial overlaps between the absorption spectrum of the Fe3+ ion and the excitation spectra of 1 and 2 are observed, indicating that the luminescence quenching of 1 and 2 by Fe3+ can most probably be ascribed to competitive energy absorption.25 Energy dispersive X-ray (EDX) analysis of complexes 1 and 2 was performed after Fe3+ adsorption, as shown in Fig. S26 and S27,† confirming the Fe3+ uptakes of 1 and 2.
IR spectra of 1 and 2 before and after the sensing experiments are shown in Fig. S28 and S29,† exhibiting significant changes in the region between 3800 and 3500 cm−1, which can be ascribed to the O–H and N–H bond stretching.26 The changes possibly indicate the formation of weak interactions between the complexes and Fe(NO3)3 through O–H⋯O and N–H⋯O hydrogen bonds to the oxygen atoms of the nitrate anions. Furthermore, significant changes in the range between 1750 and 1500 cm−1 assignable to the stretching ν(C![[double bond, length as m-dash]](https://www.rsc.org/images/entities/char_e001.gif) O) of the polycarboxylate and L ligands can also be observed, which are most probably due to the formation of C
O) of the polycarboxylate and L ligands can also be observed, which are most probably due to the formation of C![[double bond, length as m-dash]](https://www.rsc.org/images/entities/char_e001.gif) O⋯Fe3+ interactions.5 Moreover, XPS measurement has been performed to examine the possible weak interaction between Fe3+ and the uncoordinated pyridyl nitrogen atom of 2. As shown in Fig. S30,† the binding energy of nitrogen atom in the XPS patterns before and after the addition of Fe3+ to 2 are quite similar, probably indicating that there is no or unresolvable interactions between these two atoms.
O⋯Fe3+ interactions.5 Moreover, XPS measurement has been performed to examine the possible weak interaction between Fe3+ and the uncoordinated pyridyl nitrogen atom of 2. As shown in Fig. S30,† the binding energy of nitrogen atom in the XPS patterns before and after the addition of Fe3+ to 2 are quite similar, probably indicating that there is no or unresolvable interactions between these two atoms.
In contrast, the Ksv values of the bpba-based Zn(II) CPs toward the detection of Fe3+ ion are 1.9 × 10⁴ M−1 for {[Zn2(L1)(1,4-NDC)2]·2H2O}n [L1 = 4,4′-oxybis(N-(pyridin-3-ylmethyl)benzamide); 1,4-H2NDC = naphthalene-1,4-dicarboxylic acid],5 6.895 × 10⁵ M−1 for [Zn(L2)(1,4-NDC)·H2O]n [L2 = 4,4-oxybis(N-(pyridine-4-yl)-benzamide)],27 and 1.89 × 10³ M−1 for {[Zn(L3)0.5(1,2,4,5-BTEC)0.5(H2O)]·H2O}n [L3 = N,N′-bis(3-pyridylmethyl)adipoamide; 1,2,4,5-H4BTEC = 1,2,4,5-benzenetetracarboxylic acid],28 indicating that the metal and ligand identities and structural type are important in determining the sensing effect of the bpba-based CPs toward the detection of Fe3+.
Competitive sensing experiments in the presence of the other cations have been carried out to investigate the roles of the various cations in determining the quenching effect of the Fe3+ cation on the luminescence of complexes 1 and 2. The results, as shown in Fig. S31,† indicate that these interfering cations are not important in affecting the quenching ability of the Fe3+ cation, confirming that 1 and 2 show good selectivity toward the detection of Fe3+ ions.
Gas adsorption
The solvent accessible volumes of complexes 1 and 2, calculated by the PLATON program, are 3.60% and 2.60% of the unit cell volume. Low pressure N2 adsorption measurements were performed on complexes 1 and 2 at 77 K, as shown in Fig. S32 and S33.† BET surface areas of 1 and 2 are 9.73 and 8.09 m2 g−1 respectively. Also, pore-size distribution curves show that the pore sizes of 1 and 2 are 9.99 and 9.02 nm respectively. The similar solvent accessible volumes, BET surface areas and pore sizes may confirm the comparable Ksv values of 1.082 × 10³ and 1.028 × 10³ M−1 for 1 and 2, respectively, probably indicating that the 2D layer structures of 1 and 2 govern the sensing effect. On the other hand, complexes 1 and 2 were heated under vacuum for two hours and then immersed into water for two hours to verify their chemical stabilities upon desolvation. The PXRD patterns of 1 and 2 after N2 adsorption were also evaluated. Fig. S34 and S35† demonstrate that complexes 1 and 2 remain intact upon desolvation and N2 adsorption.Conclusions
Three new Cd(II) CPs constructed from the tris-pyridyl-tris-amide ligand and polycarboxylic acids have been accomplished successfully under hydrothermal reactions, displaying 2D layers with the (3·82)2(32·4)2(36·44·52·84·96·105·11), (44·62)-sql, and (42·124)3(43)4-3,4L129 topologies, respectively. While the C3-symmetrical L determines the dimension of the CPs thus prepared, the polycarboxylate ligands trim the structural diversity, presumably due to their different lengths and shapes. Moreover, complexes 1 and 2 show efficient detection toward Fe3+ ions with high selectivity and recyclability, and their quenching behaviors can be attributed to the competitions of the absorbed energies through the weak interactions between the complexes and Fe(NO3)3.Author contributions
Investigation, C.-L. C.; data curation, S.-W. W. and S.-Y. Z.; review and supervision, J.-D. C. All authors have read and agreed to the published version of the manuscript.Conflicts of interest
There are no conflicts to declare.Acknowledgements
We are grateful to the National Science and Technology Council of the Republic of China for support.References
- S. R. Batten, N. R. Champness, X.-M. Chen, J. Garcia-Martinez, S. Kitagawa, L. Öhrstrom, M. O'Keeffe, M. P. Suh and J. Reedijk, Pure Appl. Chem., 2013, 85, 1715–1724 CrossRef CAS.
- D. J. Wales, J. Grand, V. P. Ting, R. D. Burke, K. J. Edler, C. R. Bowen, S. Mintova and A. D. Burrows, Chem. Soc. Rev., 2015, 44, 4290–4321 RSC.
- E. R. T. Tiekink and J. J. Vittal, Frontiers in Crystal Engineering, John Wiley & Sons, Ltd., England, 2006 Search PubMed.
- M. Li, D. Li, M. O'Keeffe and O. M. Yaghi, Chem. Rev., 2014, 114, 1343–1370 CrossRef CAS PubMed.
- X.-K. Yang, W.-T. Lee, J.-H. Hu and J.-D. Chen, CrystEngComm, 2021, 23, 4486–4493 RSC.
- S. Mondal and P. Dastidar, Cryst. Growth Des., 2020, 20, 7411–7420 CrossRef CAS.
- X. Gao, N. Chen, M. Cao, Y. Shi and Q. Zhang, Chin. J. Struct. Chem., 2022, 41, 2211110–2211116 CAS.
- X. Yan, J. Lei, Y.-P. Li, P. Zhang and Y. Wang, CrystEngComm, 2022, 24, 2264–2269 RSC.
- J.-F. Huang, Y.-H. Chen, Z.-H. Liang, S.-R. Zheng and J. Cao, Chin. J. Struct. Chem., 2022, 41, 2202073–2202078 CAS.
- H.-R. Fu, Y.-Y. Jiang, F. Wang and J. Zhang, Nanomaterials, 2021, 11, 2791 CrossRef CAS PubMed.
- S. R. Batten, S. M. Neville and D. R. Turner, Coordination Polymers: Design, Analysis and Application, Royal Society of Chemistry, Cambridge, UK, 2009 Search PubMed.
- T.-T. Liao, S.-Y. Lin and J.-D. Chen, CrystEngComm, 2023, 25, 1723–1730 RSC.
- M. Govindaraj, S.-Y. Zhong, C.-H. Lin and J.-D. Chen, Molecules, 2023, 28, 2226 CrossRef CAS PubMed.
- K. B. Thapa and J.-D. Chen, CrystEngComm, 2015, 17, 4611–4626 RSC.
- B.-C. Tzeng, T.-H. Chiu, B.-S. Chen and G.-H. Lee, Chem. – Eur. J., 2008, 14, 5237–5245 CrossRef CAS PubMed.
- J. Fan, H.-F. Zhu, T. Okamura, W.-Y. Sun, W.-X. Tang and N. Ueyama, Chem. – Eur. J., 2003, 9, 4724–4731 CrossRef CAS PubMed.
- H.-Y. Bai, S.-M. Wang, W.-Q. Fan, C.-B. Liu and G.-B. Che, Polyhedron, 2013, 50, 193–199 CrossRef CAS.
- H.-Y. Bai, W.-Q. Fan, S.-M. Wang, Y.-S. Yan and C.-B. Liu, Cryst. Res. Technol., 2014, 49, 731–735 CrossRef CAS.
- N. Shi, G. Yin, H. Li, M. Han and Z. Xu, New J. Chem., 2008, 32, 2011–2015 RSC.
- Bruker AXS, APEX2, V2008.6; SAD ABS V2008/1; SAINT+V7.60A; SHELXTL V6.14, Bruker AXS Inc., Madison, Wisconsin, USA, 2008 Search PubMed.
- G. M. Sheldrick, Crystal structure refinement with SHELXL, Acta Crystallogr., Sect. C: Struct. Chem., 2015, 71, 3–8 Search PubMed.
- V. A. Blatov, A. P. Shevchenko and D. M. Proserpio, Cryst. Growth Des., 2014, 14, 3576–3586 CrossRef CAS.
- D. Sun, Z.-H. Yan, V. A. Blatov, L. Wang and D.-F. Sun, Cryst. Growth Des., 2013, 13, 1277–1289 CrossRef CAS.
- M. H. J. Gehlen, Photochem. Photobiol., 2020, 42, 100338 CAS.
- M. Pamei and A. Puzari, Nano-Struct. Nano-Objects, 2019, 19, 100364 CrossRef CAS.
- C. A. Merlic, B. C. Fam and M. M. Miller, J. Chem. Educ., 2001, 78, 118–120 CrossRef CAS.
- V. Lakshmanan, Y.-T. Lai, X.-K. Yang, M. Govindaraj, C.-H. Lin and J.-D. Chen, Polymer, 2021, 13, 3018 CAS.
- Y.-H. Liu, T.-T. Liao, S.-Y. Lin, S.-Y. Zhong, T.-R. Chen and J.-D. Chen, Inorg. Chim. Acta, 2023, 556, 121641 CrossRef CAS.
Footnote |
| † Electronic supplementary information (ESI) available: IR spectra (Fig. S1–S3). PXRD patterns (Fig. S4–S6, S10, S11, S21–S24, S33 and S34). TGA curves (Fig. S7–S9). Emission spectra (Fig. S12–S20). UV-vis absorption spectrum (Fig. S25). EDX data (Fig. S26 and S27). IR spectra (Fig. S28 and S29). Competitive sensing experiments (Fig. S30). Nitrogen adsorption–desorption isotherm (Fig. S31 and S32). CCDC 2305026–2305028 contain the supplementary crystallographic data for this paper. For ESI and crystallographic data in CIF or other electronic format see DOI: https://doi.org/10.1039/d3ce01096a |
| This journal is © The Royal Society of Chemistry 2024 |

