 Open Access Article
Creative Commons Attribution 3.0 Unported Licence
Exploration of elastic moduli of molecular crystals via database screening by pretrained neural network potential†
Takuya
Taniguchi
 *
*
Center for Data Science, Waseda University, 1-6-1 Nishiwaseda, Shinjuku-ku, Tokyo 169-8050, Japan. E-mail: takuya.taniguchi@aoni.waseda.jp
First published on 9th January 2024
Abstract
The elastic properties of molecular crystals are important for pharmaceutical and material applications, but calculating the elastic constant tensor through theoretical computations is computationally expensive. This study evaluated the feasibility of using neural network potentials, which are noted for their lower computational cost compared to theoretical calculations, in predicting the elastic moduli of molecular crystals. The calculated elastic moduli were sufficiently consistent with experimental values, outperforming Hartree–Fock calculations. It was found that this method is precise enough for predicting the Young's modulus in specific directions via nanoindentation measurements, and relationships between the magnitude of the Young's modulus and crystal structures were also discovered. Furthermore, the database screening of elastic moduli of molecular crystals using a pretrained neural network potential suggested crystals with large and small moduli.
Introduction
The elastic constant tensor, commonly referred to as the stiffness tensor, can be used for characterizing the elastic behavior of materials. Once the components of the stiffness tensor are ascertained, mechanical properties including the bulk modulus, Young's modulus along various crystallographic axes, Poisson's ratio, and material anisotropy can be computed. The elastic modulus, a measure of a material's resistance to elastic deformation, is a crucial parameter for assessing its suitability for specific applications. For instance, engineered structures subjected to high mechanical stress necessitate materials with substantial elastic moduli, typically ranging from tens to hundreds of GPa.1 Conversely, materials intended for biocompatible applications are often polymeric in nature, exhibiting elastic moduli on the order of several to hundreds of MPa.2Molecular crystals generally have medium Young's modulus between hard and soft materials.3–5 Molecular crystals have not been the mainstream of industrial materials, but they are expected to be used in optoelectronics and actuators,6–8 and so it is significant to clarify their elastic properties. Pharmaceuticals consisting of small molecules are molecular crystals for suppressing symptoms of diseases, and elastic properties are also important because they are related to the compressibility when converting powder into tablets.9,10 Although there have been many reports in which Young's modulus in a specific direction has been measured by nanoindentation or bending tests,11–13 there have been a limited number of literature reports in which the elastic constant tensor has been experimentally determined. Spackman et al. reported that the elastic constant tensors of only 80 crystals have been determined since 1950.14 This is due to the difficulty of obtaining large-size crystals suitable for measurement and the need to determine many tensor components (21 components at maximum) due to their low symmetry compared to inorganic crystals. If the elastic constant tensors of molecular crystals can be calculated, it may be possible to develop molecular crystals with desired elastic properties. Material screening should be an effective approach to develop functional molecular crystals.
The calculation of elastic constant tensors can be conducted using density functional theory with dispersion correction (DFT-D), often augmented with Grimme's dispersion correction for molecular crystals.15–18 DFT-D calculations offer a notable advantage in calculation accuracy, of course depending on the selected basis and method. However, they are computationally intensive, making it challenging to screen large datasets efficiently. Recognizing this limitation, Spackman et al. employed the corrected small basis set Hartree–Fock method (S-HF-3c) for elasticity calculations,14 which has reduced computational cost in comparison to DFT-D. Their study provided a comprehensive comparison of experimentally determined elastic constant tensors with those obtained from S-HF-3c calculations, revealing that the elastic moduli determined by S-HF-3c were broadly close to experimental values.14 The importance of their work lies not only in highlighting the efficacy of S-HF-3c but also in establishing a publicly accessible benchmark dataset (elasticity dataset) comprising both experimental and calculated elastic tensors.
Materials informatics offers advantages in material screening, as demonstrated by machine learning-assisted research.19–21 Neural network potentials (NNPs) can approximate the relationship between material structures and potential energies with an accuracy close to that of DFT-D, provided that sufficient training data is available. Various geometric graph neural networks (GNNs), including CGCNN, SchNet, and MEGNet, have been reported.22–24 Recent NNPs are based on GNNs, and have incorporated angular information, as seen in models like TeaNet, ALIGNN, M3GNet, and CHGNet.25–29 These NNPs have been used for screening and molecular dynamics simulation, mostly for inorganic crystals and metal–organic frameworks. However, the use of NNP for predicting the properties of molecular crystals is limited, and its effectiveness remains unclear. If NNP proves to be effective, it can be utilized for the screening of molecular crystals.
In this research, the prediction accuracy of NNP for the elastic constant tensor of molecular crystals was assessed using the elasticity benchmark dataset and nanoindentation results. The pretrained NNPs available from the Atomic Simulation Environment (ASE) calculator, namely PreFerred Potential (PFP) based on TeaNet and the Crystal Hamiltonian Graph Neural Network (CHGNet), were employed.26,29 Their predictive capabilities were first evaluated using metrics associated with structure relaxation and subsequently against experimental elastic moduli. A comparison of NNP results with experimental results and theoretical calculations (DFT-D and S-HF-3c) revealed that the NNP's prediction accuracy was more akin to DFT-D than S-HF-3c. Moreover, this study inferred various moduli from a large dataset, highlighting molecular crystals with both larger and smaller moduli owing to low computation cost of NNP.
Results and discussion
Evaluation of NNPs
The benchmark dataset comprises 123 experimental elastic tensors corresponding to 80 distinct compounds. S-HF-3c calculations have been carried out for 44 compounds and DFT-D results for 11 compounds have been summarized, in the literature.14 Comprehensive details can be found in ref. 14. For comparative purposes, NNP calculations were executed on the same dataset as S-HF-3c. When multiple experimental results were reported for a single compound, the average was used for the comparison. Please note that the experimental results may include experimental error, but it is the good reference compared with calculations.To remove residual strain prior to the calculation of elastic constant tensors, the optimization of atomic coordinates and cell parameters was conducted by pretrained PFP and CHGNet models using the Broyden–Fletcher–Goldfarb–Shanno (BFGS) method,30 with a maximum of 2000 iterations and a residual force threshold at 0.02 eV Å−1. The optimized crystal structure was assessed by the relative deviation ΔV of the cell volume from the experimental volume.
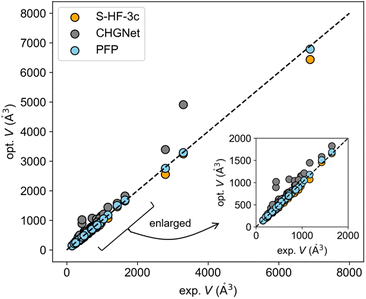
The experimental-optimized scatter plot of cell volume indicates that the volume of the structure optimized with PFP was more consistent with experimental values compared to other methods (Fig. 1). CHGNet generally overestimated the volume. S-HF-3c tended to underestimate it as pointed out in the previous literature report.14 All the optimized cell parameters using PFP and CHGNet can be found in Fig. S1 and S2.† The mean absolute error (MAE) for ΔVPFP was 2.15% (Table 1), which is lower than the 6.5% error of ΔVS-HF-3c (Table S1†).
| Dataset | MAE of ΔVPFP (%) | MAE of ΔVCHGNet (%) |
|---|---|---|
| Elasticity (n = 44) | 2.15 | 19.88 |
| X23 (n = 23) | 4.27 | 25.19 |
| Y2023 (n = 20) | 1.88 | 33.00 |
The MAE for ΔVCHGNet was 19.88% (Table 1). This considerable discrepancy is likely attributable to the training dataset. The pretrained CHGNet has been trained using crystal structures in Materials Project, which predominantly features inorganic crystals.29 Conversely, PFP has been trained using a broader dataset, encompassing both Materials Project and organic dataset.26
To further assess the NNPs, the X23 dataset—commonly employed to evaluate theoretical calculations of molecular crystals—was utilized. This dataset is composed of crystals characterized by typical intermolecular interactions: van der Waals forces and hydrogen bonds. The MAEs of ΔVPFP and ΔVCHGNet for the X23 dataset were 4.27% and 25.19%, respectively (Tables 1 and S2†). The literature reported that the MAE of ΔV was 5.2 ± 2.3% for S-HF-3c and 2.7 ± 3.2% for DFT-D (PBEh-3c).14 This result also suggested the generalization ability of PFP. Moreover, structure optimizations were conducted on molecular crystals whose papers have been published in 2023 (Y2023 dataset) to guarantee that inference data is not used for training. The resultant MAE for ΔVPFP was 1.88%, closely mirroring the MAEs of ΔVPFP in the elasticity and X23 datasets (Tables 1 and S3†). Consequently, it has been determined that the PFP is suited for molecular crystals as pretrained neural network potential.
Here, it is posited that the worse performance of CHGNet should not be inherent to its model architecture but is rather dependent on the training data. It is anticipated that CHGNet could yield better results if provided with enough training data of molecular crystals. For the model improvement, CHGNet was fine-tuned using molecular crystal data. The additional training data employed potential energies and forces calculated using PFP. This is a commonly used technique in the field of artificial intelligence known as “knowledge distillation”, which utilizes the outputs of a better model to train another model. However, even after additional training and increasing the training data to 2000 samples, no improvement in the model was observed (Fig. S3†). A possible reason for this could be the difference between the inorganic crystal in Materials Project and the molecular crystals, rendering the additional training ineffective. To resolve this, increasing the number of molecular crystal data for further training could be considered, but this would require more computational resources (GPU memory), necessitating detailed investigation in another study. Thus, the better pretrained NNP, PFP model, was used for the following analysis.
Comparison with experimental moduli
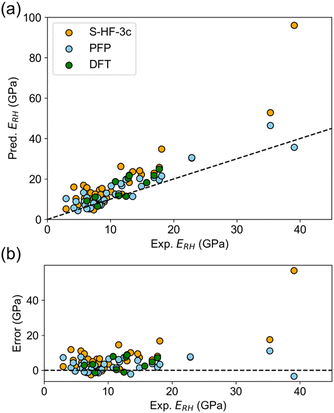
The elastic constant tensor is determined by the second-rank derivative of the potential energy, and yields values for the bulk, Young's, and shear moduli, as well as the Poisson's ratio and anisotropy. Elastic moduli can be compared using average properties, and multiple averaging schemes are available such as Voigt and Reuss schemes. The Hill averaging employs the arithmetic mean of the Voigt and Reuss averages. In addition, the arithmetic mean of the Reuss and Hill averages has been mentioned as a better approximation in the literature,14 and used in this study.The elastic properties were predicted and subsequently compared with experimental values. The error in predicting elastic properties using PFP was found to be lower than with S-HF-3c, and comparable to the error associated with DFT-D (Table 2). For instance, the MAE of ERH calculated by PFP was 3.55 GPa, which is less than that of S-HF-3c (7.53 GPa) and even DFT-D (3.87 GPa). The observed-predicted plot of ERH indicated superior predictions using PFP (Fig. 2a), with errors being distributed in an almost random fashion (Fig. 2b). There is no evident bias in PFP unlike S-HF-3c, which maintains overestimation bias (Fig. 2b). Such a trend was consistent across different averaging approaches for E and G, surpassing the MAE of the mean model, which assumes that there is no relationship between the input structure and output. Thereby it indicates a successful prediction of E and G by PFP, which should capture of the underlying relationship between crystal structure and potential energy. Observed-predicted plots of other elastic properties are summarized in Fig. S4–S6.†
| Mean model | S-HF-3c | DFT-D | PFP | |
|---|---|---|---|---|
| E: Young's modulus, K: bulk modulus, G: shear modulus, v: Poisson's ratio, A: anisotropy, and the subscript is the averaging method. | ||||
| E V (GPa) | 5.72 | 9.38 | 5.46 | 4.51 |
| E R (GPa) | 4.82 | 7.01 | 3.65 | 3.58 |
| E H (GPa) | 5.03 | 8.11 | 4.21 | 3.81 |
| E RH (GPa) | 4.88 | 7.53 | 3.87 | 3.55 |
| K V (GPa) | 4.10 | 6.30 | 3.27 | 5.32 |
| K R (GPa) | 3.10 | 6.09 | 2.70 | 5.18 |
| K H (GPa) | 3.56 | 6.18 | 2.91 | 5.25 |
| K RH (GPa) | 3.32 | 6.14 | 2.80 | 5.22 |
| G V (GPa) | 2.36 | 3.74 | 2.24 | 1.75 |
| G R (GPa) | 2.00 | 2.74 | 1.46 | 1.32 |
| G H (GPa) | 2.09 | 3.21 | 1.72 | 1.44 |
| G RH (GPa) | 2.02 | 2.96 | 1.55 | 1.32 |
| v | 0.04 | 0.04 | 0.03 | 0.05 |
| A | 0.68 | 0.52 | 0.34 | 0.58 |
The prediction of the bulk modulus K using PFP did not surpass the mean model but was still superior to S-HF-3c (Table 2). The observed-predicted plot demonstrates that the predicted values from PFP align closely with the reference line, though there seems to be a slight intercept, possibly attributed to some inherent bias (Fig. S4†). As the Poisson's ratio and anisotropy have relatively smaller values than elastic moduli, assessing prediction accuracy becomes challenging. However, the prediction errors from PFP align closely with other computational methods (Table 2).
Comparison of nanoindentation results of polymorphs
The most studied elastic property of molecular crystals is the Young's modulus along a specific direction, which can be determined from the load–displacement response curve of the crystal surface in a small area by nanoindentation.31 Moreover, in molecular crystals, polymorphs are often obtained, and the Young's moduli of polymorphs can vary even for the same molecule due to different crystal structures.32,33 If machine learning potentials are effective in predicting the results of nanoindentation of polymorphic crystals, it would be a strong motivation to use the machine learning potentials.The Young's moduli of crystal polymorphs of 8 compounds measured by nanoindentation are summarized in a literature report.32 In this nanoindentation dataset, the CSD code and indentation face are specified (Table S4†). This dataset is used as experimental data. The stiffness tensors of these crystals are calculated by PFP, and the Young's modulus in a specific direction is then calculated and compared.
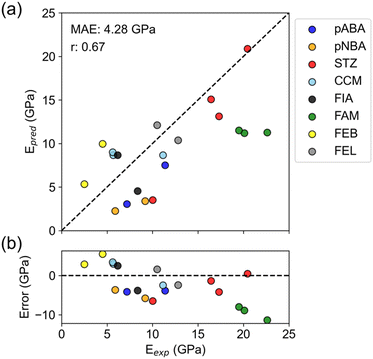
The overall correlation coefficient between experiment and prediction was 0.67, indicating that the predictions roughly reproduced experimental values (Fig. 3a and Table S4†). The prediction error, MAE = 4.28 GPa, also exceeded the mean model (MAE = 4.96 GPa), supporting positive results. Furthermore, this prediction error is about the same as the PFP prediction error in Table 2, indicating no significant difference in accuracy between predicting specific directional Young's modulus and average Young's modulus.
When focusing on individual compounds, there are some that successfully reproduced the experimental relationship between polymorphs and some that did not (Fig. 3a). Four compounds (pABA, pNBA, STZ, and FEB) successfully reproduced the large/small relationship of Young's modulus between polymorphs. For the other four compounds (CCM, FIA, FAM, and FEL), the predictions are almost the same for all polymorphs or the large/small relationship is reversed compared to the experiment.
The error plot shows that there is a slightly negative trend (Fig. 3b). Such a trend was not seen in the error plot for the average Young's modulus (Fig. 2b), so it can be said to be a characteristic of the nanoindentation results. Nanoindentation experiments are known to have varying measurements of elastic modulus depending on the shape and material of the indenter and the depth of indentation.34 Therefore, the experimental values may include the deviation from the true modulus. There might be a bias in nanoindentation, such as excessively high values for a high elastic modulus.
Relationship of Young's modulus and crystal structure
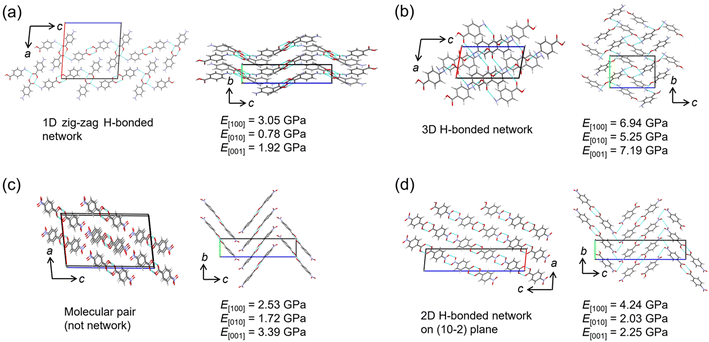
The relationship between Young's modulus and crystal structure was investigated using the nanoindentation dataset. The structures of two polymorphs each of pABA and pNBA, which were consistent with experimental results, were picked up for the comparison. In the α-form of pABA, a one-dimensional (1D) hydrogen bond chain extends along the c-axis, and the hydrogen bond chains stacked in the a-axis direction (Fig. 4a). In the b-axis direction, phenyl rings are stacked, displaying a herringbone arrangement. It is known in anthracene-based crystals that when force is applied, the crystal elastically deforms due to the change of stacking distance and angle,35,36 suggesting softness in this b-axis direction. The predicted Young's modulus results show that E[010] is the smallest, consistent with the crystal structure. The direction in which hydrogen bond chains stack has a higher Young's modulus than the direction of the chain itself (E[100] > E[001]), suggesting that not only hydrogen bonds but also the repulsion between chains increases the Young's modulus. The β-form of pABA forms a 3D hydrogen bond network and has the largest Young's modulus in any direction among the four crystals (Fig. 4b). This is consistent with the report indicating a tendency for the elastic modulus to increase with a higher number of hydrogen bonds per molecule.4In the two polymorphs of pNBA crystals, although the molecular arrangements are similar, form I has hydrogen bonded pairs without a network, while form II has a 2D hydrogen bond network on the (10−2) plane (Fig. 4c and d). Furthermore, the molecules are similarly stacked along the b-axis direction in both polymorphs, displaying a herringbone arrangement. Since the direction of such a stacking is considered to be soft, it is consistent with E[010] being the smallest Young's modulus in both polymorphs. Possibly due to the presence of a hydrogen bond network, form II has a slightly higher value. The hydrogen bond network in form II can be said to stack more in the [100] direction than in [001], making E[100] the largest among the three directions. This is consistent with the results of the α-form of the pABA crystal (Fig. 4a).
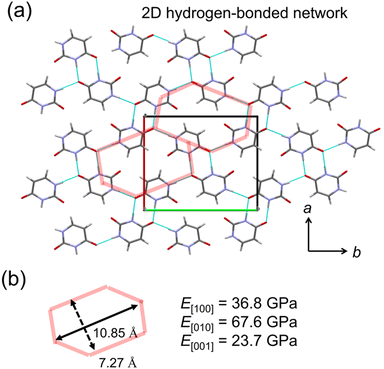
A crystal with characteristic molecular arrangements in the X23 dataset was also used for verification. The uracil crystal forms a 2D hydrogen bond network on the (001) plane (Fig. 5a). The repeating unit of this hydrogen bond network is hexagonal. Considering one hexagonal motif due to crystal symmetry, the long axis nearly along the b-axis is 10.85 Å, and the short axis nearly along the a-axis is 7.27 Å (Fig. 5b). In this motif, the long axis consists of four hydrogen bonds, while the short axis is formed by two hydrogen bonds. The calculated E[010] is about twice that of E[100], possibly reflecting this structural feature. The c-axis consists of stacking of these 2D hydrogen bond sheets, resulting in a smaller Young's modulus compared to the other two directions.
While the predicted values of Young's modulus do not exactly match the experimental values, direction-dependent Young's moduli reflected the structural features for crystals where valid results were obtained. These results suggest that the NNP adapted for molecular crystals can be utilized for predicting nanoindentation results in any direction.
Screening of Young's modulus
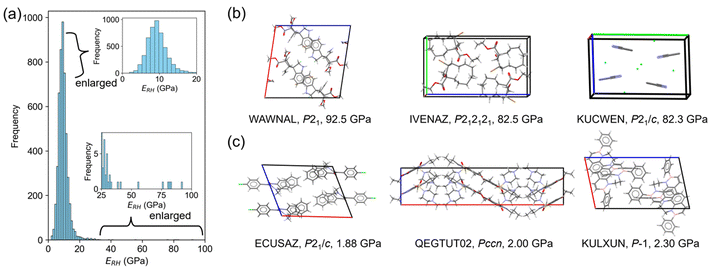
Since PFP afforded better prediction ability of elastic moduli, database screening was performed to identify molecular crystals with large and small Young's modulus. Here, the screening was focused on the average modulus ERH because the direction-dependent modulus can be calculated using the obtained stiffness tensors. 5000 crystal structures were randomly selected from the Cambridge Structural Database (CSD), after filtering under some conditions (see the Experimental section). The deviation of cell volumes of the optimized structures from experiments was sufficiently small, 1.88% (Fig. S7†). The predicted ERH is distributed with a mean of 9.60 GPa, a median of 9.17 GPa, a maximum of 92.5 GPa, and a minimum of 1.88 GPa, respectively (Fig. 6a). Other elastic properties are also summarized in Fig. S8.†Some crystal structures were visualized to find structural features from the screening. The largest ERH was found in WAWNAL (CSD refcode), which formed hydrogen-bonding chains and π–π interactions along the b-axis of a 2-fold screw axis (Fig. 6b). This result agrees with the knowledge that hydrogen bonds promote the larger Young's modulus.4 The second crystal (IVENAZ) also forms a hydrogen-bonded chain of C![[double bond, length as m-dash]](https://www.rsc.org/images/entities/char_e001.gif) O⋯H along the b-axis (Fig. 6b). The third crystal (KUCWEN) is formed by ionic bonds between C2N3− and Sr2+, which are stronger interactions than most intermolecular interactions of molecular crystals. Other high-ranking crystals also have similar interactions in common. The largest modulus by nanoindentation is reported to be 46.8 GPa,3 and thus the suggested crystals may have a larger modulus than known if measurement is conducted. Note that ERH is the average property, crystals with a higher modulus may be found when focusing on the elastic modulus along a specific direction.
O⋯H along the b-axis (Fig. 6b). The third crystal (KUCWEN) is formed by ionic bonds between C2N3− and Sr2+, which are stronger interactions than most intermolecular interactions of molecular crystals. Other high-ranking crystals also have similar interactions in common. The largest modulus by nanoindentation is reported to be 46.8 GPa,3 and thus the suggested crystals may have a larger modulus than known if measurement is conducted. Note that ERH is the average property, crystals with a higher modulus may be found when focusing on the elastic modulus along a specific direction.
The smallest predictions are located at a left tail of the distribution centered around 10 GPa, resembling a normal distribution (Fig. 6a). Molecular crystals often have weak intermolecular interactions, leading to a greater number of examples than larger Young's modulus. The smallest crystal (ECUSAZ) is formed by van der Waals interactions without evident stronger interactions (Fig. 6c). The other smallest predictions are also found in the crystals without stronger interactions such as hydrogen bonds (Fig. 6c). Since ERH is the average property, crystals with a smaller modulus may be found when focusing on the elastic modulus along a specific direction and the smallest modulus of a molecular crystal is known to be 0.27 GPa.2 When more crystals are screened by this process, other crystals with anomalous elastic properties could be found. In the future, it is expected that crystal structure prediction will be able to handle the case where the crystal structure is unknown, and that the generative model will be able to suggest unknown candidate molecules, which will also be useful in molecular crystal design.
Conclusions
In conclusion, it has been demonstrated that NNP-based predictions of elastic properties of molecular crystals achieved a higher accuracy than S-HF-3c and comparable to DFT-D. The predictive accuracy of each calculation was evaluated against benchmark datasets, confirming their validity. PFP was used to predict Young's modulus of a specific direction measured by nanoindentation, and roughly reproduced the experimental values. The database screening was then conducted to find crystals with large and small Young's modulus, suggesting crystals with a larger modulus than known. The novelty of this work should lie on the application and validation of pretrained NNP for property predictions of molecular crystals. All python codes and the screening result are supplied at https://github.com/takuyhaa/NNP-Modulus-MolecularCrystal.Experimental
Dataset curation
Elastic constant tensors of experimental, S-HF-3c, and DFT-D results are summarized in the literature.14 Crystallographic information files (CIF) assigned by identifiers were collected from the Cambridge Structural Database (CSD) and Inorganic Crystal Structure Database (ICSD). In some CIFs, hydrogen atoms were not included, and other identifier files were used as shown in Table S1.† The X23 dataset was also collected from the CSD based on the identifiers.37 The ammonia crystal was not registered in CSD, and the atomic coordinates were manually converted into CIF.38 The nanoindentation dataset was collected from the literature.32 For the inference of the large dataset, CIF files were collected from CSD (v.5.24) using CSD Python API (v.3.0.14), under the search condition: only organic, density >0, temperature is not None, 3D structure determined, R factor <10, pressure is none, and without disorder. This search extracted 111![[thin space (1/6-em)]](https://www.rsc.org/images/entities/char_2009.gif) 939 structures, and 5000 structures were randomly used to calculate the elastic constant tensors.
939 structures, and 5000 structures were randomly used to calculate the elastic constant tensors.
Structural optimization by NNP
To remove residual strain prior to the calculation of elastic constant tensors, the optimization of atomic coordinates and cell parameters was conducted by pretrained PFP (v.4.0.0) and CHGNet (v0.2.0) models using the Broyden–Fletcher–Goldfarb–Shanno (BFGS) method,30 with a maximum of 2000 iterations and a residual force threshold at 0.02 eV Å−1. PFP is commercially available through a cloud software Matlantis™ (Preferred Computation Chemistry, Inc.), and CHGNet is freely available through Python API (https://chgnet.lbl.gov/). The optimized crystal structure was assessed by the relative deviation ΔV of the cell volume from the experimental value.Finetuning of the pretrained CHGNet model was performed using the additional training data calculated by the PFP model. Crystal structures were randomly selected from 111![[thin space (1/6-em)]](https://www.rsc.org/images/entities/char_2009.gif) 939 structures extracted from the CSD at the amount of 100, 500, 1000, and 2000. Learning was performed by fixing the weights of the pretrained CHGNet's convolutional layers, basis expansion layers, and embedding layers, while allowing the weights of other layers to be adjustable.
939 structures extracted from the CSD at the amount of 100, 500, 1000, and 2000. Learning was performed by fixing the weights of the pretrained CHGNet's convolutional layers, basis expansion layers, and embedding layers, while allowing the weights of other layers to be adjustable.
Calculation of elastic properties by NNP
The elastic constants can be derived from the strain second derivatives of the crystal energy as follows,Once the elastic constant tensor is obtained, averaged elastic properties were calculated for comparison. In the Voigt averaging, it is assumed that individual grains undergo uniform strains, enabling the direct calculation of the bulk modulus (KV) and shear modulus (GV) from the stiffness matrix components, Cij. Conversely, in the Reuss averaging, grains are presumed to experience uniform stresses, and the average values, KR and GR, are derived from the inverse of the stiffness matrix, known as the compliance matrix, Sij. The Poisson's ratio (ν) and Young's modulus (E) are deduced from K and G. The Hill averaging employs the arithmetic mean of the Reuss and Voigt averages. In addition, the arithmetic mean of the Reuss and Hill averages has been mentioned as a better approximation in the literature,14 and used in this study. The calculation of each elastic modulus is summarized as follows.
(1) For K, G, and E, Voigt average yields the following formulas.
(2) Reuss average yields the following formulas.
(3) Hill average is the arithmetic mean of Voigt and Reuss values.
(4) The arithmetic mean of Reuss and Hill values is also used for good approximation.
Poisson's ratio (ν) is given by
Anisotropy (A) is given by
Author contributions
This research was conducted by Takuya Taniguchi, who is responsible for all the following roles: conceptualization, data curation, formal analysis, funding acquisition, investigation, methodology, project administration, resources, software, validation, visualization, writing – original draft, and writing – review & editing.Conflicts of interest
The author received a joint research funding from ENEOS corporation and licensed Matlantis for using the PFP model from Preferred Computational Chemistry, Inc., a joint venture of Preferred Networks, Inc. and ENEOS corporation.Acknowledgements
This study was financially supported by JSPS Grant-in-Aid (19K23638, 20H04677, and 22K14747) and the Waseda University Grant for Special Research Projects (2019C-646, 2020C-530, 2021C-404, and 2022C-313).Notes and references
- N. C. Burtch, J. Heinen, T. D. Bennett, D. Dubbeldam and M. D. Allendorf, Adv. Mater., 2018, 30, 1704124 CrossRef PubMed.
- R. Kumar, M. Kumar and J. S. Chohan, J. Manuf. Process., 2021, 64, 828–850 CrossRef.
- C. Wang and C. C. Sun, CrystEngComm, 2020, 22, 1149–1153 RSC.
- D. P. Karothu, J. Mahmoud Halabi, E. Ahmed, R. Ferreira, P. R. Spackman, M. A. Spackman and P. Naumov, Angew. Chem., 2022, 61, e202113988 CrossRef CAS PubMed.
- T. Taniguchi, T. Asahi and H. Koshima, Crystals, 2019, 9, 437 CrossRef CAS.
- T. Taniguchi, H. Sugiyama, H. Uekusa, M. Shiro, T. Asahi and H. Koshima, Nat. Commun., 2018, 9, 538 CrossRef PubMed.
- L. Catalano, D. P. Karothu, S. Schramm, E. Ahmed, R. Rezgui, T. J. Barber, A. Famulari and P. Naumov, Angew. Chem., Int. Ed., 2018, 57, 17254–17258 CrossRef CAS PubMed.
- S. Zhao, H. Yamagishi, O. Oki, Y. Ihara, N. Ichiji, A. Kubo, S. Hayashi and Y. Yamamoto, Adv. Opt. Mater., 2022, 10, 2101808 CrossRef CAS.
- V. Mazel, V. Busignies, H. Diarra and P. Tchoreloff, J. Pharm. Sci., 2012, 101, 2220–2228 CrossRef CAS PubMed.
- J. A. Bhatt, D. Bahl, K. Morris, L. L. Stevens and R. V. Haware, Eur. J. Pharm. Biopharm., 2020, 153, 23–35 CrossRef CAS PubMed.
- R. Devarapalli, S. B. Kadambi, C. T. Chen, G. R. Krishna, B. R. Kammari, M. J. Buehler, U. Ramamurty and C. M. Reddy, Chem. Mater., 2019, 31, 1391–1402 CrossRef CAS.
- T. Taniguchi, K. Ishizaki, D. Takagi, K. Nishimura, H. Shigemune, M. Kuramochi, Y. C. Sasaki, H. Koshima and T. Asahi, Commun. Chem., 2022, 5, 4 CrossRef CAS PubMed.
- K. Ishizaki, D. Takagi, T. Asahi, M. Kuramochi and T. Taniguchi, Cryst. Growth Des., 2023, 23(7), 5330–5337 CrossRef CAS.
- P. R. Spackman, A. Grosjean, S. P. Thomas, D. P. Karothu, P. Naumov and M. A. Spackman, Angew. Chem., 2022, 61, e202110716 CrossRef CAS PubMed.
- M. Brunsteiner, S. Nilsson-Lil, L. M. Morgan, A. Davis and A. Paudel, Cryst. Growth Des., 2023, 23(4), 2155–2168 CrossRef CAS.
- J. Hoja, A. M. Reilly and A. Tkatchenko, WIREs Comput. Mol. Sci., 2017, 7, e1294 CrossRef.
- I. A. Fedorov, C. V. Nguyen and A. Y. Prosekov, ACS Omega, 2020, 6, 642–648, DOI:10.1021/acsomega.0c05152.
- J. Moellmann and S. Grimme, J. Phys. Chem. C, 2014, 118, 7615–7621 CrossRef CAS.
- F. Musil, S. De, J. Yang, J. E. Campbell, G. M. Day and M. Ceriotti, Chem. Sci., 2018, 9, 1289–1300 RSC.
- D. Takagi, K. Ishizaki, T. Asahi and T. Taniguchi, Digital Discovery, 2023, 2, 1126–1133 RSC.
- T. Taniguchi, M. Hosokawa and T. Asahi, ACS Omega, 2023, 8, 39481–39489 CrossRef CAS PubMed.
- T. Xie and J. C. Grossman, Phys. Rev. Lett., 2018, 120, 145301 CrossRef CAS PubMed.
- K. T. Schütt, H. E. Sauceda, P. J. Kindermans, A. Tkatchenko and K. R. Müller, J. Chem. Phys., 2018, 148, 241722 CrossRef PubMed.
- C. Chen, W. Ye, Y. Zuo, C. Zheng and S. P. Ong, Chem. Mater., 2019, 31, 3564–3572 CrossRef CAS.
- S. Takamoto, S. Izumi and J. Li, Comput. Mater. Sci., 2022, 207, 111280 CrossRef CAS.
- S. Takamoto, C. Shinagawa and D. Motoki, et al. , Nat. Commun., 2022, 13, 2991 CrossRef CAS PubMed.
- K. Choudhary and B. DeCost, npj Comput. Mater., 2021, 7, 185 CrossRef.
- C. Chen and S. P. Ong, Nat. Comput. Sci., 2022, 2, 718–728 CrossRef PubMed.
- B. Deng, P. Zhong, K. Jun, J. Riebesell, K. Han, C. J. Bartel and G. Ceder, Nat. Mach. Intell., 2023, 5, 1031–1041 CrossRef.
- R. Fletcher, Practical Methods of Optimization, Wiley, New York, 1980, vol. 1 Search PubMed.
- S. Varughese, M. S. R. N. Kiran, U. Ramamurty and G. R. Desiraju, Angew. Chem., Int. Ed., 2013, 52, 2701–2712 CrossRef CAS PubMed.
- B. P. Gabriele, C. J. Williams, M. E. Lauer, B. Derby and A. J. Cruz-Cabeza, CrystEngComm, 2021, 23, 2027–2033 RSC.
- Y. Su, S. Bhunia, S. Xu, A. Chen, C. M. Reddy and T. Cai, Chem. Mater., 2021, 33, 4821–4829 CrossRef CAS.
- B. P. Gabriele, C. J. Williams, M. E. Lauer, B. Derby and A. J. Cruz-Cabeza, Cryst. Growth Des., 2020, 20, 5956–5966 CrossRef CAS PubMed.
- S. Hayashi, F. Ishiwari, T. Fukushima, S. Mikage, Y. Imamura, M. Tashiro and M. Katouda, Angew. Chem., Int. Ed., 2020, 59, 16195–16201 CrossRef CAS PubMed.
- M. Annadhasan, A. R. Agrawal, S. Bhunia, V. V. Pradeep, S. S. Zade, C. M. Reddy and R. Chandrasekar, Angew. Chem., Int. Ed., 2020, 59, 13852–13858 CrossRef CAS PubMed.
- A. Otero-De-La-Roza and E. R. Johnson, J. Chem. Phys., 2012, 137, 054103 CrossRef CAS PubMed.
- R. Boese, N. Niederprüm, D. Bläser, A. Maulitz, M. Y. Antipin and P. R. Mallinson, J. Phys. Chem. B, 1997, 101, 5794–5799 CrossRef CAS.
Footnote |
| † Electronic supplementary information (ESI) available. See DOI: https://doi.org/10.1039/d3ce01263h |
| This journal is © The Royal Society of Chemistry 2024 |

