 Open Access Article
Creative Commons Attribution 3.0 Unported Licence
Influence of the crystallisation solution environment on the structural pathway from solute solvation to the polymorphic forms of tolfenamic acid†
Yu
Liu
 abc,
Cai Y.
Ma
 b,
Junbo
Gong
 c and
Kevin J.
Roberts
 *b
*b
aSchool of Chemical Engineering, Shenyang University of Chemical Technology, Shenyang, China
bCentre for the Digital Design of Drug Products, School of Chemical and Process Engineering, University of Leeds, Woodhouse Lane, Leeds LS2 9JT, UK. E-mail: k.j.roberts@leeds.ac.uk
cState Key Laboratory of Chemical Engineering, Tianjin University, Tianjin, China
First published on 9th July 2024
Abstract
The influence of the solution environment on the solution crystallisation of the conformational polymorphic forms I and II of tolfenamic acid is assessed through integration of multi-scale (molecular, cluster and crystallographic) modelling with polymorphic screening using polythermal crystallisation as a function of solvent selection. Solid-state analysis reveals the contrasting crystal chemistry with the strongest synthon involving hydrogen bonding synthons and π–π van der Waals interactions for forms I and II, respectively. Analysis of the molecular conformational energies reveals molecular structures for forms I and II to be very close which is matched by their calculated lattice energies. Crystallisation as a function of both solute concentration and solution cooling rate reveals form II to be mostly more preferred than form I. The higher stability of the form II conformer together with its easier conformational adjustment during the formation of form II crystals, is consistent with its greater crystallisability compared to the more stable form I. Solute concentration analysis of the relative stabilities of the two forms as a function of their sizes reveals that smaller cluster sizes are required to stabilise the crystal structure for form I with respect to form II. Polymorphic screening as a function of solvent confirms the predicted poor crystallisability of form I whose crystallisation is preferred at higher initial solute concentrations and lower cooling rates in polar solvents but less so for the more apolar solvent toluene, the latter being consistent with π–π solute/solvent interactions promoting the formation of hydrogen bonded solute/solute synthons at the expense of π–π interactions. Modelling work correlates well with the observed crystallisation behaviour, highlighting the importance of understanding solvent selection and solution state structure at the molecular-scale level for directing polymorphic outcomes, as confirmed by the higher crystallisability of the metastable form II.
1. Introduction
Polymorphism is a widely observed phenomenon in the solution crystallisation of organic pharmaceutical compounds and one that can be a significant problem in achieving the precise control of polymorphic form which can, in turn, be crucial in terms of obtaining formulated solid drug products which have the desired physicochemical properties.1 It is well known that crystallisation process conditions, such as solution supersaturation, processing temperature, solute concentration and solvent type, can influence the assembly of molecular clusters of solute molecules whose structures can template the specific polymorph formed.2,3 Although significant progress has been made in studying crystallisation kinetics and mechanism, it can still be quite a challenge to fully understand how the kinetic aspects of the crystallisation process can direct the polymorph formation processes. Hence, studies on a diverse range of compounds are needed to characterise the molecular pathway through which the solute in its solvated state within the solution phase is transformed into the formation of solid forms with different polymorphic structures.2–4Characterisation of the structures of the solute entities at their different stages in assembly from nucleation-related clusters to crystals within the crystallisation processes can provide an effective approach to understand the influence of process conditions on polymorphic outcomes. A variety of techniques have been applied to capture both the molecular and super-molecular (synthonic) ordering within these clusters in solution prior to their crystallisation, such as Fourier transform infrared (FTIR) spectroscopy,5–7 Raman spectroscopy,8,9 Ultraviolet–visible (UV/vis) spectroscopy,10 Nuclear Magnetic Resonance (NMR) spectroscopy11–15 and X-ray scattering.5,16–20 Such knowledge can provide structural information on these clusters in terms of their constituent solvent–solute interactions, the size and shape of the solute associates and their molecular conformational distributions. Whilst the crystal structures of the materials at the micro- and macro-scales can be routinely determined using single crystal X-ray diffraction, determination of the structure and development of nano-scale clusters of solute molecules within the solution state can be much more challenging. Nonetheless, through a comparison of the molecular assembly behaviour through the different stages in the overall crystallisation process, the molecular evolution pathway associated with the creation and development of the various polymorphic forms can, in principle, be elucidated.5,7,21–23
The development of computational molecular-scale modelling has contributed significantly to the understanding of the thermodynamic properties within the solution state, especially when integrated with experimental data. A variety of molecular-scale computation methods have been successfully applied to the characterisation of the solid state and solution chemistry,2,5,16,24–41 such as ab initio quantum mechanics using density functional theory (DFT) and molecular dynamics (MD) and molecular mechanics (MM) simulations using parametrised empirical interatomic force fields. Although providing high accuracy, DFT calculations and MD simulations can make a significantly high demand on both computer power and calculation time. MM simulations based upon user-defined grid-points have though been found to be effective in identifying the most important molecular–molecular interactions within much shorter simulation times27 when compared to MD and DFT and hence can provide a suitable platform for the rapid screening of solvents within industrial processes.35
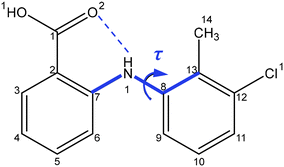
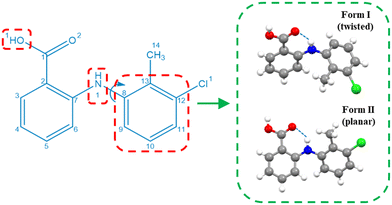
Drawing upon the above perspective, in this paper the solution-mediated nucleation pathway associated with the formation of the polymorphic forms of tolfenamic acid (TFA) is examined. TFA (Fig. 1) is a nonsteroidal anti-inflammatory drug with nine reported and closely-related conformational polymorphs.42–45 Of these, the most encountered polymorphs have been found to be forms I and II and hence these polymorphs form the focus of this study. The main differences between these two forms are reflected in the different molecular conformations within the two crystal structures which is mainly associated with differences in the torsion angle τ (C7–N1–C8–C13) rotation46 (form I: 75°, form II: 143°), as highlighted in Fig. 1, with the 3D molecular structures of both polymorphic forms being shown in Fig. 4. In this, and under ambient conditions, the stable form I contains the twisted-like molecular conformation, (hereinafter referred to as conformer I), whilst the meta-stable form II contains a more planar-like molecular conformer (hereinafter referred to as conformer II).
With its comparatively simple molecular structure and abundant polymorphic behaviour, TFA has proved to be an attractive model drug compound for studying polymorphism and its control through crystallisation processes, notably for examining the link between the solution state and the resultant crystal structure. Li and coauthors6,11,47,48 who have made an intensive study of TFA forms I and II and have surprisingly concluded that the stable form I can be crystallised at high supersaturations with the metastable form II being the preferred solid form at low supersaturations.6 Mindful of this apparent contradiction to Ostwald's rule of stages,49 solution chemistry studies of TFA using NMR and UV/vis spectroscopy combined with molecular modelling6,11,47,48 revealed TFA molecules to mainly exist as form II conformer monomers in ethanolic solutions at low concentrations whereas the hydrogen-bonding (HB) dimers of the form I conformers were found to be present at the higher solute concentrations, consistent with the observed crystallisation behaviour at different concentrations. Despite this, Du et al.50 could find no evidence for the formation of HB dimers in ethanol solution either through solution infrared (IR) spectroscopy studies or through related molecular simulations. Repeated fast-cooling crystallisation experiments50 also seemed to exhibit contrasting results, i.e. the metastable crystal form II was found to be more favoured at high supersaturations, which is more consistent with Ostwald's rule.49 Tang et al.51 further investigated the solution chemistry of TFA using IR spectroscopy and NMR concluding that TFA molecules exist as solvated monomers in ethanol and dimethylformamide, whilst they can form HB dimers in toluene where solute/solvent HB interactions would not be feasible. Whilst these studies concluded that the molecular conformation of TFA in its solution state would appear to be mainly the planar one associated with form II, nonetheless strong solvent–solute interactions were found to increase the proportion of the twisted conformer associated with form I, in particular for ethanol and dimethylformamide. Previous studies on the crystallisability of the polymorphic forms of TFA have been quite limited to date. Liu et al.32 studied the nucleation kinetics of form II as a function of solvent type confirming a progressive nucleation mechanism together with finding strong correlation between solvation strength and nucleation behaviour with the higher solubility hydrogen bonding protic solvents exhibiting lower crystallisability. Related studies on form I crystallisability have not yet appeared in the literature. Detailed studies of the concomitant crystallisation behaviour of TFA23,52 have further indicated that polymorphic outcomes post-crystallisation can depend on both the solution temperature and solute concentration. Overall, the TFA crystallisation studies to date have concluded that the correlation between nucleation and solution chemistry is strongly influenced by both the strength and directivity associated with the solvation process.
Given that the structural mechanism at the molecular-scale that underpins the linkage between processing conditions and their resultant polymorphic outcomes continue to remain somewhat unclear, further studies are clearly needed. Hence, in this study, the structural pathway from the solvated molecular state through to the crystallisation of either forms I and II has been examined through an integrated (molecule to cluster to crystal) study encompassing both experimental and computational molecular-scale modelling. In this, the molecular conformational and polarisability differences between the molecules present in the form I and form II crystal structures have been examined together with detailed molecular-scale modelling of solute solvation as a function of solvent type. This has been complemented by crystallographic analysis of the TFA crystal chemistry including determination of the energetics of intermolecular interactions in the solid-state. In addition, cluster modelling of solute cluster evolution as a function of their size has been used to examine the relative stability and conformational variability of these two forms at sizes commensurated with the cluster size scales expected in the early stages of the crystallisation process post nucleation. These modelling studies have then been integrated with batch cooling crystallisation experiments carried out under different crystallisation conditions, notably including variations in solvent type, initial solute concentration and solution cooling rate in order to characterise the effects of the solution crystallisation environment on the resultant formation of the two polymorphic forms.
2. Materials and methods
The overall workflow for the work described here is given in Fig. 2 which summarises the methodology and purpose within the structural pathway encompassing molecular-scale modelling and polymorphic screening in different solvents for TFA forms I and II outcomes as a function of crystallisation environment.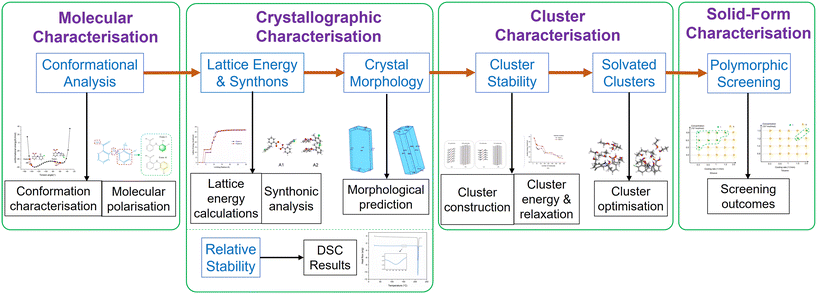 | ||
| Fig. 2 Structural pathway workflow encompassing molecular-scale modelling and experimental studies of polymorphic screening as a function of solution environment. | ||
2.1 Materials
Tolfenamic acid (>99%), form I, was obtained from Fluorochem Ltd. Form II samples were obtained through recrystallisation with the form obtained being confirmed by powder X-ray diffraction. All solvents (ethanol, methanol, toluene and acetonitrile) were of analytical grade and were purchased from ThermoFisher. All chemicals were used without further purification.The molecular and crystal structures of TFA form I (ref. code: KAXXAI01 (ref. 42)) and form II (ref. code: KAXXAI42) were obtained from the Cambridge Structural Database.53 The crystallographic parameters with some crystal properties of forms I and II are listed in Table 1.
| Form I42 | Form II42 | |
|---|---|---|
| a (Å) | 4.826(2) | 3.836(2) |
| b (Å) | 32.128(11) | 21.997(5) |
| c (Å) | 8.041(4) | 14.205(7) |
| α (°) | 90 | 90 |
| β (°) | 104.88(3) | 91.939(4) |
| γ (°) | 90 | 90 |
| V (A−3) | 1204.95 | 1195.54 |
| Space group | P21/c | P21/n |
| Z | 4 | 4 |
| Z′ | 1 | 1 |
| Molecular weight (g mol−1) | 261.70 | 261.70 |
| Number of HB donors | 2 | 2 |
| Number of HB acceptors | 4 | 4 |
| Number of rotatable bonds | 5 | 5 |
| Density (g cm−3) | 1.443this study | 1.454this study |
| Void space (%) | 26.9this study | 24.9this study |
| Packing coefficient | 0.708this study | 0.719this study |
2.2 Experimental methods
The standard FTIR spectra for forms I and II are given in Fig. S1 in ESI† evidencing different characteristic peaks for the two forms. All the FTIR spectral data were collected at ambient temperature with a resolution value of 4 cm−1, scan time of 64, and wavenumbers ranging from 400 to 4000 cm−1. Typical spectra of forms I and II exhibited obvious differences in the peak positions (see Fig. S1 (ESI†)) which were used to distinguish between the two polymorphic forms in the analysis of the filtered crystals.
The differences in the colours of the polymorphs were also used as a further aid to confirm the phase transformation time (form II: yellow crystals, form I: white crystals).
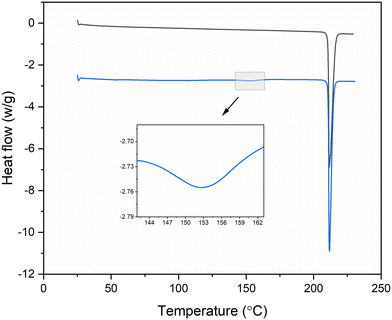
Thermal analysis of form I and form II were carried out using DSC to characterise the melting properties and thermal stability of the samples. The measurement was carried out with 5–10 mg samples at a heating rate of 10 °C min−1 from 25 to 250 °C under nitrogen purge. The melting point and enthalpy of melting were determined by Mettler Stare software v10.00.54
Polythermal crystallisation experiments were carried out using the Technobis Crystal 1655 platform with the vials individually calibrated with respect to the desired set-point. The crystallisation and dissolution on-sets points during temperature cycling were detected by optical turbidity. The solutions were initially held at 50 °C for 1 hour and then cooled at set cooling rates (0.3, 0.5, 1.0, 1.5, and 2.0 °C min−1) and agitated by constant magnetic stirring at a rate of 700 rpm with each experiment being repeated 16 times. The crystals produced were filtered immediately after formation, and when the optical turbidity decreased within the solution, i.e. consistent with the solid-forms being produced in the polythermal experiments being the result of their direct formation by crystallisation and not from any polymorphic phase transformations.
![[thin space (1/6-em)]](https://www.rsc.org/images/entities/char_2009.gif) :
:![[thin space (1/6-em)]](https://www.rsc.org/images/entities/char_2009.gif) 1) were added to the 10 ml prepared TFA saturated solutions at given temperatures. Vials of the suspensions were then placed within a temperature controlled shaker which was set to an agitation rate of 400 rpm at temperatures of 5, 20 and 40 °C. The suspensions were examined and analysed every 10 minutes to detect any phase transformation behaviour through filtering a 1 ml suspension for FTIR characterisation. Note that the polymorphic form transformation happened under solution-mediated conditions in slurries.
1) were added to the 10 ml prepared TFA saturated solutions at given temperatures. Vials of the suspensions were then placed within a temperature controlled shaker which was set to an agitation rate of 400 rpm at temperatures of 5, 20 and 40 °C. The suspensions were examined and analysed every 10 minutes to detect any phase transformation behaviour through filtering a 1 ml suspension for FTIR characterisation. Note that the polymorphic form transformation happened under solution-mediated conditions in slurries.
2.3 Computational molecular modelling
The conformational energy of the isolated molecules present within the two polymorphs were calculated in the gas phase by ab initio methods using Gaussian09.59 The single point conformation energies were calculated at the density functional theory level using the 6-311G* basis set and B3LYP dispersion-corrected exchange correlation function. The deformation energetics were calculated through a comparison between the molecular conformation energy present in the crystal structure with that of the optimised free molecule conformation.
 | (1) |
![[thin space (1/6-em)]](https://www.rsc.org/images/entities/char_2009.gif) 866
866![[thin space (1/6-em)]](https://www.rsc.org/images/entities/char_2009.gif) 048 data points encompassing the location and rotation for each simulation.
048 data points encompassing the location and rotation for each simulation.
Subsequently, solvation shell clusters were built by the successive addition of solvent probe molecules whereby the substrate incorporates a probe molecule as located at the highest interaction energy configuration with the molecular pair of substrate and probe molecules becoming the new fixed target for the subsequent probe to find the lowest-energy site, and so on with the process being repeated until an overall solvated solute structural cluster was built up. In this study, a maximum of 10 solvent molecules were used as successive probes with each solute substrate molecule. The resultant clusters were optimised and the cluster energies were calculated using the Forcite module in Material Studio56 with its Gasteiger atomic point charges.57,58 In some cases, where the addition of a further probe molecule simply resulted in probe–probe interactions rather than substrate–probe interactions, such interactions were disregarded and the final set of the solvation energies were normalised and ranked with respect to the final substrate/probe coordination number.32
Note that, for the widely used HABIT98 (ref. 63 and 64) and SystSearch,27,29 Dreiding forcefield65 and MOPAC charge approach66 were used to calculate the intermolecular pair interaction energies for the two TFA forms. The COMPASS II forcefield with Gasteiger57,58 partial atomic charges, was utilised for calculations with Materials Studio56 as MOPAC is not available. Although the different selections may lead to slightly different values calculated, the analysis and conclusions based on these calculated results are expected not to be changed as discussed in literature (e.g. ref. 60).
3. Results and discussion
3.1 Molecular properties
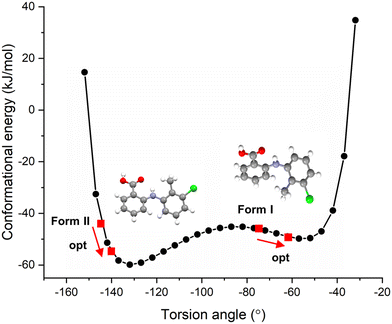
The resultant molecular conformational potential energy of TFA as a function of the torsion angle τ is given in Fig. 3, revealing that the conformers present in both the forms I and II structures were located quite close to two local minima positions. The conformer in form II was found to be more stable than that of form I with a lower potential energy which was also found to be much closer to the global minimum conformation energy for an isolated molecule of TFA. However, it is noteworthy that there was not a significantly high energetic barrier between these two conformers consistent with their known concomitant polymorphic behaviour and comparably easy interconversion.23,32,52 The deformation energies (ΔEconf) for the two forms, given in Table 2, highlight the conformation adjustments that would be expected to be needed to ensure efficient intermolecular close packing within the solid-state. This indicated that the molecule to crystal pathway associated with crystallisation might be expected to be slightly harder for form I when compared to form II. Note that the conformer II with optimised structure was found to be more stable in gas phase based on the calculations using different level of theory though form I indeed exhibits slightly lower conformation energy due to its higher deformation energy when forming a crystal.
| Conformation energy, Econf (kcal mol−1) | Deformation energy, ΔEconf (kcal mol−1) | |
|---|---|---|
| Conformer in form I crystal structures | −756![[thin space (1/6-em)]](https://www.rsc.org/images/entities/char_2009.gif) 565.99 565.99 |
−8.54 |
| Optimised conformer I | −756![[thin space (1/6-em)]](https://www.rsc.org/images/entities/char_2009.gif) 557.45 557.45 |
|
| Conformer in form II crystal structures | −756![[thin space (1/6-em)]](https://www.rsc.org/images/entities/char_2009.gif) 564.97 564.97 |
−7.75 |
| Optimised conformer II | −756![[thin space (1/6-em)]](https://www.rsc.org/images/entities/char_2009.gif) 557.21 557.21 |
3.2 Solid-state properties
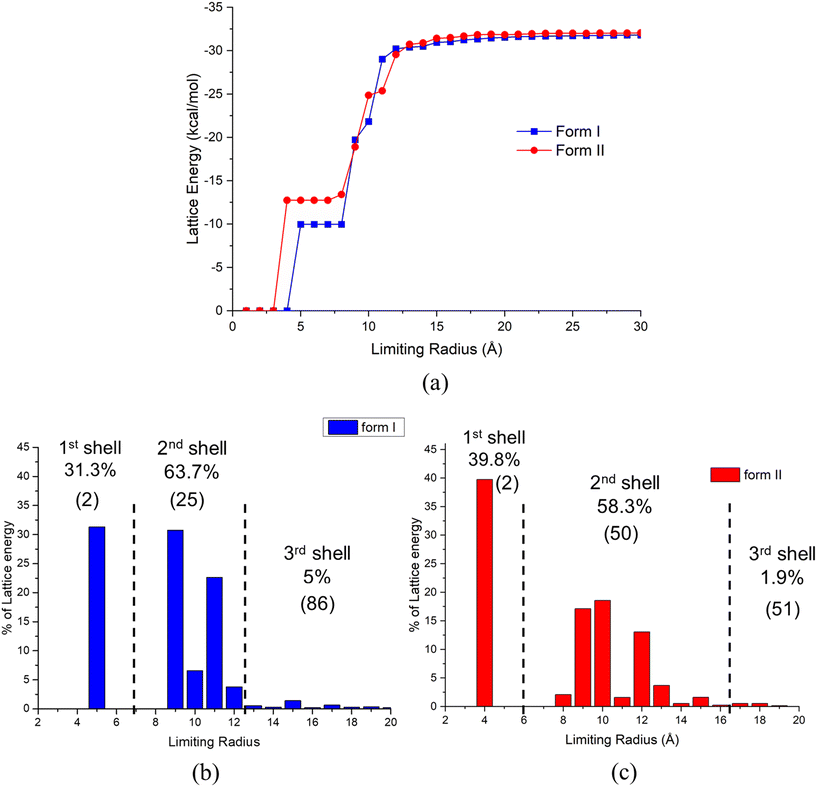
The first, second and third shells associated with the intermolecular clustering were found to have 2, 25 and 86, and 2, 50 and 51 molecules, respectively, with their energetic contributions to the lattice energy being 31.3%, 63.7% and 5.0%, and 39.8%, 58.3% and 1.9%, for forms I and II, respectively. As shown in Fig. 6(c), form II starts to form its first shell of intermolecular clustering at a smaller size (3 Å) and higher cluster energy than that for the form I clusters. With the increase of cluster size, the form I cluster energies were found to increase rapidly when forming its second shell, gradually exceeding that for form II. The final shell for form I was found to makes a 5% contribution to its overall lattice energy, while form II was only found to contribute 1.9%. Overall, form I was found to converge at a shorter radial distance (12 Å) when compared to form II, consistent with form II generating stable nucleation clusters at smaller first shell sizes than for form I but with the situation reverses for the second shell where form I forms at smaller sizes.
Overall, the data analysis might suggest that variation of solution supersaturation might enable the crystallisation conditions to be manipulated in order to produce smaller cluster sizes, i.e. at the higher supersaturations, to control the polymorphic form outcomes. In this, the solubility and crystallisability within a given solvent system could be expected to play an important role as solutions with wider metastable zone widths will potentially generate higher supersaturations. The closeness in these energies, though, is indicative of the challenge regarding single polymorph isolation and hence would be highly consistent with TFA's observed concomitant polymorphic behaviour.
| Type | Form I | Form II | Percentage contribution to lattice energy % | |
|---|---|---|---|---|
| Form I | Form II | |||
| vdW (kcal mol−1) | −22.51 | −24.44 | 70.79 | 76.26 |
| Coulombic forces (kcal mol−1) | −3.63 | −1.76 | 11.41 | 5.49 |
| H-bond (kcal mol−1) | −5.66 | −5.85 | 17.80 | 18.25 |
| Lattice energy (kcal mol−1) | −31.80 | −32.05 | 100.00 | 100.00 |
Examination of the relative contributions of the different molecular functional groups to the lattice energies of the two forms is also provided in Fig. S2 (ESI†). Examination of this reveals no significant differences between the energetic contributions between forms I and II for any of the functional groups in the TFA molecule. Further details can be found in Section S5 (ESI†).
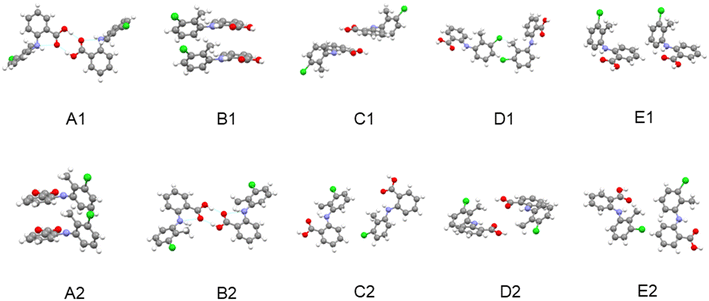 | ||
| Fig. 7 The intermolecular structural arrangements for dimer pairs of the top five strongest synthons of TFA form I (A1–E1) and form II (A2–E2). | ||
| Form | Synthon | Dispersive energy (kcal mol−1) | Columbic energy (kcal mol−1) | Total energy (kcal mol−1) | Contribution to the lattice energy % | Intermolecular interaction type |
|---|---|---|---|---|---|---|
| I | A1 | −2.23 | −2.76 | −4.99 | 15.69 | H-bond |
| B1 | −4.93 | −0.06 | −4.98 | 15.66 | π⋯π | |
| C1 | −2.34 | 0.48 | −1.86 | 5.85 | vdW | |
| D1 | −1.38 | 0.01 | −1.37 | 4.31 | vdW | |
| E1 | 1.06 | −0.19 | −1.25 | 3.93 | vdW | |
| II | A2 | −7.27 | 0.9 | −6.37 | 19.88 | π⋯π |
| B2 | −2.26 | −2.9 | −5.16 | 16.1 | H-bond | |
| C2 | −1.2 | −0.23 | −1.43 | 4.46 | vdW | |
| D2 | −1.08 | 0.17 | −0.91 | 2.84 | vdW | |
| E2 | −0.92 | 0.06 | −0.86 | 2.68 | vdW |
Comparing the synthons in forms I and II reveal that both the strengths of the shorter range hydrogen bonding synthons and benzene ring stacking interactions in form II are higher than those in form I. However, in contrast the longer range vdW interactions were found to be stronger in form I compared to form II. These differences may reflect form II's planar molecular conformation within the crystal structure being more conducive to the efficient stacking of aromatic rings in the initial stages of cluster formation. This would also be consistent with the denser intermolecular packing of this form as well as its tendency to nucleate at higher supersaturations, i.e. smaller cluster sizes. In contrast, as the cluster size increases the longer range vdW contributions provide a more favourable environment for the nucleation and growth of the twisted conformers within the stable form I structure and its associated transformation from form II.
3.3 Molecular solute cluster evolution
| Crystal form | Molecular numbers in a cluster | VAR |
|---|---|---|
| Form I | 12 | 15.69 |
| 54 | 7.81 | |
| 108 | 11.84 | |
| 374 | 8.67 | |
| Form II | 11 | 2.01 |
| 50 | 2.26 | |
| 114 | 1.15 | |
| 354 | 2.85 |
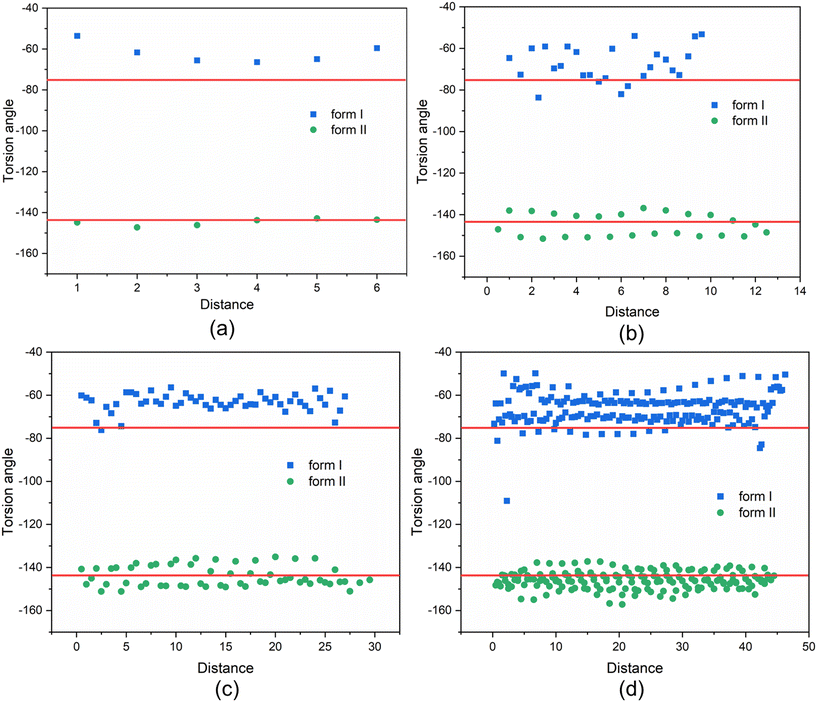
The above analysis is supported by the calculated VAR values for the clusters of forms I and II at four cluster sizes, given in Table 5. In this, with the increase of cluster size, the torsion angle difference between facetted clusters with those found in the bulk crystal structure were found to gradually decrease for form I whilst no obvious changes were observed for the form II clusters. Overall, for the same cluster size, a larger conformational change was encompassed within the molecular assembly process for form I compared to form II, consistent with higher crystallisability for form II.
3.4 Solute solvation cluster structures and their energies
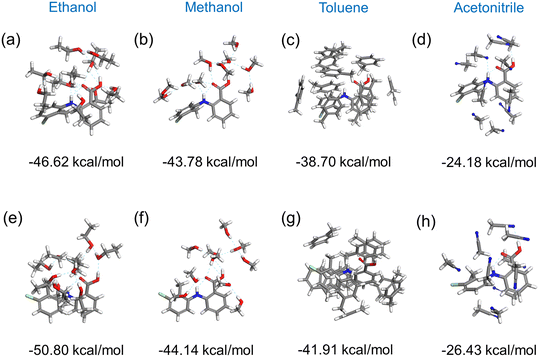
Fig. 11 shows the results of the construction and minimisation of 10-molecule solvated clusters as a function of solvent selection using either form I or form II conformers as the core central molecule. Examination of the solvated clusters reveals that there were no significant changes in the distributions of solvent molecules between the two conformations as the central molecules. The normalised solvation energies of both forms I (Fig. 11(a–d)) and II (Fig. 11(e–h)) in the four solvents were found to exhibit the same order as characterised by their respective solubilities, i.e. ethanol > methanol > toluene > acetonitrile.32In all the solvents, the solvation energy values of the clusters with form II conformer as the central molecule were found to be higher than that with form I, consistent with the solvated structure with form II conformer being more stable when compared to form I conformer. Nonetheless, the energy difference between these two solvated conformers were found to be quite small in most of the solvents, indicating a reasonable probability that both conformers could exist in solution albeit with conformer II being more favoured.
3.5 Polymorph outcomes as a function of crystallisation environment
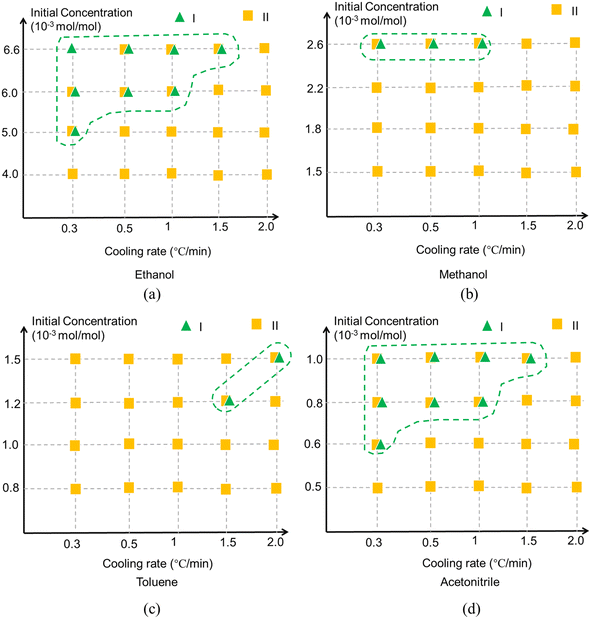
The polymorphic outcomes resulting from cooling crystallisation experiments in ethanol, methanol, toluene and acetonitrile solutions as a function of different cooling rates and solute concentrations are summarised in Fig. 12 revealing that the polymorphic outcomes were not sharply differentiated under these processing conditions as both forms I and II were often found to concomitantly crystallise under the same conditions, see Fig. S4 (ESI†). The results of the polymorphic screening were found to exhibit a degree of stochastic behaviour at times with both forms I and II crystallising concomitantly under very similar process conditions which highlighted the difficulty in controlling their polymorphic forms via crystallisation. In terms of the solution crystallisation conditions, higher initial solute concentrations were found to favour the crystallisation of the stable form I perhaps reflecting a higher probability for solute/solute interactions and hence the molecular assembly of the solute.The solution cooling rate was also found to affect the crystallisation of form I, with the lower cooling rates producing lower supersaturations seemingly increasing the probability of crystallising form I in the polar solvents of ethanol, methanol and acetonitrile albeit with a reverse outcome for the more apolar toluene solutions. Previous studies have shown that solvent selection can have a strong influence on the crystallisability32 of form II but in this work it appeared to have only a limited impact on the polymorphic outcomes post-crystallisation compared to other process-related factors. The noteworthy exception perhaps was that crystallisation from toluene solutions appeared to show a greater preference for form II crystallisation and less for form I when compared to the other solvents. This contrasting behaviour can perhaps be attributed to the different types of solvent–solute interactions present between the different polar and apolar solvents. The TFA molecule has both hydrogen bonding donor and acceptor sites and thus is able to form strong solute/solvent hydrogen bonds with polar, particularly protic, solvents but obviously this would not be the case in toluene solutions where strong π⋯π solute/solvent interactions would be expected to dominate.
The contrasting polymorphic behaviour in toluene is supported by the analysis of the synthon energies, notably their order in terms of interaction strength. In this, calculated order was found to be A2 (stacked dimer of conformer II) > B2 (HB dimer of conformer II) > A1 (HB dimer of conformer I) > B1 (stacked dimer of conformer I). Whilst the HB dimer and stacked dimer were found to have contributed equally to the stability of the crystal structure of form I, the stacked dimer was found to be more important in the crystal structure of form II. Hence, it would seem rational that the strong π⋯π solute/solvent interactions in toluene solutions might influence the assembly of hydrophobic stacked dimers. Thus, the most stable synthon A2 was more likely to be formed in this crystallisation environment while the hydrophilic synthon B2 might be expected to be more difficult to form.
4. Conclusions
Molecular modelling at multiple scales (molecular, intermolecular and crystallographic) combined with crystallisation screening have been used to characterise the influence of the solution processing environment upon the polymorphic crystallisation behaviour of the two main conformational polymorphic forms of TFA. The overall analysis, summarised in Table 6, provides an improvement in the current understanding of the structural pathway for TFA from its solvated solute state through molecular clustering to the formation of crystals. It highlights how the crystallisation process can be affected by the solution environment and how, in turn, the crystallisation processing environment can mediate the formation of the different polymorphic structures.| TFA | Polymorph | Form I | Form II | |
|---|---|---|---|---|
| Molecule | Conformation | Twisted42 | Planar42 | |
| Molecular volume (A−3) | 1204.95 (ref. 42) | 1195.54 (ref. 42) | ||
| Molecular surface area (A−2) | 233.44 | 235.65 | ||
| Deformation energy (kcal mol−1) | −8.54 | −7.75 | ||
| Dipole moment (D) | 1.54 | 2.77 | ||
| Cluster | Nucleation mechanism32 | Unknown | Progressive | |
| Stability | Smaller sizes | Lower | Higher | |
| Medium sizes | Higher | Lower | ||
| Larger sizes | Lower | Higher | ||
| Solute cluster conformational variance | 7.81–15.69 | 1.15–2.85 | ||
| Solvation energy | Ethanol (protic) | Lower | Higher | |
| Methanol (protic) | ||||
| Toluene (apolar) | ||||
| Acetonitrile (aprotic) | ||||
| Crystal | Lattice energy (kcal mol−1) | Dispersive | −22.51 | −24.44 |
| HB | −5.66 | −5.85 | ||
| Electrostatic | −3.63 | −1.76 | ||
| Total | −31.80 | −32.05 | ||
| Strongest two synthons | Energy (kcal mol−1) | A1: −4.99 (H-bond) | A2: −6.37 (π–π) | |
| B1: −4.98 (π–π) | B2: −5.16 (H-bond) | |||
| Close packing | Lower | Higher | ||
| Melting point (°C) | 211.0 | Converts to form I at (140–160) °C | ||
| Form solution slurry stability | Stable | Converts to form I | ||
| Process environment | Influence of solute concentration on polymorphic outcome | Ethanol | Higher solute concentrations | All concentrations |
| Methanol | Higher solute concentrations | All concentrations | ||
| Toluene | Higher solute concentrations | All concentrations | ||
| Acetonitrile | Higher solute concentrations | All concentrations | ||
| Influence of cooling rate on polymorphic outcome | Ethanol | Most of cooling rates | All cooling rates | |
| Methanol | Lower cooling rates | All cooling rates | ||
| Toluene | Higher cooling rates | All cooling rates | ||
| Acetonitrile | Most of cooling rates | All cooling rates | ||
| Overall crystallisability | Lower | Higher |
The studies confirm that, under ambient conditions, the form I structure (twisted conformational state) is more stable than the more close-packed form II structure (planar conformational state). Crystallisation screening studies mostly resulted in the formation of the metastable form II rather than the stable form I, albeit with some variability associated with forms I and II sometimes crystallising concomitantly. The latter reflects the very close similarities in both molecular and solid-state stabilities leading to the polymorphic outcomes being quite challenging to control. The crystallisation of form I requires a greater conformation change in its pathway from its solvated molecular state to the solid-state creating a higher barrier to crystallisation compared to form II. Solute cluster modelling revealed that smaller sizes produced at the higher solution supersaturations are required to stabilise the form II structure compared to form I and that this would be consistent with the former's observed higher crystallisability. Higher solvation energies for all the solvents were found for the form II conformer compared to form I. This indicated the more favourable existence of form II conformer in solutions but with the small energy differences between these two conformational states providing a high probability of co-existence of both conformers, i.e. consistent with concomitant polymorphic outcomes. Higher solute concentrations together with slower cooling rates (except for toluene) were also found to promote the crystallisation of the stable form I, the latter consistent with the Ostwald's rule. Synthon energy analysis reveals the aromatic dimer present in conformer II (synthon A2) to be the strongest intermolecular interaction associated with the formation of form II, whilst HB dimers were found to be more important for the formation of form I rationalising the differential crystallisation behaviour with the polar solvents directing the crystallisation of form II (and also sometimes concomitantly form I) with the apolar solvent toluene being most likely to direct the crystallisation of form II.
The integrated work presented here sheds new light on the generic inter-relationship between the molecular and intermolecular behaviour within the solvated state (coordination, conformation and polarity) through to the formation and relative stability of molecular solute clusters and their concomitant involvement in the crystallisation and polymorph selection behaviour of TFA.
List of symbols and abbreviations
| E att | Attachment energy |
| E conf | Conformation energy |
| E latt | Lattice energy |
| N | Number of molecules in a cluster |
| T crystal | Torsion-angle in the bulk crystal structure |
| T i | Torsion-angle of the ith molecule in a cluster |
| X, Y, Z | Cartesian coordinates for grid optimisation |
| ΔEconf | Deformation energy |
| τ | Torsion angle |
| AE | Attachment energy |
| DFT | Density Functional Theory |
| DSC | Differential Scanning Calorimetry |
| FTIR | Fourier Transform Infrared |
| HB | Hydrogen-bonding |
| H-bond | Hydrogen-bond |
| IR | Infrared |
| MD | Molecular dynamics |
| MM | Molecular modelling |
| NMR | Nuclear Magnetic Resonance |
| ESI | Electronic supplementary information |
| TFA | Tolfenamic acid |
| UV/vis | Ultraviolet–visible |
| VAR | Variance parameter |
Data availability
The authors declare that the data supporting the findings of the current study are available within the paper and its ESI.† Should any raw data be needed in another format they are available from the corresponding author upon reasonable request.Conflicts of interest
The authors declare no competing financial interest.Acknowledgements
One of us (YL) acknowledges funding support from the China Scholarship Council for a visiting scholarship at the University of Leeds. The authors are grateful for the financial support of Innovate UK through the Digital Design Accelerator Platform Project (TS/T011262/1) in collaboration with AstraZeneca, Cambridge Crystallographic Data Centre, Centre for Process Innovation, GlaxoSmithKline, Perceptive Engineering, Pfizer, Process Systems Enterprises, the University of Sheffield and the University of Strathclyde and also through a Knowledge Transfer Partnership with the Cambridge Crystallographic Data Centre (KTP 12057). This work also builds upon software developments in collaboration with Drs Robert Hammond and Jonathan Pickering at Leeds funded through the ADDoPT and Synthonic Engineering Programs, supported respectively by AMSCI (Grant No. 14060) in collaboration with AstraZeneca, Bristol-Myers Squibb, BRITEST, Cambridge Crystallographic Data Centre, GSK, Perceptive Engineering, Pfizer, Process Systems Enterprise and the STFC Hartree Centre together with the Universities of Cambridge and Strathclyde, and also EPSRC (Grant EP/I028293/1) in collaboration with Pfizer, Boehringer Ingelheim, Novartis, and Syngenta, respectively.References
- R. Hilfker, Polymorphism: in the Pharmaceutical Industry, John Wiley & Sons, 2006 Search PubMed.
- N. Anuar, S. N. Yusop and K. J. Roberts, Crystallogr. Rev., 2022, 28, 97–215 CrossRef CAS.
- R. J. Davey, S. L. M. Schroeder and J. H. ter Horst, Angew. Chem., Int. Ed., 2013, 52, 2166–2179 CrossRef CAS PubMed.
- L. Derdour and D. Skliar, Chem. Eng. Sci., 2014, 106, 275–292 CrossRef CAS.
- I. Rosbottom, T. D. Turner, C. Y. Ma, R. B. Hammond, K. J. Roberts, C. W. Yong and I. T. Todorov, Faraday Discuss., 2022, 235, 467–489 RSC.
- A. Mattei and T. Li, Pharm. Res., 2012, 29, 460–470 CrossRef CAS PubMed.
- S. Parveen, R. J. Davey, G. Dent and R. G. Pritchard, Chem. Commun., 2005, 1531–1533, 10.1039/b418603f.
- A. Kwokal, T. T. H. Nguyen and K. J. Roberts, Cryst. Growth Des., 2009, 4, 4324–4334 CrossRef.
- S. A. Kulkarni, E. S. McGarrity, H. Meekes and J. H. ter Horst, Chem. Commun., 2012, 48, 4983–4985 RSC.
- F. Peral and E. Gallego, Spectrochim. Acta, Part A, 2003, 59, 1223–1237 CrossRef PubMed.
- A. Mattei, X. Mei, A.-F. Miller and T. Li, Cryst. Growth Des., 2013, 13, 3303–3307 CrossRef CAS.
- I. A. Khodov, S. V. Efimov, M. Y. Nikiforov, V. V. Klochkov and N. Georgi, J. Pharm. Sci., 2014, 103, 392–394 CrossRef CAS PubMed.
- I. A. Khodov, S. V. Efimov, V. V. Klochkov, G. A. Alper and L. de Carvalho, Eur. J. Pharm. Sci., 2014, 65, 65–73 CrossRef CAS PubMed.
- W. W. Tang, M. T. Zhang, H. P. Mo, J. B. Gong, J. K. Wang and T. L. Li, Cryst. Growth Des., 2017, 17, 5049–5053 CrossRef CAS.
- E. Wiedenbeck, M. Kovermann, D. Gebauer and H. Colfen, Angew. Chem., Int. Ed., 2019, 58, 19103–19109 CrossRef CAS PubMed.
- D. Toroz, I. Rosbottom, T. D. Turner, D. M. C. Corzo, R. B. Hammond, X. Lai and K. J. Roberts, Faraday Discuss., 2015, 179, 79–114 RSC.
- D. Pontoni, T. Narayanan and A. R. Rennie, Langmuir, 2002, 18, 56–59 CrossRef CAS.
- S. Chattopadhyay, D. Erdemir, J. M. B. Evans, J. Ilavsky, H. Amenitsch, C. U. Segre and A. S. Myerson, Cryst. Growth Des., 2005, 5, 523–527 CrossRef CAS.
- X. L. Chen, J. Schroder, S. Hauschild, S. Rosenfeldt, M. Dulle and S. Forster, Langmuir, 2015, 31, 11678–11691 CrossRef CAS PubMed.
- J. Polte, R. Erler, A. F. Thunemann, F. Emmerling and R. Kraehnert, Chem. Commun., 2010, 46, 9209–9211 RSC.
- R. J. Davey, G. Dent, R. K. Mughal and S. Parveen, Cryst. Growth Des., 2006, 6, 1788–1796 CrossRef CAS.
- R. A. Chiarella, A. L. Gillon, R. C. Burton, R. J. Davey, G. Sadiq, A. Auffret, M. Cioffi and C. A. Hunter, Faraday Discuss., 2007, 136, 179–193 RSC , discussion 213–129.
- W. Tang, A. D. Sima, J. Gong, J. Wang and T. Li, Cryst. Growth Des., 2020, 20, 1779–1788 CrossRef CAS.
- G. Clydesdale, K. J. Roberts and R. Docherty, J. Cryst. Growth, 1994, 135, 331–340 CrossRef CAS.
- G. Clydesdale, K. J. Roberts, K. Lewtas and R. Docherty, J. Cryst. Growth, 1994, 141, 443–450 CrossRef CAS.
- G. Clydesdale, K. J. Roberts, G. B. Telfer and D. J. W. Grant, J. Pharm. Sci., 1997, 86, 135–141 CrossRef CAS PubMed.
- R. B. Hammond, R. S. Hashim, C. Y. Ma and K. J. Roberts, J. Pharm. Sci., 2006, 95, 2361–2372 CrossRef CAS PubMed.
- R. B. Hammond, S. Jeck, C. Y. Ma, K. Pencheva, K. J. Roberts and T. Auffret, J. Pharm. Sci., 2009, 98, 4589–4602 CrossRef CAS PubMed.
- R. B. Hammond, C. Y. Ma, K. J. Roberts, P. Y. Ghi and R. K. Harris, J. Phys. Chem. B, 2003, 107, 11820–11826 CrossRef CAS.
- R. B. Hammond, K. Pencheva and K. J. Roberts, CrystEngComm, 2012, 14, 1069–1082 RSC.
- P. L. Kaskiewicz, I. Rosbottom, D. M. Camacho Corzo, R. B. Hammond, R. Downie, P. J. Dowding, N. George and K. J. Roberts, CrystEngComm, 2021, 23, 3109–3125 RSC.
- Y. Liu, C. Y. Ma, J. Gong and K. J. Roberts, Cryst. Growth Des., 2023, 23, 5846–5859 CrossRef CAS PubMed.
- C. Y. Ma, A. Kwokal, D. Getches, Y.-W. Hsiao and K. J. Roberts, Cryst. Growth Des., 2023, 23, 4522–4537 CrossRef CAS PubMed.
- K. J. Roberts, R. B. Hammond, V. Ramachandran and R. Docherty, in Computational Approaches in Pharmaceutical Solid State Chemistry, ed. Y. A. Abramov, John Wiley & Sons, Ltd, 2015, pp. 175–210 Search PubMed.
- I. Rosbottom, J. H. Pickering, R. B. Hammond and K. J. Roberts, Org. Process Res. Dev., 2020, 24, 500–507 CrossRef CAS.
- I. Rosbottom, K. J. Roberts and R. Docherty, CrystEngComm, 2015, 17, 5768–5788 RSC.
- I. Rosbottom, C. W. Yong, D. L. Geatches, R. B. Hammond, I. T. Todorov and K. J. Roberts, Mol. Simul., 2021, 47, 257–272 CrossRef CAS.
- T. D. Turner, N. Dawson, M. Edwards, J. H. Pickering, R. B. Hammond, R. Docherty and K. J. Roberts, Cryst. Growth Des., 2022, 22, 3042–3059 CrossRef CAS PubMed.
- C. Wang, I. Rosbottom, T. D. Turner, S. Laing, A. G. P. Maloney, A. Y. Sheikh, R. Docherty, Q. Yin and K. J. Roberts, Pharm. Res., 2021, 38, 971–990 CrossRef CAS PubMed.
- C. Wang, T. D. Turner, C. Y. Ma, C. M. Pask, I. Rosbottom, R. S. Hong, A. Y. Sheikh, Q. Yin and K. J. Roberts, CrystEngComm, 2023, 25, 1782–1791 RSC.
- C. Wang, C. Y. Ma, R. S. Hong, T. D. Turner, I. Rosbottom, A. Y. Sheikh, Q. Yin and K. J. Roberts, Mol. Pharmaceutics, 2024, 21, 3525–3539 CrossRef CAS PubMed.
- K. V. Andersen, S. Larsen, B. Alhede, N. Gelting and O. Buchardt, J. Chem. Soc., Perkin Trans. 2, 1989, 2, 1443–1447 RSC.
- P. Sacchi, S. M. Reutzel-Edens and A. J. Cruz-Cabeza, CrystEngComm, 2021, 23, 3636–3647 RSC.
- V. Lopez-Mejias, J. W. Kampf and A. J. Matzger, J. Am. Chem. Soc., 2009, 131, 4554–4555 CrossRef CAS PubMed.
- D. H. Case, V. K. Srirambhatla, R. Guo, R. E. Watson, L. S. Price, H. Polyzois, J. K. Cockcroft, A. J. Florence, D. A. Tocher and S. L. Price, Cryst. Growth Des., 2018, 18, 5322–5331 CrossRef CAS.
- A. O. Surov, P. Szterner, W. Zielenkiewicz and G. L. Perlovich, J. Pharm. Biomed. Anal., 2009, 50, 831–840 CrossRef CAS PubMed.
- A. Mattei and T. Li, Int. J. Pharm., 2011, 418, 179–186 CrossRef CAS PubMed.
- A. Mattei and T. Li, Cryst. Growth Des., 2014, 14, 2709–2713 CrossRef CAS.
- W. Ostwald, Phys. Chem., 1897, 22, 289–330 CAS.
- W. Du, A. J. Cruz-Cabeza, S. Woutersen, R. J. Davey and Q. Yin, Chem. Sci., 2015, 6, 3515–3524 RSC.
- W. Tang, H. Mo, M. Zhang, S. Parkin, J. Gong, J. Wang and T. Li, J. Phys. Chem. B, 2017, 121, 10118–10124 CrossRef CAS PubMed.
- W. W. Tang, Y. F. Quan, J. B. Gong, J. K. Wang, Q. X. Yin and T. L. Li, AIChE J., 2021, 67, e17129 CrossRef CAS.
- C. R. Groom, I. J. Bruno, M. P. Lightfoot and S. C. Ward, Acta Crystallogr., Sect. B: Struct. Sci., Cryst. Eng. Mater., 2016, 72, 171–179 CrossRef CAS PubMed.
- Mettler-Toledo, DSC 1 STAR System, Mettler-Toledo, Switzerland (https://www.mt.com/).
- Technobis Crystallization Systems, Technobis Crystallization Systems B.V. (https://www.crystallizationsystems.com/products/crystal16/), Pyrietstraat 2, 1812 SC Alkmaar, The Netherlands).
- Dassault Systèmes, BIOVIA Materials Studio 2019, (https://www.3ds.com/products-services/biovia/products/molecular-modeling-simulation/biovia-materials-studio/), 78946 Vélizy-Villacoublay Cedex, France Search PubMed.
- J. Gasteiger and M. Marsili, Tetrahedron Lett., 1978, 3181–3184 CrossRef CAS.
- J. Gasteiger and M. Marsili, Tetrahedron, 1980, 36, 3219–3228 CrossRef CAS.
- M. J. Frisch, G. W. Trucks, H. B. Schlegel, G. E. Scuseria, M. A. Robb, J. R. Cheeseman, G. Scalmani, V. Barone, G. A. Petersson, H. Nakatsuji, X. Li, M. Caricato, A. Marenich, J. Bloino, B. G. Janesko, R. Gomperts, B. Mennucci, H. P. Hratchian, J. V. Ortiz, A. F. Izmaylov, J. L. Sonnenberg, D. Williams-Young, F. Ding, F. Lipparini, F. Egidi, J. Goings, B. Peng, A. Petrone, T. Henderson, D. Ranasinghe, V. G. Zakrzewski, J. Gao, N. Rega, G. Zheng, W. Liang, M. Hada, M. Ehara, K. Toyota, R. Fukuda, J. Hasegawa, M. Ishida, T. Nakajima, Y. Honda, Y. Kitao, H. Nakai, T. Vreven, K. Throssell, J. A. Montgomery Jr, J. E. Peralta, F. Ogliaro, M. Bearpark, J. J. Heyd, E. Brothers, K. N. Kudin, V. N. Staroverov, T. Keith, R. Kobayashi, J. Normand, K. Raghavachari, A. Rendell, J. C. Burant, S. S. Iyengar, J. Tomasi, M. Cossi, J. M. Millam, M. Klene, C. Adamo, R. Cammi, J. W. Ochterski, R. L. Martin, K. Morokuma, Ö. Farkas, J. B. Foresman and D. J. Fox, Gaussian∼ 09 Revision D. 02, 2016 Search PubMed.
- C. Y. Ma, A. A. Moldovan, A. G. P. Maloney and K. J. Roberts, J. Pharm. Sci., 2023, 112, 435–445 CrossRef CAS PubMed.
- L. J. Barbour, Chem. Commun., 2006, 1163–1168 RSC.
- C. F. Macrae, I. Sovago, S. J. Cottrell, P. T. A. Galek, P. McCabe, E. Pidcock, M. Platings, G. P. Shields, J. S. Stevens, M. Towler and P. A. Wood, J. Appl. Crystallogr., 2020, 53, 226–235 CrossRef CAS PubMed.
- G. Clydesdale, R. Docherty and K. Roberts, J. Cryst. Growth, 1996, 166, 78–83 CrossRef CAS.
- G. Clydesdale, R. Docherty and K. J. Roberts, Comput. Phys. Commun., 1991, 64, 311–328 CrossRef CAS.
- S. L. Mayo, B. D. Olafson and W. A. Goddard, J. Phys. Chem., 1990, 94, 8897–8909 CrossRef CAS.
- J. J. P. Stewart, Quant. Chem. Prog. Exchange, 1985, 5, 62–63 Search PubMed.
- R. B. Hammond, K. Pencheva, V. Ramachandran and K. J. Roberts, Cryst. Growth Des., 2007, 7, 1571–1574 CrossRef CAS.
- R. B. Hammond, K. Pencheva and K. J. Roberts, J. Phys. Chem. B, 2005, 109, 19550–19552 CrossRef CAS PubMed.
- R. Docherty, G. Clydesdale, K. J. Roberts and P. Bennema, J. Phys. D: Appl. Phys., 1991, 24, 89–99 CrossRef CAS.
- A. Bravais, Etudes Cristallographiques, Gauthiers-Villars, Paris, 1866 Search PubMed.
- G. Friedel, Bull. Soc. Fr. Mineral. Cristallogr., 1907, 30, 326–455 Search PubMed.
- J. D. H. Donnay and D. Harker, Am. Mineral., 1937, 22, 446–467 CAS.
- C. F. Macrae, I. J. Bruno, J. A. Chisholm, P. R. Edgington, P. McCabe, E. Pidcock, L. Rodriguez-Monge, R. Taylor, J. Van De Streek and P. A. Wood, J. Appl. Crystallogr., 2008, 41, 466–470 CrossRef CAS.
- R. B. Hammond, K. Pencheva and K. J. Roberts, Faraday Discuss., 2007, 136, 91–106 RSC.
Footnote |
| † Electronic supplementary information (ESI) available. See DOI: https://doi.org/10.1039/d4ce00460d |
| This journal is © The Royal Society of Chemistry 2024 |

