Matching ROY crystal structures to high-throughput PXRD†
Grace M.
Sparrow
 a,
R. Alex
Mayo
b and
Erin R.
Johnson
 *ac
*ac
aDepartment of Chemistry, Dalhousie University, 6243 Alumni Crescent, Halifax, Nova Scotia B3H 4R2, Canada. E-mail: erin.johnson@dal.ca
bDepartment of Chemistry and Biomolecular Science, University of Ottawa, 10 Marie-Curie Private, Ottawa, Ontario K1N 6N5, Canada
cYusuf Hamied Department of Chemistry, University of Cambridge, Lensfield Road, Cambridge, CB2 1EW, UK
First published on 7th August 2024
Abstract
The ability of a compound to form different crystalline structures, possessing distinct chemical and physical properties, is known as polymorphism. To identify the isolable polymorphs of a compound, extensive screening of experimental crystallization conditions is often carried out in a high-throughput fashion, where only powder X-ray diffraction (PXRD) patterns are obtainable. The room-temperature diffractograms must then be compared to low-temperature, single-crystal X-ray structures, such as from the Cambridge structural database (CSD), to identify if a particular solid form is a new or pre-existing polymorph. This comparison is problematic because the PXRD peak positions shift substantially with temperature. The variable-cell experimental powder difference (VC-xPWDF) method was recently developed to allow reliable comparison of experimental PXRD patterns to simulated diffractograms of known crystal structures. This work demonstrates the utility of VC-xPWDF to solve crystal structures from PXRD data generated during high-throughput polymorph screening for the test case of 5-methyl-2-[(2-nitrophenyl)amino]-3-thiophenecarbonitrile, also known as ROY, which is a prolific polymorph former. The method is shown to be successful for the comparison of PXRD patterns to both experimental crystal structures from the CSD and computationally generated structures obtained from a previous crystal structure prediction study. The experimental diffractogram quality was shown not to affect the results in most cases, although some errors do occur due to preferential orientation and low intensity/high baseline noise, which could potentially be reduced by additional grinding of the samples prior to making the PXRD measurements or slightly longer X-ray exposure during data collection.
1 Introduction
Polymorphism refers to the ability of the same material to exhibit different crystalline forms.1 While thermodynamics dictates which polymorph is stable at a given set of conditions (e.g. temperature and pressure), the kinetics of nucleation and crystal growth influences which polymorph is actually formed for a particular set of crystallization parameters (e.g. solvent and cooling rate).2–6 Polymorphism is particularly common for many organic compounds, where the weak intermolecular forces allow for multiple low-energy crystal structures.7,8 As a result, polymorph control is instrumental in a variety of industries, including production of explosives, dyes, organic electronics, and especially pharmaceuticals.9–13 Different polymorphs of a compound have different physical properties, including solubility; for a pharmaceutical, this affects its bioavailability.14–16 Ensuring the correct polymorph is manufactured, and does not convert to a less active form over time, is vital in drug development.5,6 Thus, theoretical and experimental screening techniques are required to identify all isolable polymorphs of pharmaceutical compounds, and these methods are seeing increased use in development of other solid-form molecular materials as well.17–21Crystal structure prediction (CSP) is an effective theoretical screening method that produces an energy landscape of putative crystal structures of a compound given only its molecular structure. This allows prediction of the most likely obtainable polymorphic structure(s) as the lowest-energy candidate(s).22–27 However, CSP is based primarily on electronic energies from methods such as density-functional theory, which are only approximate and neglect thermal free-energy contributions from the lattice vibrations.28–31 Both of these factors may lead to errors in the ranking, and extensive experimental searching for a crystal form that is actually less stable than predicted.32 Even in cases where the CSP landscape is reliable, it contains only thermodynamic data and provides an incomplete picture of crystallization that neglects the involvement of solvent, nucleation, dynamics, and kinetic factors in crystal growth.33 As a result, one or more fairly high-energy structures on the CSP landscape may be observed experimentally, while other, lower-energy structures are not.34 Hence, CSP is an excellent starting point for polymorph screening, but subsequent experimental screening is still vital in the development of new materials to be certain as to which polymorphs are actually formed. Further, differential scanning calorimetry (DSC) measurements and competitive slurry experiments are common experimental tools used to decisively determine the relative stabilities of two or more polymorphs.35–37
High-throughput experimental screening aims to crystallize as wide a range of polymorphs as possible by using an array of different solvents and their mixtures, temperatures, and crystallization regimes, with recent studies seeking to automate this process.38–43 The polymorphic structures obtained are typically analysed using X-ray powder diffraction (PXRD), given that high-throughput screening methods fail to produce single crystals. While PXRD is a fast and easy characterization technique, determining the crystal structure solution from the powder diffraction data is extremely challenging and not often practical. If the structure(s) of one or more polymorphs of the compound of interest have already been solved by single-crystal X-ray diffraction (SC-XRD), then they can potentially be matched to the PXRD patterns from screening studies. Similarly, if CSP has already been performed, then polymorphs identified by PXRD are likely to be represented in the landscape. However, direct comparison of experimental diffractograms to simulated diffractograms of either SC-XRD structures or in silico structures from CSP is often problematic.44,45 This is because the PXRD peak positions are highly sensitive to the lattice parameters, which vary with temperature due to thermal expansion. SC-XRD structures are typically obtained at low temperatures of ca. 150 K, and in silico structures commonly correspond to a static lattice at 0 K, while PXRD analysis is performed under ambient conditions. The resulting shifts in PXRD peak positions make it difficult to distinguish between distinct polymorphs and redeterminations of the same form. It may, therefore, be unclear whether or not the polymorph being analyzed has already been identified.
The variable-cell experimental powder difference (VC-xPWDF) method46 was recently proposed to allow quantitative comparison of experimental and simulated PXRD. It explores possible unit-cell bases for the candidate SC-XRD, or in silico, crystal structures, which are subsequently deformed to match the cell parameters obtained from indexing of the experimental diffractogram. VC-xPWDF then calculates the dissimilarity between the simulated and experimental powder patterns using the de Gelder cross-correlation function.47 In this way, it accounts for the influence of anisotropic, temperature-dependent changes in the lattice parameters on the simulated diffractograms. The development of VC-xPWDF allows for efficient and reliable matching of experimental and simulated PXRD to identify the polymorphic structures formed. In its initial application, VC-xPWDF successfully identified the polymorphs of seven small organic molecules through comparison of moderate-to-low quality PXRD data to both SC-XRD and CSP structures.46
It should be noted that the FIt with DEviating Lattice parameters (FIDEL) method48,49 is another, highly successful approach to quantitative comparison of experimental and simulated PXRD. FIDEL is also based on the de Gelder cross-correlation function47 but, unlike VC-xPWDF, does not require viable unit-cell parameters from indexing. Instead, FIDEL performs a global optimization where the unit-cell dimensions and atomic positions of the known crystal structure are modified to maximize similarity of its simulated diffractogram to the experimental PXRD pattern. While the freedom from indexing is a significant advantage, the global optimization approach means that FIDEL is more computationally expensive than VC-xPWDF and is susceptible to converging to a local minimum with mis-aligned peak positions, which can cause the algorithm to miss matching crystal structures in some cases.46 Additionally, the FIDEL method is not currently implemented in freely distributed software, while VC-xPWDF is available through the open-source critic2 program.50
This work presents an assessment of the effectiveness of VC-xPWDF when used in conjunction with PXRD data from high-throughput polymorph screening. Specifically, we apply VC-xPWDF to identify forms of 5-methyl-2-[(2-nitrophenyl)amino]-3-thiophenecarbonitrile—known as ROY due to its red, orange, and yellow polymorphs51–60—crystallized in a previous high-throughput screening study.42 ROY offers a good benchmark for this investigation due to its 13 known polymorphs—12 with available SC-XRD structures—and the fact that it is well characterized from both the experimental and theoretical standpoints.52,60–62 The low-quality experimental PXRD were compared to SC-XRD data of known ROY polymorphs in the CSD to determine if the correct matching form can be unambiguously identified. Additional comparisons were made between the experimental PXRD and in silico structures predicted in a recent CSP study of ROY.62
2 Data
All experimental PXRD data used herein were obtained from the ESI† of ref. 42. In that work, Rosso et al. performed two high-throughput crystallization studies of ROY, each using a 96-well plate. The first of these was a screening array, which involved 96 different neat solvents or solvent mixtures. These experiments generally yielded polycrystalline samples of small particles. The second was a loading study that involved 12 replicated crystallizations with four different amounts (0.5, 1, 2, and 4 mg) of ROY and either isopropanol/water or tert-amyl alcohol/heptane solvent mixtures, which consistently yielded larger crystals. This loading study produced higher crystallinity samples, according to the metric used, four of which were selected in this work as the representative forms for the experimental data (vide infra). Overall, the crystallizations led to many instances of four different ROY polymorphs, denoted R (red), Y (yellow), OP (orange plates), and ON (orange needles), according to their crystalline appearance.Not all of the samples in the work of Rosso et al. yielded crystals and some of the resulting PXRD patterns had extremely low intensity peaks. The overall crystallinity of the samples was previously defined from the diffractograms as 100 times the ratio of the crystalline peak area to the total pattern area. In our study, we only considered PXRD patterns with crystallinity values of ≥4.5; patterns with a crystallinity index lower than this were omitted due to the indistinguishably of peaks from the noise. This left us with 29 PXRD patterns from the screening array and 48 PXRD patterns from the loading array, for a total data set of 77 diffractograms. To refer to the various experimental diffractograms, we use the same numbering as in the ESI of ref. 42, but with either a leading L to indicate the loading array or a leading S to indicate the screening array. The other letter (A–H) and number (01–12) indicate the row/column position of a particular sample within the 96 wells of the array.
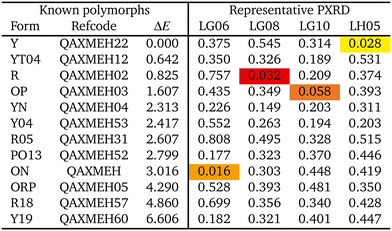
A set of SC-XRD structures of ROY, spanning all 12 polymorphs for which this data is available, was assembled from the Cambridge structural database (CSD) for comparison with the experimental PXRD patterns. As the CSD contains many determinations of some polymorphs under differing conditions, a single representative structure was taken for each form. Our set of representative structures, listed in Table 1, was selected to coincide with that used in ref. 62.
Finally, a set of 264 in silico crystal structures was taken from a CSP landscape for ROY computed by Beran and coworkers.62 In that study, two million candidate structures were initially generated for Z′ = 1 using CrystalPredictor63 with most intramolecular degrees of freedom constrained. Duplicates were removed and the geometries of the 1000 lowest-energy structures were fully relaxed using a distributed multipole force field64 with CrystalOptimizer.65 Following this, all structures within a 10 kJ mol−1 energy threshold, relative to the global minimum, were fully relaxed with dispersion-corrected, plane-wave density-functional theory (DFT) with the B86bPBE functional66,67 and exchange-dipole moment (XDM) dispersion correction68–70 using Quantum ESPRESSO.71 The three experimentally known ROY polymorphs with Z′ = 2 were added to the data set. A monomer energy correction was applied by performing SCS-MP2D calculations72 on isolated molecules excised from the crystal structures using psi4.73
3 Computational methods
The raw PXRD patterns were taken from the ESI of ref. 42 and analysed using the GSAS-II program74 with the data cropped to span 5° ≤ 2θ ≤ 30° followed by background subtraction. The 19–23 most intense peaks, depending on the diffractogram, were selected manually for indexing analysis. Indexing was then performed using all methods available in CRYSFIRE2020;75 the result that yielded the best figure of merit was selected as the final lattice parameters.All VC-xPWDF comparisons were carried out using the critic2 program.50 The algorithm46 works by constructing all possible cell definitions of the candidate crystal structure such that its lattice parameters are within 30% of the cell lengths, and 20° of the angles of the indexed experimental PXRD. The lattice vectors of the candidate cell are then overwritten by those of the indexed cell. The diffractogram of the deformed candidate cell of the crystal structure is simulated using Cu Kα1 radiation (λ = 1.54036 Å) matching the X-ray wavelength used in the ROY screening experiments.42 The simulated and experimental PXRD are then compared using de Gelder's triangle-weighted cross-correlation function47 with a triangle width of 1°. VC-xPWDF evaluates the powder difference, so a value of zero indicates identical structures, while a value of one indicates maximum dissimilarity. The lowest powder difference obtained for any of the possible candidate cell definitions is taken as the final VC-xPWDF score.
4 Results and discussion
4.1 Clustering and indexing
We begin by manually clustering the experimental diffractograms, although this process could, in principle, be automated. Clustering resulted in clear identification of 4 unique polymorphs, each represented by a set of similar diffractograms, as shown in Fig. 1. One exemplar PXRD from each cluster was then selected for indexing; these were patterns LG06, LG08, LG10, and LH05. The diffractograms selected were those that displayed the highest crystallinity, except for one cluster where the case exhibiting the second highest crystallinity (viz. 17.8 for LG10 vs. 18.5 for LH06) was chosen since indexing of that pattern resulted in a significantly higher figure of merit (FoM, 16 vs. 8). The indexed lattice parameters for the four exemplars are collected in Table 2. These lattice parameters were then taken to be representative values for that polymorph, and used in subsequent VC-xPWDF comparisons for all diffractograms within the corresponding cluster.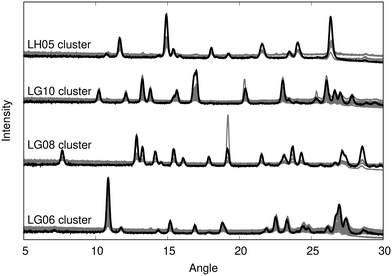 | ||
| Fig. 1 Overlay of experimental diffractograms showing the results of manual clustering. The diffractogram selected for indexing from each cluster is shown in black, with the other patterns in grey. | ||
| Label | Crystallinity | N peaks | FoM | a | b | c | α | β | γ |
|---|---|---|---|---|---|---|---|---|---|
| LG06 | 15.9 | 23 | 16.2 | 3.9619 | 16.4658 | 18.7191 | 90 | 90 | 93.966 |
| LG08 | 18.2 | 21 | 15.1 | 7.5143 | 7.8180 | 11.9392 | 75.574 | 77.726 | 63.725 |
| LG10 | 17.8 | 20 | 16.0 | 7.9915 | 11.7043 | 13.3244 | 90 | 90 | 104.659 |
| LH05 | 16.1 | 19 | 18.0 | 8.5089 | 8.5357 | 16.5484 | 90 | 90 | 92.304 |
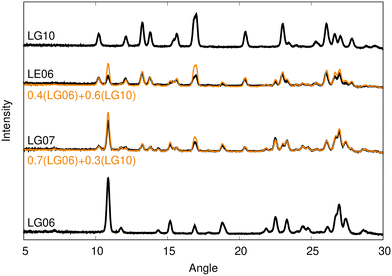
Only two diffractograms, shown in Fig. 2, could not be grouped into any of the four clusters. While an unusual PXRD may indicate formation of an unknown polymorph, consideration of these two diffractograms revealed them to be well represented by linear combinations of the LG06 and LG10 patterns with differing coefficients, implying that they are both mixtures of two polymorphs. As such, we will not consider the patterns for these two mixtures further and all subsequent analysis will focus on structure solution of the four distinct polymorphs identified from the clustering.
4.2 Comparison to CSD structures
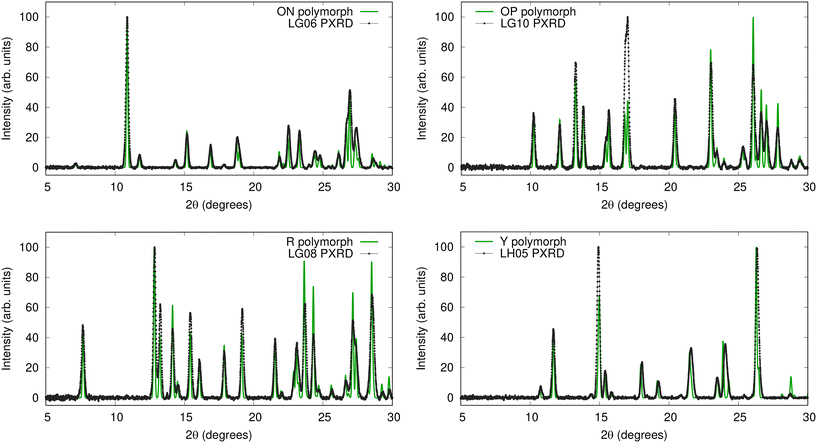 | ||
| Fig. 3 Overlays of the four exemplar experimental PXRD patterns (black) with simulated diffractograms of their matching polymorph's CSD structure after variable-cell correction with VC-xPWDF (green). | ||
Our results allow us to attribute all samples within a particular PXRD cluster to the polymorph matching its exemplar. All crystallization experiments were performed by dissolution at 50 °C followed by cooling to 20 °C,42 and the relative free energies of the observed ROY polymorphs are well known in this temperature range.52 Interestingly, the most stable Y polymorph (LH05 cluster) forms relatively rarely, in only 7 of the 77 cases considered from the crystallization study.42 Forming in 62 of the cases, the OP and ON polymorphs (LG06 and LB10 clusters) are effectively degenerate in this temperature range and slightly less stable than the Y polymorph, lying only 0.2 kJ mol−1 higher in free energy.52 While this is a small free-energy difference, the much greater prevalence of the OP and ON forms implies that kinetic effects favour their formation over the more thermodynamically stable Y polymorph. Finally, the R polymorph is the least stable of the three observed forms (0.6 kJ mol−1 higher than Y in free energy52) at the ambient temperature conditions of the crystallization experiments, which is consistent with it only being generated 6 times (LG08 cluster).42
The ability to assign the PXRD to the structures observed in the CSP landscape and assess the propensity of the formation of certain forms provides an additional level of understanding of the polymorphic landscape. While the OP and ON forms are still less stable than Y according to experimental determinations,52 the free energy difference is much smaller than implied by relative electronic energies from CSP (see Table 1), and kinetics will play a roll in their preferential formation over the Y polymorph. Conversely, the apparent stability of R (and any other forms between Y and OP/ON) from the CSP landscape62 is eliminated with the addition of entropy contributions, and a lower number of occurrences is expected according to thermodynamic arguments.
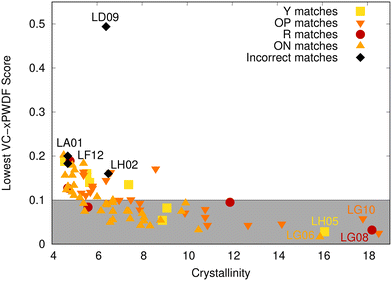
Overall, the lowest VC-xPWDF score successfully identified the CSD structure of the matching polymorph for 71/75 diffractograms. Additionally, VC-xPWDF provided the correct structure assignment in all cases with scores ≤0.1, which we view as a good cutoff for a likely match. VC-xPWDF also correctly matched all PXRD with crystallinity ≥7, although the method chosen to calculate the crystallinity index may not be the best descriptor of diffractogram quality. In ref. 42, the crystallinity was determined from the experimental diffractograms as 100 times the ratio of crystalline peak area to total pattern area, which does not account for preferred orientation. Many structures with low crystallinity values between 4.5 and 7 were correctly matched to CSP structures with VC-xPWDF scores of ≤0.2. On the other hand, one structure (LD09) with a moderate crystallinity of 6.4 gave a minimum VC-xPWDF score of 0.494 and a missed match.
To investigate the origins of the four matches missed by VC-xPWDF, we plot overlays of these experimental PXRD with the simulated diffractogram of the correct matching polymorph in Fig. 5. The upper left panel shows the result for the largest outlier in Fig. 4, which was the case of LD09; based on clustering, this sample should contain the R polymorph. The diffractogram overlay in Fig. 5 reveals that the issue here is preferential orientation, with one peak in the experimental PXRD having an anomalously high intensity compared to the others. This leads to low intensity overlap with all remaining peaks and a high VC-xPWDF score for comparison with the R polymorph (0.506), and indeed with all other reference SC-XRD structures. The upper right panel in Fig. 5 shows the result for LA01, which has a crystallinity of only 4.7. Here, the lowest VC-xPWDF score is obtained for the Y04 form (0.181), as opposed to the OP form (0.310) that is the matching polymorph for the corresponding cluster of diffractograms. The PXRD overlay again indicates issues with preferential orientation. While less severe than for LD09, there remains one peak in the experimental PXRD that is anomalously high relative to the others. Coincidentally, the most intense peak in the simulated diffractogram of the Y04 polymorph appears at a similar angle (see the ESI†), explaining why it provides a lower VC-xPWDF score in this case. In the experimental study by Rosso et al.,42 they note that all samples “were subjected to grinding by a magnetic stir bar to minimise preferential orientation errors”. However, this seems to have been insufficient for two of the samples from the loading study, and additional grinding before acquiring the PXRD patterns is recommended.
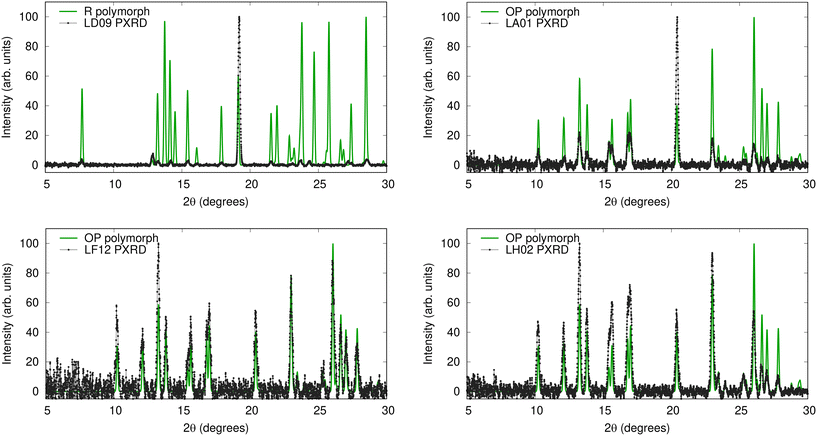 | ||
| Fig. 5 Overlays of four experimental PXRD patterns (black) with simulated diffractograms of their matching polymorph's CSD structure after variable-cell correction with VC-xPWDF. These are the four cases for which VC-xPWDF was not able to predict the correct structural match, due to either preferential orientation (top row) or excessive noise in the experimental diffractogram (bottom row). Overlays with the (incorrect) best VC-xPWDF match are shown in the ESI.† | ||
PXRD overlays for the other two missed matches are shown in the lower two panels of Fig. 5. These occur for samples LF12 and LH02, both of which should correspond to the OP polymorph based on the diffractogram clustering. Here, overlays of the experimental and simulated diffractograms display evident visual matches, so it is unclear why a lower VC-xPWDF score is not obtained for the OP structure. In both these cases, the lowest VC-xPWDF scores are obtained for comparison with the Y04 polymorph (viz. 0.200 and 0.160 for LF12 and LH02, respectively), despite the obvious visual differences in their diffractograms (see the ESI†). The next-lowest scores are obtained for comparison with the OP polymorph (viz. 0.221 and 0.177 for LF12 and LH02, respectively). We conjecture that the issue here is the high level of baseline noise in the experimental diffractograms, as evidenced by the low crystallinity. It is likely that higher levels of overlap with the noise are enough to bias the VC-xPWDF scores away from the correct match.
4.3 Comparison to CSP structures
In practical cases of polymorph screening, it is unlikely that the system under study will be as well characterized as ROY, with solved SC-XRD structures already available for 12 of 13 observed polymorphs. The more likely event is that screening uncovers one or more new polymorphs of a compound, but without yielding a sufficiently large single crystal for SC-XRD. The most efficient route to structure solution may then be through comparison to putative, in silico, crystal structures generated via CSP. To highlight the viability of this approach, VC-xPWDF is used to compare the four indexed, experimental PXRD (Table 2) to 264 DFT-optimized crystal structures of ROY.Typically, the results of CSP are represented visually in the form of a crystal-energy landscape, which is a scatter plot with each point representing a candidate crystal structure. The ordinate is the energy of each structure, relative to the global minimum, while the abscissa is often the density of the crystal. Fig. 6 shows CSP landscapes where the abscissa is instead the computed VC-xPWDF score obtained from comparison of the candidate crystal structures with one of the four indexed PXRD patterns (LG06, LG08, LG10, or LH05). The most likely matches to the experimental diffractograms should be structures with both low energies and low VC-xPWDF scores, appearing near the bottom left corner of each plot.
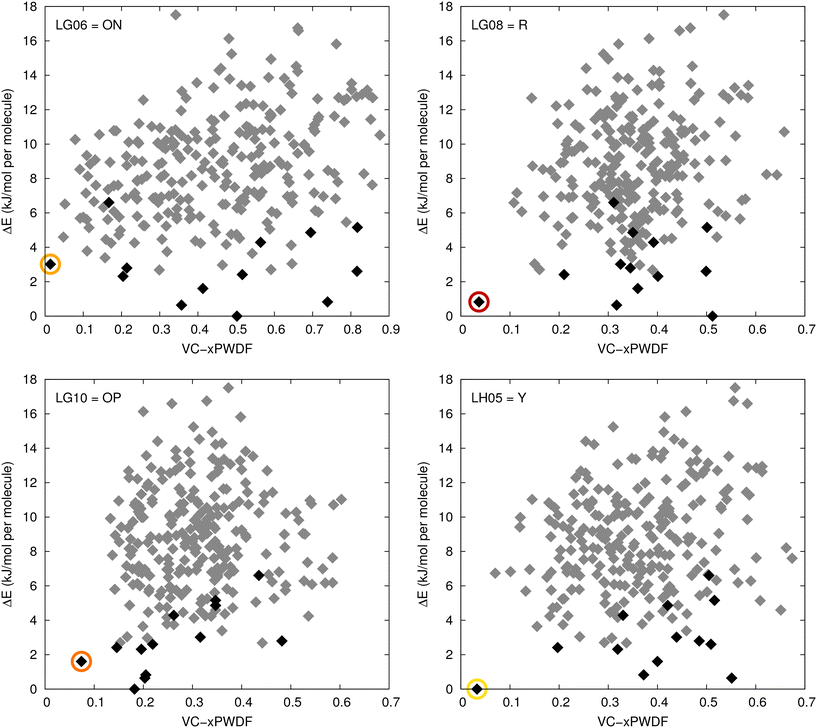 | ||
| Fig. 6 CSP landscapes for ROY, using the relative energies computed in ref. 62. For each plot, the abscissa is the VC-xPWDF score obtained from comparison of each candidate crystal structure with the indicated experimental PXRD pattern. Black points correspond to the 13 known ROY polymorphs (including the proposed structure for RPL60), while the grey points indicate putative structures generated from CSP. The circled points correspond to the matching polymorph for each diffractogram. | ||
The results in Fig. 6 show that the lowest VC-xPWDF scores are obtained for the ON form for LG06, the R form for LG08, the OP form for LG10, and the Y form for LH05. This exactly matches the results from VC-xPWDF comparison to CSD crystal structures of ROY (Table 1). The present results highlight the ability of VC-xPWDF to solve crystal structures from indexed powder data in conjunction with an appropriate set of candidate structures from CSP.
5 Conclusion
In this work, 77 experimental diffractograms were taken from a previous high-throughput polymorph screen of ROY.42 Clustering of the diffractograms revealed four distinct polymorphs, and two mixtures. One representative PXRD pattern with high crystallinity was selected for each polymorph and indexed; the resulting lattice parameters were used for all quantitative structure comparisons for that diffractogram cluster. The VC-xPWDF method was then used to compare the experimental PXRD patterns to simulated diffractograms of SC-XRD structures for 12 ROY polymorphs obtained from the CSD. The four exemplar PXRD patterns used for indexing were also compared to simulated diffractograms for all in silico crystal structures in the CSP landscape generated by Beran and coworkers.62In general, the single crystal structure that yields the lowest VC-xPWDF score when compared to an experimental diffractogram is taken as the corresponding polymorph, with a score <0.1 typically indicating a good match. Using this criterion, the VC-xPWDF comparisons for the four indexed diffractograms lead to their unambiguous assignment as the yellow (Y), red (R), orange plates (OP), and orange needles (ON) forms, regardless of whether CSD or CSP reference structures were employed. We propose that CSP-type landscapes, plotting the relative energies of candidate crystal structures vs. the VC-xPWDF scores, should be a convenient aid to structure solution from powder data.
VC-xPWDF also typically predicted the correct polymorph match to CSD structures, based on agreement with the exemplar result for a corresponding cluster, for lower-crystallinity diffractograms. However, as the crystallinity decreases, the VC-xPWDF scores for the best matching polymorph typically increase, frequently surpassing the recommended 0.1 threshold46 for a good match. There were also four cases where VC-xPWDF assigned the best match to an incorrect polymorph, either due to substantial preferred orientation of the sample or to excessive baseline noise. In the latter situation, there was only a very small difference between the lowest and second-lowest VC-xPWDF scores, and plotting overlays of the simulated and experimental diffractograms clearly revealed the correct structural match.
Given the above results, it can be suggested that there is a minimum quality for the diffractogram that must be met to use VC-xPWDF. However, one missed match occurred for a relatively high crystallinity sample due to preferred orientation, while many samples with lower crystallinity were perfectly amenable to VC-xPWDF analysis. This prompts consideration as to how diffractogram quality is determined given that the error in identification is often due to the problem of preferred orientation rather than aspects commonly attributed to the crystallinity of the sample itself (e.g. baseline, signal to noise, etc.). In cases with several candidate structures yielding similar VC-xPWDF scores, visual inspection of PXRD data should be considered to ensure correct identification of the polymorphic forms. Issues with preferred orientation could potentially be reduced by additional grinding of the samples prior to PXRD data collection.
Finally, this work demonstrates a bridge between CSP and experimental polymorph screening, allowing us to assign structures to observed forms and understand their propensity for crystallization. From comparison of the VC-xPWDF assigned structures with the experimental free energies,52 it is clear that kinetics plays a role in explaining the high formation propensity of the ON and OP polymorphs. These are by far the most prevalent forms identified from the polymorph screen, despite having effectively degenerate free energies that are slightly higher than that of the Y form, which is thermodynamically favoured. On the other hand, the low crystallization propensity of the R polymorph, and lack of any less-stable forms, is consistent with the relative free energies over the experimental temperature range.
Conflicts of interest
There are no conflicts to declare.Acknowledgements
This work was supported by the Natural Sciences and Engineering Research Council (NSERC) of Canada, and by the Royal Society through a Wolfson Visiting Fellowship to ERJ.References
- J. Haleblian and J. W. McCrone, J. Pharm. Sci., 1969, 58, 911 CrossRef PubMed.
- J. Bernstein, Polymorphism in molecular crystals 2e, International Union of Crystal, 2020, vol. 30 Search PubMed.
- J. R. Davey, N. Blagden, S. Righini, H. Alison and E. S. Ferrari, J. Phys. Chem., 2002, 106, 1954 CrossRef.
- Y. Gui, C. Huang, C. Shi, T. Stelzer, G. G. Z. Zhang and L. Yu, J. Chem. Phys., 2022, 156, 144504 CrossRef PubMed.
- J. D. Dunitz and J. Bernstein, Acc. Chem. Res., 1995, 28, 193–200 CrossRef.
- D.-K. Bučar, R. W. Lancaster and J. Bernstein, Angew. Chem., Int. Ed., 2015, 54, 6972–6993 CrossRef.
- G. P. Stahly, Cryst. Growth Des., 2007, 7, 1007–1026 CrossRef CAS.
- A. J. Cruz-Cabeza, S. M. Reutzel-Edens and J. Bernstein, Chem. Soc. Rev., 2015, 44, 8619–8635 RSC.
- R. Bu, H. Li and C. Zhang, Cryst. Growth Des., 2020, 20, 3561–3576 CrossRef CAS.
- Z. Hao and A. Iqbal, Chem. Soc. Rev., 1997, 26, 203–213 RSC.
- Y. Yang, B. Rice, X. Shi, J. R. Brandt, R. Correa da Costa, G. J. Hedley, D.-M. Smilgies, J. M. Frost, I. D. W. Samuel, A. Otero-de-la-Roza, E. R. Johnson, K. E. Jelfs, J. Nelson, A. J. Campbell and M. J. Fuchter, ACS Nano, 2017, 11, 8329–8338 CrossRef CAS PubMed.
- J. Yang, C. T. Hu, X. Zhu, Q. Zhu, M. D. Ward and B. Kahr, Angew. Chem., Int. Ed., 2017, 56, 10165–10169 CrossRef CAS PubMed.
- S. R. Chemburkar, J. Bauer, K. Deming, H. Spiwek, K. Patel, J. Morris, R. Henry, S. Spanton, W. Dziki, W. Porter, J. Quick, P. Bauer, J. Donaubauer, B. A. Narayanan, M. Soldani, D. Riley and K. McFarland, Org. Process Res. Dev., 2000, 4, 413–417 CrossRef CAS.
- H. Park, J.-S. Kim, S. Hong, E.-S. Ha, H. Nie, Q. T. Zhou and M.-S. Kim, J. Pharm. Invest., 2022, 52, 175–194 CrossRef CAS.
- D. Singhai and W. Curatolo, Adv. Drug Delivery Rev., 2004, 56, 335–347 CrossRef.
- N. Blagden, M. de Matas, P. T. Gavan and P. York, Adv. Drug Delivery Rev., 2007, 59, 617–630 CrossRef CAS.
- A. Y. Lee, D. Erdemir and A. S. Myerson, Annu. Rev. Chem. Biomol. Eng., 2011, 2, 259–280 CrossRef.
- S. L. Price and S. M. Reutzel-Edens, Drug Discovery Today, 2016, 21, 912–923 CrossRef.
- S. L. Price, D. E. Braun and S. M. Reutzel-Edens, Chem. Commun., 2016, 52, 7065–7077 RSC.
- J. Nyman and S. M. Reutzel-Edens, Faraday Discuss., 2018, 211, 459–476 RSC.
- A. Pulido, L. Chen, T. Kaczorowski, D. Holden, M. A. Little, S. Y. Chong, B. J. Slater, D. P. McMahon, B. Bonillo, C. J. Stackhouse, A. Stephenson, C. M. Kane, R. Clowes, T. Hasell, A. I. Cooper and G. M. Day, Nature, 2017, 543, 657–664 CrossRef CAS.
- J. P. M. Lommerse, W. D. S. Motherwell, H. L. Ammon, J. D. Dunitz and A. Gavezzotti, et al. , Acta Crystallogr., Sect. B: Struct. Sci., 2000, 58, 647–661 Search PubMed.
- W. D. S. Motherwell, H. L. Ammon, J. D. Dunitz, A. Dzyabchenko and P. Erk, et al. , Acta Crystallogr., Sect. B: Struct. Sci., 2002, 58, 647–661 CrossRef PubMed.
- G. M. Day, W. D. S. Motherwell, H. L. Ammon, S. X. M. Boerrigter and R. G. Della Valle, et al. , Acta Crystallogr., Sect. B: Struct. Sci., 2005, 61, 511–527 CrossRef CAS.
- G. M. Day, T. G. Cooper, A. J. Cruz-Cabeza, K. E. Hejczyk and H. L. Ammon, et al. , Acta Crystallogr., Sect. B: Struct. Sci., 2009, 65, 107–125 CrossRef CAS.
- D. A. Bardwell, C. S. Adjiman, Y. A. Arnautova, E. Bartashevich and S. X. M. Boerrigter, et al. , Acta Crystallogr., Sect. B: Struct. Sci., 2011, 67, 535–551 CrossRef CAS PubMed.
- A. M. Reilly, R. I. Cooper, C. S. Adjiman, S. Bhattacharya, A. D. Boese, J. G. Brandenburg, P. J. Bygrave, R. Bylsma, J. E. Campbell, R. Car, D. H. Case, R. Chadha, J. C. Cole and K. Cosburn, et al. , Acta Crystallogr., Sect. B: Struct. Sci., Cryst. Eng. Mater., 2016, 72, 439–459 CrossRef CAS.
- J. Nyman and G. M. Day, CrystEngComm, 2015, 17, 5154–5165 RSC.
- J. Nyman and G. M. Day, Phys. Chem. Chem. Phys., 2016, 18, 31132–31143 RSC.
- J. Hoja and A. Tkatchenko, Faraday Discuss., 2018, 211, 253–274 RSC.
- J. Hoja, H. Y. Ko, M. A. Neumann, R. Car, R. A. Distasio and A. Tkatchenko, Sci. Adv., 2019, 5, eaau3338 CrossRef PubMed.
- R. M. Bhardwaj, J. A. McMahon, J. Nyman, L. S. Price, S. Konar, I. D. H. Oswald, C. R. Pulham, S. L. Price and S. M. Reutzel-Edens, J. Am. Chem. Soc., 2019, 141, 13887–13897 CrossRef PubMed.
- S. L. Price, Faraday Discuss., 2018, 211, 9–30 RSC.
- M. A. Neumann and J. van de Streek, Faraday Discuss., 2018, 211, 441–458 RSC.
- S. Reutzel-Edens, Curr. Opin. Drug Discovery Dev., 2006, 9, 806–815 Search PubMed.
- K. Park, J. M. B. Evans and A. S. Myerson, Cryst. Growth Des., 2003, 3, 991–995 CrossRef.
- P. G. Royall, A. K. Kett and R. J. Cameron, Int. J. Pharm., 2008, 350, 48–52 CrossRef PubMed.
- A. J. Alvarez, A. Singh and A. S. Myerson, Cryst. Growth Des., 2009, 9, 4181–4188 CrossRef.
- A. M. Campeta, B. P. Chekal, Y. A. Abramov, P. A. Meenan, M. J. Henson, B. Shi, R. A. Singer and K. R. Horspool, J. Pharm. Sci., 2010, 99, 3874–3886 CrossRef PubMed.
- R. Storey, R. Docherty, P. Higginson, C. Dallman, C. Gilmore, G. Barr and W. Dong, Crystallogr. Rev., 2014, 10, 45–56 CrossRef.
- J. A. Selekman, D. Roberts, V. Rosso, J. Qiu, J. Nolfo, Q. Gao and J. Janey, Org. Process Res. Dev., 2016, 20, 70–75 CrossRef.
- V. W. Rosso, Z. Yin, H. Abourahma, A. Furman, S. Sharif, A. Werneth, J. M. Stevens, F. Roberts, D. Aulakh, R. Sommer and A. A. Sarjeant, Org. Process Res. Dev., 2023, 27, 1437–1444 CrossRef CAS.
- A. M. Lunt, H. Fakhruldeen, G. Pizzuto, L. Longley, A. White, N. Rankin, R. Clowes, B. Alston, L. Gigli and G. M. Day, et al. , Chem. Sci., 2024, 15, 2456–2463 RSC.
- J. van de Streek and S. Motherwell, Acta Crystallogr., Sect. B: Struct. Sci., 2005, 61, 504–510 CrossRef.
- M. Zilka, D. V. Dudenko, C. E. Hughes, P. A. Williams, S. Sturniolo, W. T. Franks, C. J. Pickard, J. R. Yates, K. D. Harris and S. P. Brown, Phys. Chem. Chem. Phys., 2017, 19, 25949–25960 RSC.
- R. A. Mayo, K. M. Marczenko and E. R. Johnson, Chem. Sci., 2023, 14, 4777–4785 RSC.
- R. de Gelder, R. Wehrens and J. A. Hageman, J. Comput. Chem., 2001, 22, 273–289 CrossRef.
- S. Habermehl, P. Mörschel, P. Eisenbrandt, S. M. Hammer and M. U. Schmidt, Acta Crystallogr., Sect. B: Struct. Sci., Cryst. Eng. Mater., 2014, 70, 347–359 CrossRef.
- S. Habermehl, C. Schlesinger and M. U. Schmidt, Acta Crystallogr., Sect. B: Struct. Sci., Cryst. Eng. Mater., 2022, 78, 195–213 CrossRef.
- A. Otero-de-la-Roza, E. R. Johnson and V. Luaña, Comput. Phys. Commun., 2014, 185, 1007–1018 CrossRef.
- G. Stephenson, T. Borchardt, S. Byrn, J. Bowyer, C. Bunnell, S. Snorek and L. Yu, J. Pharm. Sci., 1995, 84, 1385–1386 CrossRef PubMed.
- L. Yu, G. A. Stephenson, C. A. Mitchell, C. A. Bunnell, S. V. Snorek, J. J. Bowyer, T. B. Borchardt, J. G. Stowell and S. R. Byrn, J. Am. Chem. Soc., 2000, 122, 585–591 CrossRef.
- S. Chen, I. A. Guzei and L. Yu, J. Am. Chem. Soc., 2005, 127, 9881–9885 CrossRef.
- M. Tan, A. G. Shtukenberg, S. Zhu, W. Xu, E. Dooryhee, S. M. Nichols, M. D. Ward, B. Kahr and Q. Zhu, Faraday Discuss., 2018, 211, 477–491 RSC.
- K. S. Gushurst, J. Nyman and S. X. M. Boerrigter, CrystEngComm, 2019, 21, 1363–1368 RSC.
- A. R. Tyler, R. Ragbirsingh, C. J. McMonagle, P. G. Waddell, S. E. Heaps, J. W. Steed, P. Thaw, M. J. Hall and M. R. Probert, Chem, 2020, 6, 1755–1765 Search PubMed.
- A. Lévesque, T. Maris and J. D. Wuest, J. Am. Chem. Soc., 2020, 142, 11873–11883 CrossRef PubMed.
- X. Li, X. Ou, H. Rong, S. Huang, J. Nyman, L. Yu and M. Lu, Cryst. Growth Des., 2020, 20, 7093–7097 CrossRef.
- C. A. Mitchell, L. Yu and M. D. Ward, J. Am. Chem. Soc., 2001, 123, 10830–10839 CrossRef CAS PubMed.
- J. Nyman, L. Yu and S. M. Reutzel-Edens, CrystEngComm, 2019, 21, 2080–2088 RSC.
- L. Yu, Acc. Chem. Res., 2010, 43, 1257–1266 CrossRef CAS PubMed.
- G. J. O. Beran, I. J. Sugden, C. Greenwell, D. H. Bowskill, C. C. Pantelides and C. S. Adjiman, Chem. Sci., 2022, 13, 1288–1297 RSC.
- M. Habgood, I. J. Sugden, A. V. Kazantsev, C. S. Adjiman and C. C. Pantelides, J. Chem. Theory Comput., 2015, 11, 1957–1969 CrossRef CAS PubMed.
- S. L. Price, M. Leslie, G. W. A. Welch, M. Habgood, L. S. Price, P. G. Karamertzanis and G. M. Day, Phys. Chem. Chem. Phys., 2010, 12, 8478–8490 RSC.
- A. V. Kazantsev, P. G. Karamertzanis, C. S. Adjiman and C. C. Pantelides, J. Chem. Theory Comput., 2011, 7, 1998–2016 CrossRef CAS PubMed.
- A. D. Becke, J. Chem. Phys., 1986, 85, 7184 CrossRef CAS.
- J. P. Perdew, K. Burke and M. Ernzerhof, Phys. Rev. Lett., 1996, 77, 3865 CrossRef CAS PubMed.
- A. D. Becke and E. R. Johnson, J. Chem. Phys., 2007, 127, 154108 CrossRef PubMed.
- E. R. Johnson, in Non-covalent Interactions in Quantum Chemistry and Physics, ed. A. Otero-de-la-Roza and G. A. DiLabio, Elsevier, 2017, ch. 5, pp. 169–194 Search PubMed.
- A. Otero-de-la-Roza and E. R. Johnson, J. Chem. Phys., 2012, 136, 174109 CrossRef CAS PubMed.
- P. Giannozzi, S. Baroni, N. Bonini, M. Calandra, R. Car, C. Cavazzoni, D. Ceresoli, G. L. Chiarotti, M. Cococcioni and I. Dabo, et al. , J. Phys.: Condens. Matter, 2009, 21, 395502 CrossRef PubMed.
- C. Greenwell, J. Řezáč and G. J. O. Beran, Phys. Chem. Chem. Phys., 2022, 24, 3695–3712 RSC.
- R. M. Parrish, L. A. Burns, D. G. Smith, A. C. Simmonett, A. E. DePrince, E. G. Hohenstein, U. Bozkaya, A. Y. Sokolov, R. Di Remigio and R. M. Richard, et al. , J. Chem. Theory Comput., 2017, 13, 3185–3197 CrossRef CAS PubMed.
- B. H. Toby, R. B. Von Dreele, P. Juhás, B. Kiefer and T. Proffen, GSAS-II: the GenX of crystallography software?, Software, 2013, Available at: https://subversion.xray.aps.anl.gov/trac/pyGSAS.
- R. B. Shirley, CRYSFIRE2020 (Version 1.0), Software, 2020, Available at: http://www.icdd.com/.
Footnote |
| † Electronic supplementary information (ESI) available: PXRD overlays of missed matches, tables of VC-xPWDF scores, and processed experimental diffractograms. See DOI: https://doi.org/10.1039/d4ce00700j |
| This journal is © The Royal Society of Chemistry 2024 |

