Machine-learning-assisted performance improvements for multi-resonance thermally activated delayed fluorescence molecules†
Wanlin
Cai
 a,
Cheng
Zhong
b,
Zi-Wei
Ma
a,
Zhuan-Yun
Cai
a,
Yue
Qiu
a,
Cheng
Zhong
b,
Zi-Wei
Ma
a,
Zhuan-Yun
Cai
a,
Yue
Qiu
 c,
Zubia
Sajid
a and
De-Yin
Wu
 *a
*a
aState Key Laboratory of Physical Chemistry of Solid Surface, Collaborative Innovation Center of Chemistry for Energy Materials, and Department of Chemistry, College of Chemistry and Chemical Engineering, Xiamen University, Xiamen, 361005, P. R. China. E-mail: dywu@xmu.edu.cn
bHubei Key Lab on Organic and Polymeric Optoelectronic Materials, Department of Chemistry, Wuhan University, Wuhan, Hubei 430072, P. R. China
cGrimwade Centre for Cultural Materials Conservation, School of Historical and Philosophical Studies, Faculty of Arts, University of Melbourne, Parkville, VIC 3052, Australia
First published on 30th November 2023
Abstract
With favorable colour purity, multi-resonance thermally activated delayed fluorescence (MR-TADF) molecules exhibit enormous potential in high-definition displays. Due to the relatively small chemical space of MR-TADF molecules, it is challenging to improve molecular performance through domain-specific expertise alone. To address this problem, we focused on optimizing the classic molecule, DABNA-1, using machine learning (ML). Molecular morphing operations were initially employed to generate the adjacent chemical space of DABNA-1. Subsequently, a machine learning model was trained with a limited database and used to predict the properties throughout the generated chemical space. It was confirmed that the top 100 molecules suggested by machine learning present excellent electronic structures, characterized by small reorganization energy and singlet–triplet energy gaps. Our results indicate that the improvement in electronic structures can be elucidated through the view of the molecular orbital (MO). The results also reveal that the top 5 molecules present weaker vibronic peaks of the emission spectrum, demonstrating higher colour purity when compared to DABNA-1. Notably, the M2 molecule presents a high RISC rate, indicating its promising future as a high-efficiency MR-TADF molecule. Our machine-learning-assisted approach facilitates the rapid optimization of classical molecules, addressing a crucial requirement within the organic optoelectronic materials community.
1. Introduction
Multi-resonance thermally activated delayed fluorescence (MR-TADF) molecules hold great promise in addressing the broad emission issue commonly encountered by conventional TADF molecules.1–4 This is closely associated with the weak vibronic coupling that arises from local electron density reorganization, a key feature of the MR-TADF mechanism.3 As a result, MR-TADF molecules are emerging as an attractive choice for high-definition organic light-emitting diode (OLED) emitters. In general, an excellent MR-TADF molecule should present weak vibronic coupling between the lowest singlet excited state (S1) and the ground state (S0), as well as a small energy gap (ΔEST) between S1 and the lowest triplet excited state (T1).2,5 The weak vibronic coupling is associated with narrowband emission, thereby ensuring high colour purity.6–8 A small ΔEST can accelerate the reverse intersystem crossing (RISC) process of triplet excitons upconverting to singlet states, which reduces triplet exciton concentrations and mitigates efficiency roll-off.3,9–11In comparison to the conventional TADF molecules with donor–acceptor structures, the chemical space explored for MR-TADF molecules (the number of known MR-TADF structures) remains limited.3,12 The main design strategy for MR-TADF molecules is to combine heteroatoms with complementary electronegativity, currently with the commonly available combinations of B/N, B/O, and C![[double bond, length as m-dash]](https://www.rsc.org/images/entities/char_e001.gif) O/N.1,3 As a result, it will be challenging to further improve the colour purity and the RISC rate through expert experience. As a classic well-performing MR-TADF molecule, B/N-doped compound DABNA-1 (Fig. 1) has experimentally exhibited a narrow full width at half maximum (FWHM) of 190 meV and a remarkable RISC rate of 9.9 × 10³ s−1.13
O/N.1,3 As a result, it will be challenging to further improve the colour purity and the RISC rate through expert experience. As a classic well-performing MR-TADF molecule, B/N-doped compound DABNA-1 (Fig. 1) has experimentally exhibited a narrow full width at half maximum (FWHM) of 190 meV and a remarkable RISC rate of 9.9 × 10³ s−1.13
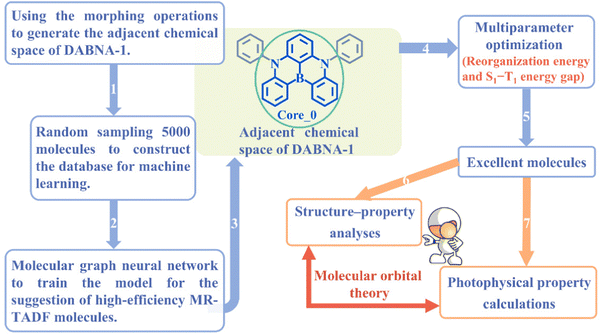 | ||
| Fig. 1 Schematic overview of machine-learning-assisted performance improvements for MR-TADF molecules. | ||
Quantum chemical calculations are perceived as a more cost-efficient alternative to experimental methods. However, large-scale computational screening costs remain substantial, particularly regarding the vibronic coupling and ΔEST calculations for MR-TADF molecules. Here, the strength of vibronic coupling can be characterized by the reorganization energy.6,7 The measure of the vibronic coupling strength (the reorganization energy) requires the calculation of excited state forces.6 The evaluation of ΔEST should be conducted by using the wave function-based methods due to the double-excitation character of electronic transitions.4,14 As a promising approach to address the challenge posed by high-cost calculations and limited computational resources, machine learning (ML) has demonstrated tremendous potential as a valuable tool in the fields of medicinal chemistry, materials chemistry, and organic synthesis.10,15–17 Over the past few years, it has received significant attention and exploration.
In this work, a cost-effective approach is presented to improve the performance of MR-TADF molecules using ML, with DABNA-1 as a representative example. The schematic overview is shown in Fig. 1. First, an ML model was trained with a limited database and subsequently used to predict the properties of the entire adjacent chemical space of DABNA-1. Second, a series of structure–property relationship analyses were conducted for the screened excellent molecules from the perspective of the molecular orbital (MO). Finally, the emission spectra and ISC/RISC rates of DABNA-1 and the top 5 MR-TADF molecules were calculated to validate the effectiveness and practicality of our machine-learning-assisted performance improvement approach.
2. Results and discussion
2.1 Exploring the adjacent chemical space of DABNA-1 using machine learning with molecular graph neural networks
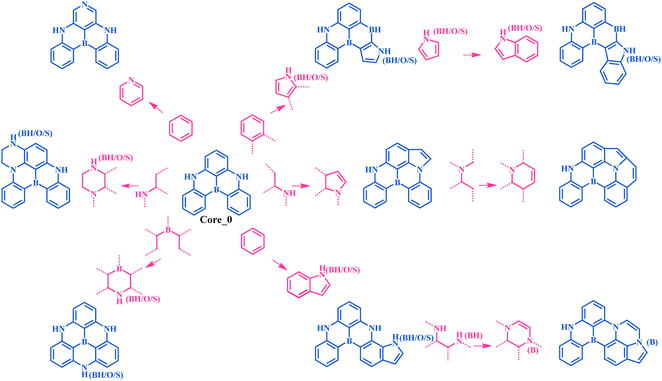
An MR-TADF molecule can generally be fragmented into a molecular backbone (core) and side groups (attached to the core), where the core usually dominates its photophysical properties. To efficiently generate the adjacent chemical space of DABNA-1, we iteratively applied a set of molecular construction rules (Fig. 2), i.e., morphing operations, to its core Core_0 (Fig. 1 and 2). These morphing operations were considered to use the resonance effect of heteroatoms to separate the highest occupied molecular orbital (HOMO) and the lowest unoccupied molecular orbital (LUMO) in the modification of molecular structures. These operations were applied to all possible atomic sites or fragments of the molecules. The generation process was initiated with Core_0 and carried out with 10 cycles of the morphing operations in Fig. 2. This process produced up to 301![[thin space (1/6-em)]](https://www.rsc.org/images/entities/char_2009.gif) 852 molecules within the adjacent chemical space of DABNA-1. It should be noted that all these molecules were constrained with molecular symmetry, as symmetrical molecules always present weak vibronic coupling and are conducive to synthesis.17–19
852 molecules within the adjacent chemical space of DABNA-1. It should be noted that all these molecules were constrained with molecular symmetry, as symmetrical molecules always present weak vibronic coupling and are conducive to synthesis.17–19
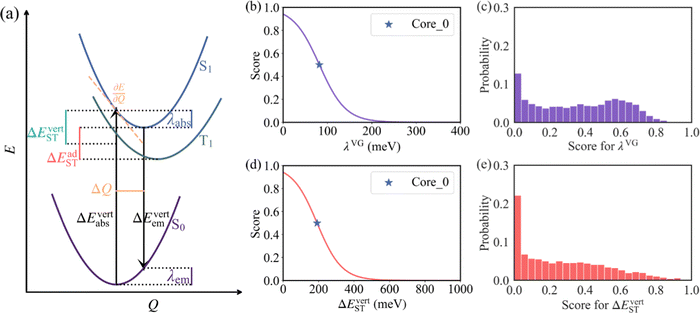
Following the establishment of the adjacent chemical space of DABNA-1, 5000 molecules were randomly selected to construct a database for machine learning. It is commonly believed that molecules with strong structural rigidity usually present a remarkable similarity between their S0 and S1 potential energy surfaces. As a result, the reorganization energy for emission (λem) is nearly equal to the reorganization energy for absorption (λabs) (Fig. 3a).6,20,21 To eliminate the high-cost computational expenses of geometries and vibrational frequencies of the excited state, the reorganization energy under the vertical gradient (VG) approximation at S0 geometry (λVG) as well as the vertical S1–T1 energy gap (ΔEvertST) at S0 geometry (Fig. 3a) were used as descriptors to characterize colour purity and RISC rates, respectively.6 Additionally, the two individual properties (λVG and ΔEvertST) were converted into two single scores ranging from zero to one by using a logistic function (Fig. 3b and d).22 A higher score denotes a better individual property, with a score of above 0.8 indicating exceptional performance. Unfortunately, the calculated score of the two investigated properties of most molecules is below 0.8 (Fig. 3c and e). Here, to reflect the overall excellence of the two parameters of a molecule, the multi-parameter optimization (MPO) score was calculated using the formula  , where ai is the score for the individual property and n is the number of individual properties.22 A high MPO score indicates that all the individual properties of the molecule are favorable.
Furthermore, a molecular graph convolutional network (GCN) was trained by using the database with 5000 molecules, incorporating relevant information such as the atomic number and hybridization, to generate a prediction model.23 The coefficient of determination  and the mean absolute error
  were used to evaluate the GCN model, where EML and EQC denote the model-predicted value and actual value in the test data, respectively, and N represents the number of molecules in the test data.
As shown in Fig. 4a and b, the R2 values of λVG and ΔEvertST are calculated to be 0.77 and 0.72, respectively, while the MAEs of λVG and ΔEvertST are 18 meV and 50 meV, respectively. These results indicate that the prediction model can effectively estimate the two molecular properties. Applying this prediction model throughout the adjacent chemical space of DABNA-1, the top 100 molecules with the highest MPO scores were selected to conduct further quantum chemical validation. The data distributions of the initial 5000 molecules and the predicted top 100 molecules are depicted in Fig. 4c. The MPO scores of the predicted top 100 molecules are around 0.8, which demonstrates that our machine-learning-assisted performance improvement approach is very promising.
2.2 Structure–property analysis of the top 100 MR-TADF molecules
To clarify the structural characteristics of these high-performance MR-TADF molecules, the Morgan circular fingerprints of the top 100 molecules were calculated to compare the structural similarities (Fig. 5a).24 The heatmap analysis shows that these molecular structures can be grouped into three distinct clusters due to the high within-group similarity. This indicates that these molecules are mainly based on three cores, with Core_1 having been identified as a particularly effective MR-TADF core structure.25 To explore the structure–property relationship of these cores, the geometries of singlet and triplet excited states were further optimized to calculate the vibronic coupling strength for emission (λem) and the adiabatic S1–T1 energy gap (ΔEadST).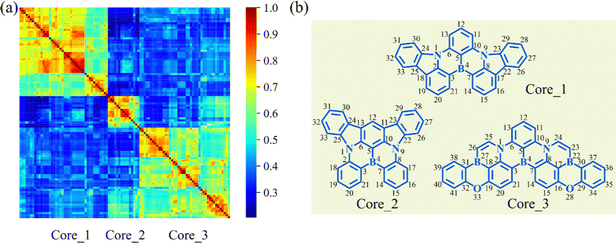 | ||
| Fig. 5 (a) Similarity heatmap for the top 100 MR-TADF molecules. (b) The main core structures for the top 100 molecules. | ||
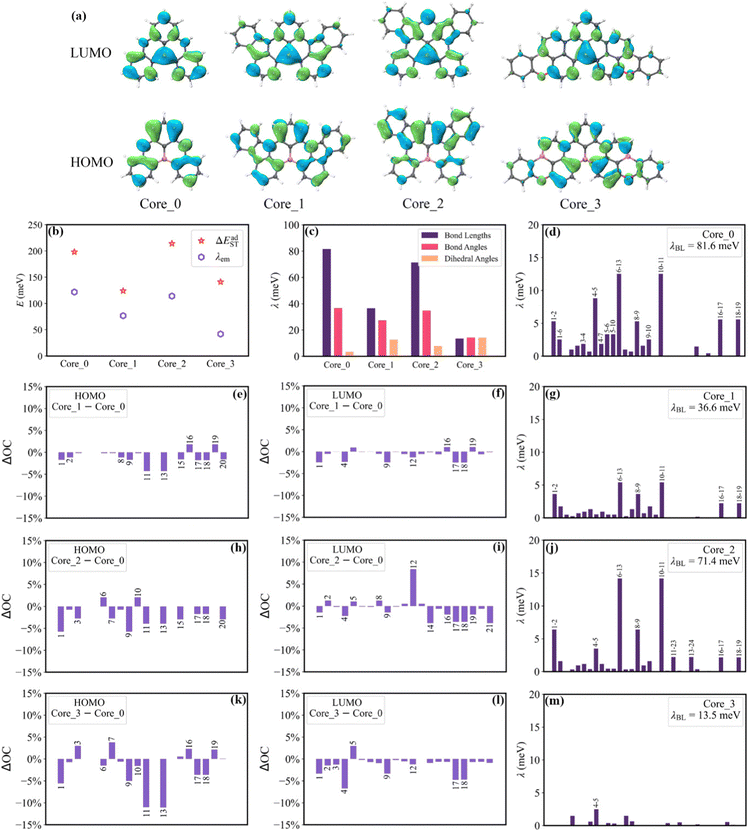
As shown in Fig. 6b, Core_1 and Core_3 present a noticeable decrease in reorganization energy (λem) compared to Core_0. This decrease mainly comes from the bond stretching modes around 1400–1700 cm−1 (Fig. S4, ESI†). To deeply understand the reorganization energy, λem was further decomposed into internal coordinates.26,27 In the internal coordinate representation, λem can be described as the result of alterations in bond lengths, bond angles, and dihedral angles.27 The reorganization energy resulting from alterations in bond lengths (λBL) significantly contributes to the decreased λem from Core_0 to Core_1 and Core_3 (Fig. 6c). Particularly, this decrease in λBL can be primarily attributed to the alterations in the C6–C13 and C10–C11 bonds (Fig. 6d, g, and m). It is worth noting that the bond length is associated with bond order. The bond order between the μth and νth atoms can be written as  , where ni represents the occupation number of the ith MO, Ciμ and Ciν denote the MO coefficients.20,27 Therefore, λBL can be rationalized from the perspective of MO theory, specifically by using λBL ∝ (CLμCLν − CHμCHν)2, where H and L denote the HOMO and LUMO, respectively.20,27 As shown in Fig. 6a, the C6–C13 and C10–C11 bonds show the strong bonding character in the HOMO, while showing the weak bonding character in the LUMO. As molecular conjugation increases from Core_0 to Core_1 and Core_3, there is a noticeable decrease in the HOMO distribution located on the C11 and C13 atoms (Fig. 6e and k). As a result, the C6–C13 and C10–C11 bonds present a decreased bond order difference (associated with bond length alteration) between the S0 and S1 states, thus showing a decrease in λBL.
The ΔEadST values of Core_0, Core_1, Core_2 and Core_3 are calculated to be 198, 124, 214, and 141 meV, respectively. Given that the spatial overlap between the HOMO and LUMO determines the energy gap between the S1 and T1 states.28 The squares of the overlap integral of the HOMO and the LUMO (OverlapHL2) for Core_0, Core_1, Core_2 and Core_3 are calculated to be 13.40 × 10⁻⁴, 7.11 × 10⁻⁴, 9.03 × 10⁻⁴, and 7.07 × 10⁻⁴, respectively. The reduced HOMO distributions on the N1, N9, C11, C13, C17, and C18 atoms, as well as the reduced LUMO distributions on the C17 and C18 atoms (Fig. 6e, f, k, and l), are the main contributors to the decrease in ΔEadST from Core_0 to Core_1 and Core_3.
It should be noted that it is not easy to simultaneously weaken vibronic coupling and decrease ΔEST for the conventional TADF molecules. This is because decreasing ΔEST in conventional TADF molecules is achieved by enhancing the long-distance spatial separation of the HOMO and LUMO. However, this long-range electron density reorganization is accompanied by the strong vibronic coupling (the large reorganization energy).2,3
2.3 Photophysical properties of the top 5 MR-TADF molecules
The top 5 MR-TADF molecules are compared to the three cores to examine their improvement in two significant physical properties. Specifically, M1, M2, and M3 are based on Core_1, M4 is based on Core_2, and M5 is based on Core_3. As the degree of conjugation increases, M1, M2, M3, and M4 present smaller λem and lower ΔEadST compared to their respective corresponding parent structures, while M5 has no evident decrease in λem and ΔEadST compared to Core_3 (Fig. 6b and 7b). Here, the OverlapHL2 for M1, M2, M3, M4 and M5 are calculated to be 5.24 × 10⁻⁴, 4.79 × 10⁻⁴, 5.37 × 10⁻⁴, 7.56 × 10⁻⁴, and 6.02 × 10⁻⁴, respectively. Consistent with the analysis in Section 2.2, the reduced HOMO distribution located on the C11 and C13 atoms (Fig. S7, ESI†) serves as a critical determinant for the differences in λem and ΔEadST between M1, M2, M3, and M4 and their respective corresponding parent structures (Fig. 6b and 7b). Because this reduced HOMO distribution weakens the difference in bond order (associated with λBL) of the C6–C13 and C10–C11 bonds (Fig. S6, ESI†) and decreases the HOMO–LUMO overlap (associated with ΔEadST).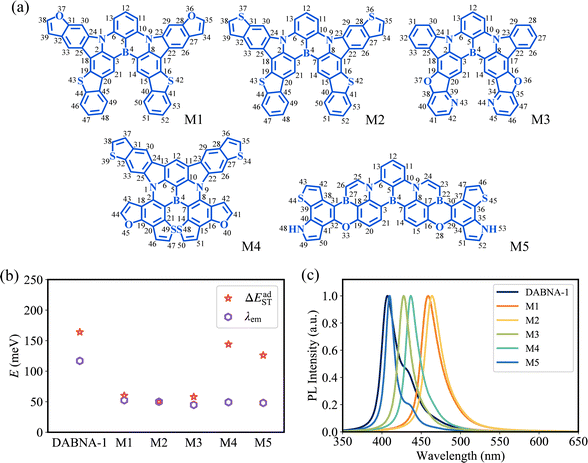 | ||
| Fig. 7 (a) Chemical structures of the top 5 MR-TADF molecules. (b) Calculated λem and ΔEadST. (c) Calculated fluorescence emission spectra. | ||
To visually verify the superior performance of MR-TADF molecules suggested by our machine-learning-assisted approach, the fluorescence emission spectra and ISC/RISC processes from T1 to S1 were studied. With the smaller λem, the top 5 MR-TADF molecules show the weaker vibronic peak (the narrower FWHM) compared to DABNA-1 (Fig. 7c and Table 1), especially for the bottom of the low energy region in emission spectra. As a result, the top 5 MR-TADF molecules show high colour purity. Meantime, based on the smaller ΔEadST, the 5 MR-TADF molecules present an increased ratio of RISC rate kRISC(T1 → S1) to ISC rate kISC(S1 → T1) compared to DABNA-1 (Table 1), which is beneficial to enhance the exciton utilization. In particular, M2 demonstrates a promising future as a high-efficiency MR-TADF molecule. Owing to its ΔEadST of 50 meV, the calculated kRISC(T1 → S1) value of M2 can reach 8.97 × 10⁵ s−1, indicating great potential to avoid efficiency roll-off. It should be noted that the top 5 molecules are demonstrated with high radiative rates (Table 1), although our primary focus during the ML process was not specifically on achieving high radiative rates.
| DABNA-1 | M1 | M2 | M3 | M4 | M5 | |
|---|---|---|---|---|---|---|
| FWHM (meV) | 196 | 161 | 148 | 130 | 134 | 102 |
| k ISC(S1 → T1) (s−1) | 3.52 × 10⁵ | 5.39 × 10⁴ | 3.83 × 10⁶ | 9.34 × 10³ | 1.71 × 10⁵ | 2.56 × 10⁴ |
| k RISC(T1 → S1) (s−1) | 6.64 × 10² | 3.65 × 10³ | 8.97 × 10⁵ | 3.25 × 10³ | 1.76 × 10³ | 3.30 × 10² |
| k r(S1 → S0) (s−1) | 6.72 × 10⁷ | 1.53 × 10⁸ | 1.57 × 10⁸ | 1.77 × 10⁸ | 1.07 × 10⁸ | 4.37 × 10⁸ |
3. Conclusions
To summarize, machine learning was employed to advance the performance of MR-TADF molecules, with a specific focus on improving the colour purity and RISC rate simultaneously. To quantify the two critical properties, λVG and ΔEvertST were considered as descriptors to characterize the colour purity and RISC rate, respectively. Using the molecular morphing operations, the adjacent chemical space of DABNA-1 was generated up to 301![[thin space (1/6-em)]](https://www.rsc.org/images/entities/char_2009.gif) 852 molecules. At an acceptable cost, 5000 molecules were randomly selected from the adjacent space to perform molecular graph neural network learning and generate a prediction model. The prediction model was then used to estimate the molecular properties throughout the adjacent chemical space, achieving R2 of 0.77 and 0.72 for λVG and ΔEvertST, respectively, with the corresponding MAE of 18 and 50 meV. Moreover, the MPO scores of the top 100 molecules suggested by our GCN model are around 0.8, indicating the effectiveness of our approach in identifying high-efficiency MR-TADF molecules.
852 molecules. At an acceptable cost, 5000 molecules were randomly selected from the adjacent space to perform molecular graph neural network learning and generate a prediction model. The prediction model was then used to estimate the molecular properties throughout the adjacent chemical space, achieving R2 of 0.77 and 0.72 for λVG and ΔEvertST, respectively, with the corresponding MAE of 18 and 50 meV. Moreover, the MPO scores of the top 100 molecules suggested by our GCN model are around 0.8, indicating the effectiveness of our approach in identifying high-efficiency MR-TADF molecules.
Our structure–property analysis revealed that the top 100 MR-TADF molecules are mainly based on three core structures, and it is possible to elucidate the reorganization energy and S1–T1 energy gaps through the view of MO theory. The reduced HOMO distribution located on the C11 and C13 atoms serves as a critical determinant for the decrease in λem and ΔEadST from Core_0 to Core_1 and Core_3. Moreover, this reduced HOMO distribution is associated with the decrease in λem and ΔEadST from Core_1 to M1, M2, and M3, as well as from Core_2 to M4. On the other hand, the top 5 MR-TADF molecules show a weaker vibronic peak in the emission spectrum compared to DABNA-1. Notably, M2 with a calculated kRISC(T1 → S1) of 8.97 × 10⁵ s−1 offers an effective solution to efficiency roll-off, thus signifying its potential as a high-efficiency MR-TADF molecule. By integrating molecular structure modification, ML, and insights from MO, we can improve the performance of MR-TADF molecules and gain a deeper understanding of the underlying improvement process.
In the era of artificial intelligence, machine learning plays an important role in discovering novel materials. Numerous efforts have been made to improve the model performance and develop low-cost and effective first-principles descriptors. However, to advance the performance of specific materials, it is crucial to generate the chemical space with high-efficiency molecules through specific morphing operations. It is worth mentioning that an efficient structure–property relationship analysis can guide the development of specific morphing operations.
4. Methods
4.1 Molecular structure and electronic structure calculations
The morphing operations used to generate adjacent chemical space were conducted using the “Reaction SMARTS” method in the RDKit program.17,29 Molecules in this space were represented by the simplified molecular input line entry system (SMILES). With the SMILES string selected to construct the database, the initial molecular geometry was generated by using the MMFF94 force field, and then optimized at the PBE0-D3BJ/def2-SVP level in the Gaussian 16 program.30–35 The reorganization energy under the vertical gradient approximation was evaluated as , where the displacement of the kth mode was calculated by using the gradient of the S1 state at S0 geometry (Q0),
  .20,36 The ΔEvertST at S0 geometry was calculated by using the spin-component scaled second-order approximate coupled cluster (SCS-CC2) method with the cc-pVDZ basis set in the MRCC program.37–39
To perform detailed photophysical property analyses, the S1 and T1 states of DABNA-1, the four cores, and the top 5 MR-TADF molecules were respectively optimized by using the time-dependent density functional theory (TDDFT) and unrestricted DFT in the Gaussian 16 program. The S1 and T1 excitation energies were evaluated at the SCS-CC2/cc-pVTZ level in the MRCC program.38,39 The spin–orbit coupling (SOC) matrix elements between the S1 and T1 states were calculated at the PBE0-D3BJ/def2-SVP level by using the PySOC program.40 The OverlapHL2 was obtained from the Multiwfn program.41
4.2 Photophysical property calculations
Based on Fermi's golden rule, the emission spectrum can be written as42 | (1) |
The radiative decay rate (kr(S1 → S0)) can be obtained from the Einstein spontaneous emission equation44
 | (2) |
The ISC/RISC rate can be calculated as follows:45,46
 | (3) |
4.3 Molecular graph neural network
The graph convolutional network training process was performed by using the Deep Graph Library (DGL) package based on PyTorch.23,47 The propagation process of this network is written as , which means a linear projection (Wl) of the aggregated information
  followed by a non-linear activation function (σ). Ã = A + I is the sum of the adjacency matrix A and the identity matrix I.
 ![[D with combining tilde]](https://www.rsc.org/images/entities/i_char_0044_0303.gif) is the diagonal node degree matrix of Ã. Hl and Wl are the lth neural network layer and its learnable parameters, respectively. In the case of the input layer, Hl corresponds to the molecular node information. Here, the hyperparameter search, including the determination of the number and size of hidden layers, was performed by using Bayesian optimization.48 More details and code are available at https://github.com/Wanlin-Cai/ML_GCN.
is the diagonal node degree matrix of Ã. Hl and Wl are the lth neural network layer and its learnable parameters, respectively. In the case of the input layer, Hl corresponds to the molecular node information. Here, the hyperparameter search, including the determination of the number and size of hidden layers, was performed by using Bayesian optimization.48 More details and code are available at https://github.com/Wanlin-Cai/ML_GCN.
Conflicts of interest
There are no conflicts to declare.Acknowledgements
This work is supported by the National Natural Science Foundation of China (22032004, 22021001, and 21533006).References
- S. Madayanad Suresh, D. Hall, D. Beljonne, Y. Olivier and E. Zysman-Colman, Adv. Funct. Mater., 2020, 30, 1908677 CrossRef CAS.
- J. M. Ha, S. H. Hur, A. Pathak, J.-E. Jeong and H. Y. Woo, NPG Asia Mater., 2021, 13, 1–36 CrossRef.
- D. Hall, K. Stavrou, E. Duda, A. Danos, S. Bagnich, S. Warriner, A. M. Slawin, D. Beljonne, A. Köhler and A. Monkman, Mater. Horiz., 2022, 9, 1068–1080 RSC.
- A. Pershin, D. Hall, V. Lemaur, J.-C. Sancho-Garcia, L. Muccioli, E. Zysman-Colman, D. Beljonne and Y. Olivier, Nat. Commun., 2019, 10, 597 CrossRef CAS.
- V. V. Patil, H. L. Lee, I. Kim, K. H. Lee, W. J. Chung, J. Kim, S. Park, H. Choi, W. J. Son and S. O. Jeon, Adv. Sci., 2021, 8, 2101137 CrossRef CAS.
- S. A. Ahmad, J. Eng and T. J. Penfold, J. Mater. Chem. C, 2022, 10, 4785–4794 RSC.
- W. L. Cai, A. C. Zhao, K. Ren, R. X. He, M. Li and W. Shen, J. Phys. Chem. C, 2019, 123, 17968–17975 CrossRef CAS.
- Z. Pei, Q. Ou, Y. Z. Mao, J. J. Yang, A. L. D. L. Lande, F. Plasser, W. Z. Liang, Z. G. Shuai and Y. H. Shao, J. Phys. Chem. Lett., 2021, 12, 2712–2720 CrossRef CAS PubMed.
- P. K. Samanta, D. Kim, V. Coropceanu and J.-L. Brédas, J. Am. Chem. Soc., 2017, 139, 4042–4051 CrossRef CAS PubMed.
- R. Gómez-Bombarelli, J. Aguilera-Iparraguirre, T. D. Hirzel, D. Duvenaud, D. Maclaurin, M. A. Blood-Forsythe, H. S. Chae, M. Einzinger, D.-G. Ha and T. Wu, et al. , Nat. Mater., 2016, 15, 1120–1127 CrossRef PubMed.
- R. Pollice, P. Friederich, C. Lavigne, G. dos Passos Gomes and A. Aspuru-Guzik, Matter, 2021, 4, 1654–1682 CrossRef CAS.
- X. Zeng, X. Wang, Y. W. Zhang, G. Y. Meng, J. B. Wei, Z. Y. Liu, X. Q. Jia, G. M. Li, L. Duan and D. D. Zhang, Angew. Chem., Int. Ed., 2022, 134, e202117181 CrossRef.
- T. Hatakeyama, K. Shiren, K. Nakajima, S. Nomura, S. Nakatsuka, K. Kinoshita, J. Ni, Y. Ono and T. Ikuta, Adv. Mater., 2016, 28, 2777–2781 CrossRef CAS PubMed.
- S. M. Pratik, V. Coropceanu and J.-L. Brédas, ACS Mater. Lett., 2022, 4, 440–447 CrossRef CAS.
- S. D. Xu, J. L. Li, P. F. Cai, X. L. Liu, B. Liu and X. N. Wang, J. Am. Chem. Soc., 2021, 143, 19769–19777 CrossRef CAS PubMed.
- M. Sumita, K. Terayama, N. Suzuki, S. Ishihara, R. Tamura, M. K. Chahal, D. T. Payne, K. Yoshizoe and K. Tsuda, Sci. Adv., 2022, 8, eabj3906 CrossRef CAS PubMed.
- C. Kunkel, J. T. Margraf, K. Chen, H. Oberhofer and K. Reuter, Nat. Commun., 2021, 12, 2422 CrossRef CAS PubMed.
- C.-C. Wu, E. Y. Li and P.-T. Chou, Chem. Sci., 2022, 13, 7181–7189 RSC.
- M. Uejima, T. Sato, K. Tanaka and H. Kaji, Phys. Chem. Chem. Phys., 2013, 15, 14006–14016 RSC.
- W.-C. Chen and Y.-C. Cheng, J. Phys. Chem. A, 2020, 124, 7644–7657 CrossRef CAS PubMed.
- C. Adamo and D. Jacquemin, Chem. Soc. Rev., 2013, 42, 845–856 RSC.
- H. S. Kwak, Y. An, D. J. Giesen, T. F. Hughes, C. T. Brown, K. Leswing, H. Abroshan and M. D. Halls, Front. Chem., 2022, 9, 800370 CrossRef PubMed.
- M. Li, J. Zhou, J. Hu, W. Fan, Y. Zhang, Y. Gu and G. Karypis, ACS Omega, 2021, 6, 27233–27238 CrossRef CAS PubMed.
- H. L. Morgan, J. Chem. Doc., 1965, 5, 107–113 CrossRef CAS.
- Y. W. Zhang, D. D. Zhang, J. B. Wei, Z. Y. Liu, Y. Lu and L. Duan, Angew. Chem., Int. Ed., 2019, 58, 16912–16917 CrossRef CAS PubMed.
- H. Geng, Y. L. Niu, Q. Peng, Z. G. Shuai, V. Coropceanu and J.-L. Brédas, J. Chem. Phys., 2011, 135, 104703 CrossRef PubMed.
- W. L. Cai, C. Zhong and D. Y. Wu, Mater. Chem. Front., 2023, 7, 3762–3773 RSC.
- Z. Y. Yang, Z. Mao, Z. L. Xie, Y. Zhang, S. W. Liu, J. Zhao, J. R. Xu, Z. G. Chi and M. P. Aldred, Chem. Soc. Rev., 2017, 46, 915–1016 RSC.
- G. Landrum, RDKit: Open-Source Cheminformatics Software (accessed September, 2021) https://www.rdkit.org Search PubMed.
- T. A. Halgren, J. Comput. Chem., 1996, 17, 490–519 CrossRef CAS.
- C. Adamo and V. Barone, J. Chem. Phys., 1999, 110, 6158–6170 CrossRef CAS.
- S. Grimme, J. Antony, S. Ehrlich and H. Krieg, J. Chem. Phys., 2010, 132, 154104 CrossRef PubMed.
- S. Grimme, S. Ehrlich and L. Goerigk, J. Comput. Chem., 2011, 32, 1456–1465 CrossRef CAS PubMed.
- F. Weigend and R. Ahlrichs, Phys. Chem. Chem. Phys., 2005, 7, 3297–3305 RSC.
- M. J. Frisch, G. W. Trucks, H. B. Schlegel, G. E. Scuseria, M. A. Robb, J. R. Cheeseman, G. Scalmani, V. Barone, G. A. Petersson, et al., Gaussian 16 Rev. A.03, Gaussian Inc., Wallingford CT, 2016 Search PubMed.
- F. Santoro and D. Jacquemin, Wiley Interdiscip. Rev.: Comput. Mol. Sci., 2016, 6, 460–486 CAS.
- M. Kállay, P. R. Nagy, D. Mester, Z. Rolik, G. Samu, J. Csontos, J. Csóka, P. B. Szabó, L. Gyevi-Nagy and B. Hégely, J. Chem. Phys., 2020, 152, 074107 CrossRef PubMed.
- O. Christiansen, H. Koch and P. Jørgensen, Chem. Phys. Lett., 1995, 243, 409–418 CrossRef CAS.
- T. H. Dunning Jr, J. Chem. Phys., 1989, 90, 1007–1023 CrossRef.
- X. Gao, S. M. Bai, D. Fazzi, T. Niehaus, M. Barbatti and W. Thiel, J. Chem. Theory Comput., 2017, 13, 515–524 CrossRef CAS PubMed.
- T. Lu and F. Chen, J. Comput. Chem., 2012, 33, 580–592 CrossRef CAS PubMed.
- S. H. Lin, C. H. Chang, K. K. Liang, R. Chang, Y. J. Shiu, J. M. Zhang, T. S. Yang, M. Hayashi and F. C. Hsu, Adv. Chem. Phys., 2002, 1–88 CAS.
- Y. L. Niu, W. Q. Li, Q. Peng, H. Geng, Y. P. Yi, L. J. Wang, G. J. Nan, D. Wang and Z. G. Shuai, Mol. Phys., 2018, 116, 1078–1090 CrossRef CAS.
- R. C. Hilborn, Am. J. Phys., 1982, 50, 982–986 CrossRef CAS.
- Q. Peng, Q. H. Shi, Y. L. Niu, Y. P. Yi, S. R. Sun, W. Q. Li and Z. G. Shuai, J. Mater. Chem. C, 2016, 4, 6829–6838 RSC.
- Z. G. Shuai and Q. Peng, Natl. Sci. Rev., 2017, 4, 224–239 CrossRef CAS.
- A. Paszke, S. Gross, F. Massa, A. Lerer, J. Bradbury, G. Chanan, T. Killeen, Z. Lin, N. Gimelshein and L. Antiga, Adv. Neural Inf. Process. Syst, 2019, 32, 8026–8037 Search PubMed.
- J. Bergstra, D. Yamins and D. Cox, Proc. 30th Int. Conf. Mach. Learn., 2013, pp. 115–123 Search PubMed.
Footnote |
| † Electronic supplementary information (ESI) available. See DOI: https://doi.org/10.1039/d3cp04441f |
| This journal is © the Owner Societies 2024 |

