
Nanoscale insights into graphene oxide reduction by tip-enhanced Raman spectroscopy†
Xiao
You‡
 *a,
Sangita
Maharjan
b,
Kizhanipuram
Vinodgopal
b and
Joanna M.
Atkin
*c
*a,
Sangita
Maharjan
b,
Kizhanipuram
Vinodgopal
b and
Joanna M.
Atkin
*c
aDepartment of Applied Physical Science, University of North Carolina at Chapel Hill, Chapel Hill, USA. E-mail: youxiao@westlake.edu.cn
bDepartment of Chemistry, North Carolina Central University, Durham, USA
cDepartment of Chemistry, University of North Carolina at Chapel Hill, Chapel Hill, USA. E-mail: jatkin@email.unc.edu
First published on 3rd January 2024
Abstract
Graphene oxide (GO) has attracted substantial interest for its tunable properties and as a possible intermediate for the bulk manufacture of graphene. GO and its reduced derivatives display electronic and optical properties that depend strongly on their chemical structure, and with proper functionalization, GO can have a desirable bandgap for semiconductor applications. However, its chemical activity leads to a series of unclear chemical changes under ambient conditions, resulting in changes in color and solubility upon exposure to light. In this paper, we study the properties of fresh and spontaneously reduced GO under ambient conditions using tip-enhanced Raman spectroscopy (TERS) to map its nanometer scale chemical and structural heterogeneity. We observe different types of defect sites on reduced GO (rGO) by spatially mapping the D to G band peak ratio and D and G band spectral positions. The higher spatial resolution and out-of-plane polarization compared to conventional micro-Raman spectroscopy enables us to resolve unusual features, including D-band shifting on rGO. Based on statistical analysis of the spatial variations in modes and theoretical calculations for different functional groups, we conclude the reduction mechanism of GO is a self-photocatalytic reduction with the participation of water and visible light, in which the rate determining step is electron transport through the metal substrate and ion diffusion on the GO surface. These results demonstrate that TERS can reveal structural and chemical details elucidating reduction mechanisms, through the examination of samples at different time points.
1 Introduction
Graphene oxide (GO) has drawn interest in the past decade as a possible pathway to economical, large-scale synthesis of graphene. In addition, reduction of GO gives control over the oxygen content and sp2 conjunction ratio, which can be used to tune the physical and chemical properties of GO films.1–5 Reduced graphene oxide (rGO) is frequently considered to be graphene with defects, but the nature of these defects is important to engineering desirable electronic and optical properties.6,7 For example, rGO with oxygen functional groups can be extremely useful in energy storage devices as it may have not only an electric double layer capacitance but also a pseudocapacitance.8,9 However, the detailed structures of GO derivatives are not well understood due to the chemical and structural complexity of GO and rGO. Moreover, unlike chemically stable pristine graphene, the interesting interfacial and surface properties of GO and rGO are accompanied by chemical reactivity associated with the functional groups on the carbon plane, such as epoxides, ketones, ethers, and peroxides, as well as structural irregularities such as grain boundaries, folding, and buckling.10–14 Fully understanding GO's structure and chemical reactivity can have benefits in many applications, such as in controlled assembly of rGO,15 water splitting, and CO2 reduction.16,17Micro-Raman spectroscopy, though a powerful tool for the study of sp2 carbon systems due to the large Raman cross-section of delocalized conjugated bonds, is limited to providing an averaged signal within the large laser spot size. This resolution limit has severely hindered characterization of the structural and chemical heterogeneity in GO and rGO, which exhibit variations over length scales ranging from the molecular to tens of nanometers. In Raman spectra of pristine graphene, characteristic peaks include the G-band around 1580 cm−1 and the G′ (or 2D) band at 2700 cm−1, but in chemically or structurally disordered graphene and graphene oxide a D-band emerges close to 1350 cm−1. Researchers often employ the relative intensity of the D and G bands (ID/IG) as an indicator of disorder, particularly for assessing the degree of reduction in GO. Nonetheless, samples with the same level of oxidation can exhibit significantly different ID/IG ratios, as different reduction methods can either reduce or increase the number of defects.18–20
Tip-enhanced Raman scattering (TERS) combines atomic force microscopy (AFM) with a plasmonically-enhanced Raman signal, enabling spatial resolutions from a few nanometers down to single chemical bond levels.21–26 Therefore TERS presents a promising technique for resolving structural disorder in GO systems. The exceptional spatial resolution of TERS has enabled imaging of local defects, strain, and grain boundaries in graphene and carbon nanotubes with exquisite sensitivity.27–31 However, for GO and rGO, TERS faces a bottleneck in data analysis and interpretation due to the high degree of disorder, and modification of the selection rule in TERS compared to conventional Raman spectroscopy. Previous measurements on these systems have relied on samples with defined moieties such as carboxyl-modified GO, and studied the absolute and relative intensities of the D and G bands.32,33 In complex systems, this form of intensity analysis in TERS may not reveal chemical information, due to the sensitivity of the Raman enhancement to variable sample thickness, roughness of the underlying metal substrate, and variations in the coupling of tip and surface.34
Here, we therefore investigate the nanoscale spectral properties of graphene oxide and reduced graphene oxide, with particular focus on frequency shifts in the D and G band, which we find to be related to disordered topographic features. We perform statistical analysis on the spatial variations in the peak positions, and use density functional theory (DFT) to associate the variations with chemical defects and functional groups. Based on the correlated topographic and spectral variations we observe, we propose that the self-reduction mechanism of GO is a photocatalytic process with the participation of water and visible light, which produces a more defected sp2 lattice in folded, wrinkled, or multilayer regions than in single layer regions. This analysis approach demonstrates the potential of TERS for understanding disorder in complex functional materials and their structural evolution, as well as providing a pathway to controlled reduction in graphene oxide systems for catalytic and electronic applications.
2 Experimental
We prepare GO by the Hummers' method (see Methods), one of the most common reaction paths to obtain GO. In Hummers' method, graphite is first reacted with strong acids and oxidants and then sonicated and mixed with H2O2, resulting in chemically oxidized and exfoliated graphite. Freshly synthesized GO is a beige-colored flocculent solid that easily disperses in polar solvents, such as water and alcohol. However, if stored under ambient conditions, GO powder gradually turns a darker color (Fig. 1) and loses its solubility in water. Similarly, for GO stored in solution, the initial clear yellow solution turns brown and precipitates after a few days of settling. These observations indicate that the GO has lost polar functional groups, likely accompanied with other structural changes. Remarkably, we observed that this transformation occurs exclusively when freshly prepared GO is exposed to light. In contrast, when stored in the dark, bulk GO remains stable for an extended period, maintaining its solubility and pale color. This strongly indicates that the observed chemical change is light-induced. To elucidate the underlying causes and structural modifications, we designed experiments focusing on the time-dependent evolution of GO under ambient conditions. | ||
| Fig. 1 (a) XPS of GO, spontaneously reduced GO (rGO1), and chemically-reduced GO (crGO) with peak fitting of different carbon bonded species. The derived oxygen percentage is labeled for each spectrum. (b) Percentage of sp2 carbon (red), carboxyl (blue), hydroxyl and carbonyl (green) groups, and total oxygen (black), extracted from the fits in (a) for the three samples. This analysis shows the reduction in oxygen-containing functional groups from the fresh to reduced samples. (c) Micro-Raman spectra and optical images for the GO, rGO, and crGO samples in (a) and (b). | ||
For our experiments, we dissolve freshly synthesized GO in ethanol and deposit it onto Au sputtered substrates. The good solubility of GO in ethanol yields a well dispersed sample, with single to few layer regions. One sample was measured shortly after deposition. A second sample, designed rGO1, was stored under ambient conditions for seven days before measurement. The third sample, rGO2, was stored for 30 days to achieve partial reduction. Incomplete reduction leaves behind a moderate amount of residual oxygen-bearing species and defects, which provide an ideal platform for study of GO's chemical properties.
To estimate the chemical composition, we conducted X-ray photoelectron spectroscopy (XPS) on GO and spontaneously reduced GO (rGO), with chemically reduced GO as a standard for comparison (crGO). Previous studies on the C 1s XPS spectrum of GO show four components that correspond to carbon atoms in different functional groups: the non-oxygenated ring C, the C in C–O single bonds, the carbonyl C and the carboxylate carbon (O–C![[double bond, length as m-dash]](https://www.rsc.org/images/entities/char_e001.gif) O) at 284.6, 286.2, 287.8 and 289.0 eV respectively, showing in Fig. 1a.1 In crGO, the C 1s peak at around 287 eV decreases in intensity and is red-shifted following chemical reduction, indicating a chemical conversion of the CO and C–OH groups to a new chemical species. In the rGO sample, however, this peak is significantly weaker, without peak shifting. The decrease of these peaks indicates loss of oxygen and the related functional groups. By curve fitting analysis of the XPS results, we can determine the percentage of the various functional groups (Fig. 1b) and oxygen (black). These results provide proof of partial reduction in rGO, though less so than the chemically-reduced crGO.
O) at 284.6, 286.2, 287.8 and 289.0 eV respectively, showing in Fig. 1a.1 In crGO, the C 1s peak at around 287 eV decreases in intensity and is red-shifted following chemical reduction, indicating a chemical conversion of the CO and C–OH groups to a new chemical species. In the rGO sample, however, this peak is significantly weaker, without peak shifting. The decrease of these peaks indicates loss of oxygen and the related functional groups. By curve fitting analysis of the XPS results, we can determine the percentage of the various functional groups (Fig. 1b) and oxygen (black). These results provide proof of partial reduction in rGO, though less so than the chemically-reduced crGO.
Micro-Raman spectroscopy can provide spatially-resolved spectral information, and is therefore a valuable complementary tool to XPS. However, although XPS clearly registers significant variations in chemical composition in samples from different preparations, the Raman spectra all look nominally very similar (Fig. 1c), with only a small decrease in ID/IG ratio for the chemically reduced sample. Therefore this commonly used ratio is not a reliable parameter for the degree of chemical reduction. We overcome this limitation of far-field optical probes by employing tip-enhanced Raman scattering (TERS), using a commercial atomic force microscope (AFM)-Raman system (Horiba). We use silicon AFM tips, sputtered with gold, to generate the necessary plasmonic enhancement for high sensitivity and spatial resolution. Details on the tip fabrication and measurement parameters are provided in the ESI.†
3 Results
AFM and TERS images of rGO1 and rGO2 are shown in Fig. 2 and 3, with example spectra in the ESI† (Fig. S1 and S2). The AFM topographic image of rGO1 (Fig. 2a) shows a region with a flake possessing various signs of heterogeneity including wrinkles, edges, and a bilayer region formed by self-folding of the sheet. Fig. 2b shows the variation in the G band spectral position, with defects such as wrinkles and folds correlated with a small blue shift in the mode. This is consistent with previously observed changes in the G-band position in micro-Raman spectroscopy and TERS due to defects and different numbers of layers.35–37 The D-band position, however, displays an even clearer peak shift between the folded area and the flat region on a single flake, which has not to our knowledge been previously observed (Fig. 2c). The ID/IG ratio, obtained by dividing the D-band peak area by the G-band peak area (Fig. 2b), highlights the edges and wrinkles, which have been proven to have more defects and diverse functional groups than the interior of a pristine graphene flake.3 In GO, however, this interpretation is complicated due to peak shifts and several possible contributions to the D and G bands.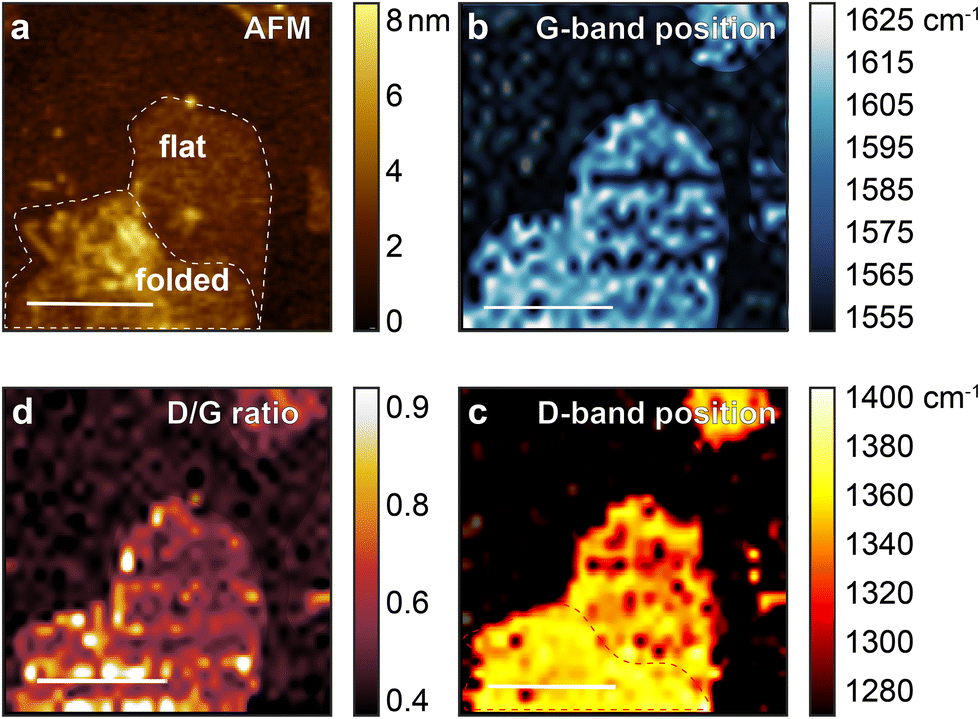 | ||
| Fig. 2 (a) AFM image of rGO1 (reduced for seven days) on a gold surface, showing a large flake with wrinkles and folded region on the bottom left on the image. TERS map of rGO1, showing (b) the distribution of the G-band position, close to 1600 cm−1 Raman shift. (c) D-Band peak position shift, at close to 1350 cm−1, and (d) the area ratio of D-band and G-band modes, ID/IG. Scale bar 1 μm. | ||
 | ||
| Fig. 3 (a) AFM image of sample rGO2 on gold surface. TERS mapping of the region in (a) based on (b) the G-band position, (c) D-band position, and (d) ID/IG ratio. | ||
These spatial variations are even more clearly resolved in the sample rGO2, reduced for 30 days. In particular, the flake on the bottom right shows a clear distinction between a folded and flat region in the D-band position, while the D/G ratio remains relatively constant aside from the wrinkled area.
For comparison, TERS images of the fresh GO are shown in the Fig. S3 (ESI†). In the area marked in the AFM image of GO (Fig. 3a), D and G band peak positions and their intensity ratios (ID/IG) are shown in Fig. 3b–d. While the ID/IG ratio map highlights the edge and wrinkles on the GO flake, similar to the features of the rGO, the band position map (Fig. 3b and c) is more homogeneously distributed than rGO, with no regions of clearly distinct spectral variations. In spite of this lack of consistent peak shifts, the spectral distributions still suggest significant chemical heterogeneity. We note that the intensity maps for the D- and G-band, shown in Fig. S4 and S5 (ESI†) for GO and rGO respectively, are strongly correlated. That is, the regions of high intensity for D-band occur at the same spatial positions as for the G-band, suggesting that the only distinguishable intensity variations are due to differences in tip-sample coupling, likely to be dominated by the roughness of the substrate.
We statistically analyzed the spatially-resolved spectra to collect peak position data in the range 1250–1400 and 1550–1650 cm−1 from the TERS maps. To better resolve the detailed chemical structures of reduced GO, we separated the observed D-band positions from different regions of the rGO1 (Fig. 2c) and rGO2 samples (Fig. 3c) and the GO flake (Fig. S3d, ESI†). The plotted histograms of D-band and G-band peak positions in these two samples are compared in the supplement. We observe that the D-band has a large peak shift in rGO2 (red) compared to GO (black). The D-band peak frequencies are also significantly more distributed in rGO1 and rGO2 than in GO, implying increased chemical heterogeneity. The G peak position in contrast is only slightly red-shifted in rGO2, and displays a similar distribution. Since G band peak positions are related to properties such as the number of graphene layers and point defects and have been previously discussed,35,36 we focus here on the D-band.
Based on the box plots in Fig. 4, we can see that the spread in peak position is relatively narrow in GO, and shows no systematic variation between flat, edge, and wrinkled regions. In rGO, in contrast, the different regions show very different average peak positions and distributions. The spread in the peak position even for a flat region in rGO1 and rGO2 is considerably larger than a comparable region in GO, although the averages are similar. In rGO1, the edge region has a blue-shift in the D-band peak position, with an even larger shift in the folded region. A similar trend is observed in rGO2, but with an even larger shift at the edges and folded regions, with the mean peak position moving from 1350 cm−1 to 1360 cm−1 with increased reduction time. This observation suggests that reduction proceeds inhomogeneously across the surface of GO, occurring preferentially at folded regions. Both edges and wrinkles also have large spreads in peak positions, consistent with the higher density of functional groups expected in these regions compared to flat regions.
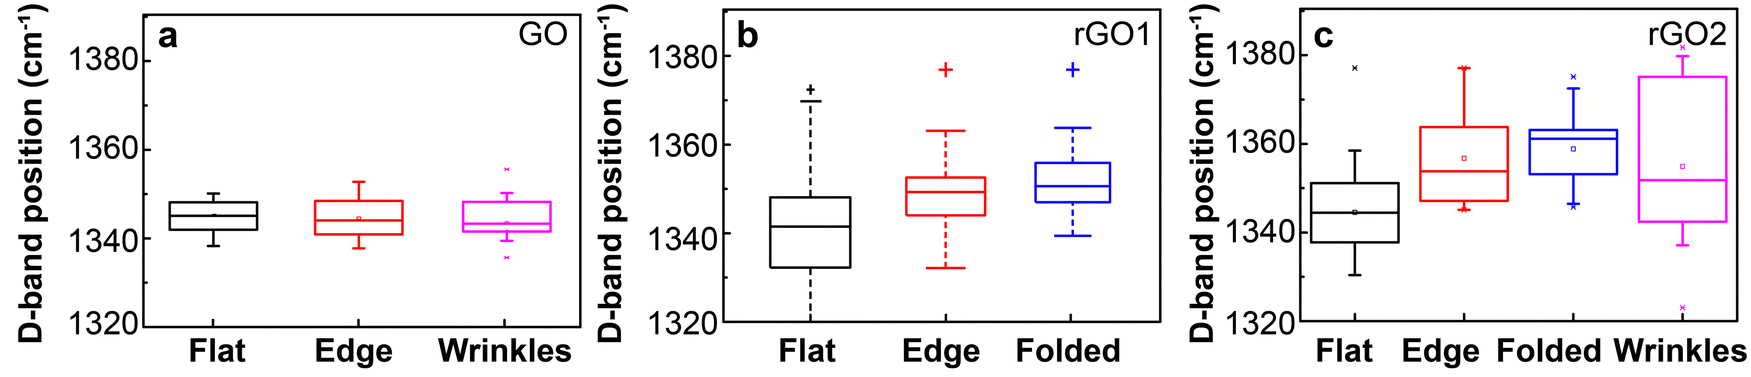 | ||
| Fig. 4 Box plots for D-band peak position in samples of fresh (a) GO, (b) rGO1, and (c) rGO2. The box indicates median, 25th quartile, and 75th quartile for each region, with whiskers indicating minimum to maximum. Outliers are represented with dots. Significant variations are observed for different topographic features in rGO1 and rGO2, where the distributions are relatively consistent in GO. Blue-shifts, in particular at edges and on folded regions, increase with increasing reduction time, from rGO1 to rGO2. | ||
Understanding the chemical and structural variations corresponding to the differences we observe experimentally is challenging. Key elements responsible for the emergence of the D band in graphene include lattice defects, phonon–phonon interactions, and double resonance processes that involve electron–phonon interactions and scattering by defects.38–40 Moreover, the double resonance process involves four distinct double resonance Raman scattering mechanisms, comprising outer and inner scattering processes, as well as scenarios where electrons are initially scattered by phonons (referred to as “phonon-first”) or by defects (termed “defect-first”). These processes give rise to two sub-bands within the D band and involve intricate interactions between electrons, phonons, and defects that significantly influence the characteristics of the D band.41 Collectively, these elements define the distinct spectral signature of the D band in Raman spectroscopy. These factors cannot be easily deconvolved in a complex, disordered material such as rGO. To provide further insights into the observed shifts in the D band, we therefore employed density functional theory to model the functional groups present in GO at the atomic and electronic levels.
3.1 Density functional theory
DFT has been used to study the influence of number of layers and possible stacking structures on Raman modes in graphene,42,43 and results have shown overall good agreement with experiment studies.35,44 To date there has been relatively little study of disorder-related Raman modes in GO and rGO.45 To understand how chemical functionalization can influence Raman spectra and aid in interpretation of our TERS results, we therefore perform DFT analysis on chemically modified graphene. Note that the double-resonance mechanism leading to the emergency of the D-band is not accounted for in the DFT-calculated spectra. However, when numerous defects are present on a graphene sheet, this issue may be alleviated by the disruption of translational symmetry.As a first step, we must establish which defects and moities are likely to be most significant in our samples. X-ray diffraction and scanning tunneling microscopy structural studies of GO have indicated that the center of GO is mainly functionalized with hydroxyl and epoxy groups,10,46 with other groups such as ketones and ethers along the edges.47 Considering that the size of a GO flake is usually in the μm range, the influence of the more diverse edge groups on the overall phonon mode can be neglected in our calculations. Considering only the center of a GO flake, we can idealize GO and rGO as a graphene lattice with defects that contain C–O and CO bonds at a ratio of one oxygen atom per eight carbon atoms, consistent with our XPS results. Thus we build two models for GO, treating it as a hexagonal graphene lattice with one added oxygen-containing group, either epoxy or hydroxyl, every eight carbon atoms (Fig. 5a).
 | ||
| Fig. 5 (a) Models of GO models and rGO used for DFT calculation, featuring epoxy and hydroxyl moities for GO, and carbon vacancies and sp3 conjugation in rGO. (b) Calculated Raman spectra based on the models in (a). The black spectrum shows the predicted G-band for pristine graphene, consistent with experiment. Both chemical moities (red, blue) cause small shifts in the G-band, and the appearance of additional peaks, with the strongest peaks in the 1300–1400 cm−1 range. C vacancies lead to significant weakening of the G-band and the appearance of a strong mode just below 1400 cm−1, as expected for defective graphene. sp3 defects (purple) produce a strong mode at 1300 cm−1 but also a lower-frequency mode close to 1100 cm−1. | ||
For rGO, electron microscopy studies suggest that it consists of defect-free graphene areas with sizes of a few to ten nanometers interspersed with defect areas with disordered carbon networks (remnants of oxygen containing groups), individual ad-atoms or substitutions, isolated topological defects (single bond rotations or dislocation cores) and holes and edge reconstructions.48 Previous studies also show that the reduction of GO results in both a restored C-sp2 region, and C-sp2 with defects.46 The most common defects in rGO are the C-sp3 and carbon vacancies. Thus the two rGO models we employ consist of graphene lattices with added C-sp3 and removal of one carbon atom every eight carbon atoms, respectively.
Prior to calculation of the theoretical Raman spectra, the most probable geometries of the sample are modeled in Materials Studio (2017 R2). These structures are geometry optimized and then Raman modes are calculated using the CASTEP package with GGA functional and the PBE basis set.
Our calculation of pristine graphene produces the expected E2g mode at a vibrational frequency 1588.4 cm−1, which is in good agreement with the experimental Raman spectrum of pristine graphene (G-band peak position at 1587 cm−1) (Fig. 5b, black.) A complete restoration of the sp2 π-conjugated network in rGO should generate only the G band.
The calculation of Raman spectra of GO with epoxy groups (red) and hydroxyl groups (blue) shows a shift in the G-band and the appearance of additional modes in the standard D-band spectral range of 1300–1400 cm−1. For the rGO models, the disturbance in the sp2 π-conjugated network due to missing carbon atoms causes the G-band to be significantly weaker than pristine graphene, and a strong peak between 1350–1400 cm−1 appear (green). The relative strengths of the D and G band in this calculation suggest that the true concentration of C vacancies is lower than our model. The addition of sp3 defects in the lattice produces two strong modes, at around 1100 and 1300 cm−1 in addition to the G-band (purple). We did not observe a strong vibrational mode at 1100 cm−1 in our samples, suggesting that sp3 defects do not appear in significant quantity. These modes have been previously observed, however, in amorphous and nanocrystalline sp3 carbon,49 and thermally reduced GO.50
Our experimentally-observed D-band likely arises due to contributions from epoxy, hydroxyl, and C vacancies, producing broad, overlapping spectra where even the small probe volume in TERS likely contains many defects. These DFT results can provide hints of the origin of our observed D-band shifting, in spite of our inability to separate all the possible spectral contributions. In particular, we note that the conversion of some epoxy groups to hydroxyl would blue-shift the D-band, while carbon atom vacancies result in greater blue shifts than either of the functional groups.
4 Discussion
The TER spectra from the folded region in rGO displayed a significant blueshift and broader distribution of peak frequencies, indicating a reduction in the folded region with more carbon vacancy defects compared to the flat region, which exhibited a better-restored carbon sp2 π-conjugated network (Fig. 2). The fact that carbon bonds are unevenly restored in rGO is particularly intriguing and can help us deduce the mechanism of spontaneous reduction of GO.Dimiev et al. proposed several transformation schemes for GO production during exposure to water, suggesting the formation of double bonds at the expense of tertiary alcohols and C–C bond rupturing.51 While their mechanism explains certain experimental observations, such as the extension of conjugated areas and the acidic properties of GO, our experimental results, including XPS and Raman data (Fig. 1a),indicate a clear trend of the reduction of the oxygen-to-carbon ratio and an increase in sp2 domain and C vacancy defects. This observation, supported by TERS and DFT results, differs from Dimiev et al.'s proposed mechanism. Moreover, both the oxidation of graphite and the reduction of GO resulted in the production of CO2 gas, as confirmed by gas chromatography.51,52 However, the stability of the C–C bond at room temperature suggests its resilience to breakage without additional energy input. This implies that the generation of CO2 in the reduction process depends on the excitation energy and stability of the local structure. Notably, the mechanisms proposed in earlier studies do not provide a satisfactory explanation for the observed release of CO2.
Previous studies have highlighted GO's involvement in self-assembly on an active metal15 and its photocatalytic reduction under laser irradiation.52–54 Importantly, photoreduced graphene oxide serves as an effective electron mediator for water splitting under visible light irradiation.16,55,56 Expanding on these insights, we propose a distinctive perspective based on previously proposed schemes and our experimental results: the spontaneous reduction of GO is a water-mediated, self-photocatalytic process under visible light. Illumination generates hole–electron pairs in GO's sp2 domains, leaving hydroxyl groups (structure 1 in Fig. 6b) as intermediates on the GO plane. The gold substrate facilitates electron transfer to the doped domain. Subsequent electron transfer reduces epoxy groups to hydroxyl, producing radical intermediates (structure 2) and OH−. These radicals, in conjunction with hydroxyl groups, further react with holes and water, forming additional hydroxyls. A GO fragment containing a 1,2-diol (structure 3) is then reduced, restoring a carbon sp2 conjugated domain, shown as structure 4 in Fig. 6b.
 | ||
| Fig. 6 Spontaneous reduction mechanism deduced based on nano-localized spectral variations. (a) Schematic representation of interaction of electrons and water molecules on surface to facilitate GO reduction. (b) Additional steps that may contribute to observed experimental results. Protonation of ether to produce hydroxyl functional groups. Reduction of C–OH and production of oxygen, the dominant process on single layer GO, which results in a fully-restored C lattice. Reduction of 2 C–OH and production of carbon dioxide, a possible process on folded regions of GO that produces C vacancies in the lattice. | ||
The hydrophilic nature of GO allows efficient noncovalent intercalation of moisture between layers.57 This suggests that the reduction process can occur more efficiently between layers, with a faster interlayer reduction in folded regions compared to flat regions. Furthermore, closely situated hydroxyl groups can undergo simultaneous reduction to form lower energy structures, producing CO2 and causing disruption in the carbon lattice, along with deoxygenation (Fig. 6 structure 5). These variations in reduction rate and mechanism between interlayer and intralayer reduction would contribute to the observed spectral features in the folded and flat regions of spontaneously reduced GO.
High-resolution chemical mapping through Tip-Enhanced Raman Scattering (TERS) offers valuable insight into the structure of the final reduced GO form and its potential configuration, and thereby the mechanisms of reduction. Nevertheless, to gain a comprehensive understanding of intermediates, such as radicals or electron–hole pairs, and to elucidate the precise pathway of GO's spontanous reduction process, the use of time-resolved spectroscopy becomes imperative.
5 Conclusions
The self-reduction of GO is the product of numerous chemical transformations, which occur when the GO is exposed to air and light. These transformations are responsible for changes in color, acidic properties, and solubility due to alterations in surface chemical compositions.In this study, we used correlated analysis of hyperspectral TERS imaging to investigate the spontaneous reduction of graphene oxide (GO) under ambient conditions. We obtained TERS maps on fresh and spontaneously reduced GO at two time points. D-band shifting associated with functional group variations within a rGO flake was observed for the first time. By combining TERS mapping with DFT calculations, we were able to associate the observed spectral distributions with chemical and structural disorder within reduced GO. Based on the uneven distribution of epoxy groups and carbon defects, we proposed a mechanism for the self-reduction behavior of GO, which involves a water-mediated self-photocatalytic reduction and deoxygenation process, where GO serves as both reactant and photocatalyst. The multiple reaction pathways of reduction were proposed based on the spatial distribution of epoxy groups and carbon defects, as well as the structural changes that occur during reduction. Despite proposing reduction pathways and explaining their end products, uncertainties remain about all intermediates involved in the reactions, which would be challenging to address in these studies. Identifying the intermediates and comprehensively characterizing the reduction mechanisms would necessitate higher time-resolution spectroscopy studies capable of capturing hydroxyl free radicals (HO˙), hydroxide ions OH−, and other unstable intermediates. Understanding the reduction mechanisms of GO is potentially beneficial to identifying the optimal conditions for controlled reduction, such as the type of solvent, the pH, and the temperature. This knowledge can then be used to improve the quality and uniformity of reduced GO, which is essential for its application in devices.
Our findings provide new insights into the spontaneous reduction of GO under ambient conditions. They also highlight the potential of TERS imaging for the investigation of disordered materials. Combined tip-enhanced Raman scattering mapping, statistical analysis, and DFT calculation of Raman modes improved the interpretation of highly-heterogeneous TERS data. With more detailed data analytical methods, it is possible to broaden the application of TERS to sample systems without well-separated spectral signatures, pushing TERS beyond structural characterization to spatially resolve local variations in chemical reactions. This form of time-dependent, nanoscale imaging can therefore elucidate reaction and degradation mechanisms in a wide variety of catalytic and electronic materials.
Conflicts of interest
There are no conflicts to declare.Acknowledgements
The authors thank Andrey Krayev for assistance with the Horiba instrument. This material is based upon work supported by the National Science Foundation under Grant no. CHE-1848278. KV acknowledges the support of the National Science Foundation Division of Materials Research, under Grant no. DMR-1523617, and NSF HRD-1829245. Part of this work was performed at the Chapel Hill Nanofabrication and Analysis Laboratory, a member of the North Carolina Research Triangle Nanotechnology Network (RTNN), which is supported by the National Science Foundation, Grant ECCS-1542015, as part of the National Nanotechnology Coordinated Infrastructure (NNCI).References
- D. R. Dreyer, S. Park, C. W. Bielawski and R. S. Ruoff, The chemistry of graphene oxide, Chem. Soc. Rev., 2010, 39, 228–240 RSC.
- K. P. Loh, Q. Bao, G. Eda and M. Chhowalla, Graphene oxide as a chemically tunable platform for optical applications, Nat. Chem., 2010, 2, 1015–1024 CrossRef CAS PubMed.
- M. P. McDonald, A. Eltom, F. Vietmeyer, J. Thapa, Y. V. Morozov, D. A. Sokolov, J. H. Hodak, K. Vinodgopal, P. V. Kamat and M. Kuno, Direct observation of spatially heterogeneous single-layer graphene oxide reduction kinetics, Nano Lett., 2013, 13, 5777–5784 CrossRef CAS PubMed.
- N. Morimoto, T. Kubo and Y. Nishina, Tailoring the Oxygen Content of Graphite and Reduced Graphene Oxide for Specific Applications, Sci. Rep., 2016, 6, 21715 CrossRef CAS PubMed.
- S. Park and R. S. Ruoff, Chemical methods for the production of graphenes, Nat. Nanotechnol., 2009, 4, 217–224 CrossRef CAS PubMed.
- L. Lai, H. Yang, L. Wang, B. K. Teh, J. Zhong, H. Chou, L. Chen, W. Chen, Z. Shen, R. S. Ruoff and J. Lin, Preparation of supercapacitor electrodes through selection of graphene surface functionalities, ACS Nano, 2012, 6, 5941–5951 CrossRef CAS PubMed.
- Y. J. Oh, J. J. Yoo, Y. I. Kim, J. K. Yoon, H. N. Yoon, J. H. Kim and S. B. Park, Oxygen functional groups and electrochemical capacitive behavior of incompletely reduced graphene oxides as a thin-film electrode of supercapacitor, Electrochim. Acta, 2014, 116, 118–128 CrossRef CAS.
- Y. Chen, X. O. Zhang, D. C. Zhang, P. Yu and Y. W. Ma, High performance supercapacitors based on reduced graphene oxide in aqueous and ionic liquid electrolytes, Carbon, 2011, 49, 573–580 CrossRef CAS.
- Z. Y. Lin, Y. Liu, Y. G. Yao, O. J. Hildreth, Z. Li, K. Moon and C. P. Wong, Superior Capacitance of Functionalized Graphene, J. Phys. Chem. C, 2011, 115, 7120–7125 CrossRef CAS.
- W. Gao, L. B. Alemany, L. J. Ci and P. M. Ajayan, New insights into the structure and reduction of graphite oxide, Nat. Chem., 2009, 1, 403–408 CrossRef CAS PubMed.
- A. Bagri, C. Mattevi, M. Acik, Y. J. Chabal, M. Chhowalla and V. B. Shenoy, Structural evolution during the reduction of chemically derived graphene oxide, Nat. Chem., 2010, 2, 581–587 CrossRef CAS PubMed.
- C. Bartlam, S. Morsch, K. W. J. Heard, P. Quayle, S. G. Yeates and A. Vijayaraghavan, Nanoscale infrared identification and mapping of chemical functional groups on graphene, Carbon, 2018, 139, 317–324 CrossRef CAS.
- L. J. Cote, F. Kim and J. Huang, LangmuirBlodgett Assembly of Graphite Oxide Single Layers, J. Am. Chem. Soc., 2009, 131, 1043–1049 CrossRef CAS PubMed.
- X. Wei, L. Mao, R. A. Soler-Crespo, J. T. Paci, J. Huang, S. T. Nguyen and H. D. Espinosa, Plasticity and ductility in graphene oxide through a mechanochemically induced damage tolerance mechanism, Nat. Commun., 2015, 6, 8029 CrossRef CAS PubMed.
- C. Hu, X. Zhai, L. Liu, Y. Zhao, L. Jiang and L. Qu, Spontaneous reduction and assembly of graphene oxide into three-dimensional graphene network on arbitrary conductive substrates, Sci. Rep., 2013, 3, 2065 CrossRef CAS PubMed.
- A. Iwase, Y. H. Ng, Y. Ishiguro, A. Kudo and R. Amal, Reduced graphene oxide as a solid-state electron mediator in Z-scheme photocatalytic water splitting under visible light, J. Am. Chem. Soc., 2011, 133, 11054–11057 CrossRef CAS PubMed.
- K. Iwashina, A. Iwase, Y. H. Ng, R. Amal and A. Kudo, Z-schematic water splitting into H2 and O2 using metal sulfide as a hydrogen-evolving photocatalyst and reduced graphene oxide as a solid-state electron mediator, J. Am. Chem. Soc., 2015, 137, 604–607 CrossRef CAS PubMed.
- J. Guerrero-Contreras and F. Caballero-Briones, Graphene oxide powders with different oxidation degree, prepared by synthesis variations of the Hummers' method, Mater. Chem. Phys., 2015, 153, 209–220 CrossRef CAS.
- X. Diez-Betriu, S. Alvarez-Garcia, C. Botas, P. Alvarez, J. Sanchez-Marcos, C. Prieto, R. Menendez and A. de Andres, Raman spectroscopy for the study of reduction mechanisms and optimization of conductivity in graphene oxide thin films, J. Mater. Chem. C, 2013, 1, 6905–6912 RSC.
- G. K. Ramesha and S. Sampath, Electrochemical Reduction of Oriented Graphene Oxide Films: An in Situ Raman Spectroelectrochemical Study, J. Phys. Chem. C, 2009, 113, 7985–7989 CrossRef CAS.
- P. Liu, X. Chen, H. Ye and L. Jensen, Resolving Molecular Structures with High-Resolution Tip-Enhanced Raman Scattering Images, ACS Nano, 2019, 13, 9342–9351 CrossRef CAS PubMed.
- S. Mahapatra, J. F. Schultz, Y. Ning, J.-L. Zhang and N. Jiang, Probing surface mediated configurations of nonplanar regioisomeric adsorbates using ultrahigh vacuum tip-enhanced Raman spectroscopy, Nanoscale, 2019, 11, 19877–19883 RSC.
- Z. Han, G. Czap, C. L. Chiang, C. Xu, P. J. Wagner, X. Wei, Y. Zhang, R. Wu and W. Ho, Imaging the halogen bond in self-assembled halogenbenzenes on silver, Science, 2017, 358, 206–210 CrossRef CAS PubMed.
- J. Lee, K. T. Crampton, N. Tallarida and V. A. Apkarian, Visualizing vibrational normal modes of a single molecule with atomically confined light, Nature, 2019, 568, 78–82 CrossRef CAS PubMed.
- L. Li, J. F. Schultz, S. Mahapatra, Z. Lu, X. Zhang and N. Jiang, Chemically identifying single adatoms with single-bond sensitivity during oxidation reactions of borophene, Nat. Commun., 2022, 13 Search PubMed.
- R. B. Jaculbia, H. Imada, K. Miwa, T. Iwasa, M. Takenaka, B. Yang, E. Kazuma, N. Hayazawa, T. Taketsugu and Y. Kim, Single-molecule resonance Raman effect in a plasmonic nanocavity, Nat. Nanotechnol., 2020, 15, 105–110 CrossRef CAS PubMed.
- W. Su, N. Kumar, N. Dai and D. Roy, Nanoscale mapping of intrinsic defects in single-layer graphene using tip-enhanced Raman spectroscopy, Chem. Commun., 2016, 52, 8227–8230 RSC.
- T. Iwasaki, T. Zelai, S. Ye, Y. Tsuchiya, H. M. H. Chong and H. Mizuta, Local hole doping concentration modulation on graphene probed by tip-enhanced Raman spectroscopy, Carbon, 2017, 111, 67–73 CrossRef CAS.
- C. Chen, N. Hayazawa and S. Kawata, A 1.7 nm resolution chemical analysis of carbon nanotubes by tip-enhanced Raman imaging in the ambient, Nat. Commun., 2014, 5, 3312 CrossRef PubMed.
- R. Beams, Tip-enhanced Raman scattering of graphene, J. Raman Spectrosc., 2018, 49, 157–167 CrossRef CAS.
- M. V. Balois-Oguchi, N. Hayazawa, S. Yasuda, K. Ikeda, T. Q. Nguyen, M. C. Escaño and T. Tanaka, Probing Strain and Doping along a Graphene Wrinkle Using Tip-Enhanced Raman Spectroscopy, J. Phys. Chem. C, 2023, 127, 5982–5990 CrossRef CAS.
- W. Su, N. Kumar, A. Krayev and M. Chaigneau, In situ topographical chemical and electrical imaging of carboxyl graphene oxide at the nanoscale, Nat. Commun., 2018, 9, 2891 CrossRef PubMed.
- A. Bhattarai, A. Krayev, A. Temiryazev, D. Evplov, K. T. Crampton, W. P. Hess and P. Z. El-Khoury, Tip-Enhanced Raman Scattering from Nanopatterned Graphene and Graphene Oxide, Nano Lett., 2018, 18, 4029–4033 CrossRef CAS PubMed.
- S. Berweger and M. B. Raschke, Signal limitations in tip-enhanced Raman scattering: the challenge to become a routine analytical technique, Anal. Bioanal. Chem., 2010, 396, 115–123 CrossRef CAS PubMed.
- B. Ryan, C. Luiz Gustavo and N. Lukas, Raman characterization of defects and dopants in graphene, J. Phys.: Condens. Matter, 2015, 27, 083002 CrossRef PubMed.
- A. C. Ferrari, J. C. Meyer, V. Scardaci, C. Casiraghi, M. Lazzeri, F. Mauri, S. Piscanec, D. Jiang, K. S. Novoselov, S. Roth and A. K. Geim, Raman spectrum of graphene and graphene layers, Phys. Rev. Lett., 2006, 97, 187401 CrossRef CAS PubMed.
- M. V. Balois, N. Hayazawa, S. Yasuda, K. Ikeda, B. Yang, E. Kazuma, Y. Yokota, Y. Kim and T. Tanaka, Visualization of subnanometric phonon modes in a plasmonic nano-cavity via ambient tip-enhanced Raman spectroscopy, npj 2D Mater. Appl., 2019, 3, 38 CrossRef.
- C. Thomsen and S. Reich, Double Resonant Raman Scattering in Graphite, Phys. Rev. Lett., 2000, 85, 5214–5217 CrossRef CAS PubMed.
- A. Y. Lee, K. Yang, N. D. Anh, C. Park, S. M. Lee, T. G. Lee and M. S. Jeong, Raman study of D* band in graphene oxide and its correlation with reduction, Appl. Surf. Sci., 2021, 536, 147990 CrossRef CAS.
- K.-I. Sasaki, Y. Tokura and T. Sogawa, The Origin of Raman D Band: Bonding and Antibonding Orbitals in Graphene, Crystals, 2013, 3, 120–140 CrossRef CAS.
- Z. Luo, C. Cong, J. Zhang, Q. Xiong and T. Yu, The origin of sub-bands in the Raman D-band of graphene, Carbon, 2012, 50, 4252–4258 CrossRef CAS.
- P. Venezuela, M. Lazzeri and F. Mauri, Theory of double-resonant Raman spectra in graphene: intensity and line shape of defect-induced and two-phonon bands, Phys. Rev. B: Condens. Matter Mater. Phys., 2011, 84, 035433 CrossRef.
- V. N. Popov, Two-phonon Raman bands of bilayer graphene: Revisited, Carbon, 2015, 91, 436–444 CrossRef CAS.
- A. C. Ferrari and D. M. Basko, Raman spectroscopy as a versatile tool for studying the properties of graphene, Nat. Nanotechnol., 2013, 8, 235–246 CrossRef CAS PubMed.
- K. N. Kudin, B. Ozbas, H. C. Schniepp, R. K. Prud’homme, I. A. Aksay and R. Car, Raman spectra of graphite oxide and functionalized graphene sheets, Nano Lett., 2008, 8, 36–41 CrossRef CAS PubMed.
- K. Erickson, R. Erni, Z. Lee, N. Alem, W. Gannett and A. Zettl, Determination of the local chemical structure of graphene oxide and reduced graphene oxide, Adv. Mater., 2010, 22, 4467–4472 CrossRef CAS PubMed.
- A. Lerf, H. Y. He, M. Forster and J. Klinowski, Structure of graphite oxide revisited, J. Phys. Chem. B, 1998, 102, 4477–4482 CrossRef CAS.
- C. Gmez-Navarro, J. C. Meyer, R. S. Sundaram, A. Chuvilin, S. Kurasch, M. Burghard, K. Kern and U. Kaiser, Atomic structure of reduced graphene oxide, Nano Lett., 2010, 10, 1144–1148 CrossRef PubMed.
- V. Paillard, On the origin of the 1100 cm1 Raman band in amorphous and nanocrystalline sp3 carbon, Europhys. Lett., 2001, 54, 194–198 CrossRef CAS.
- M. Sahoo, R. P. Antony, T. Mathews, S. Dash and A. K. Tyagi, Raman studies of chemically and thermally reduced graphene oxide, AIP Conf.: Proc., 2013, 1512, 1262–1263 CrossRef CAS.
- A. Dimiev, D. V. Kosynkin, L. B. Alemany, P. Chaguine and J. M. Tour, Pristine graphite oxide, J. Am. Chem. Soc., 2012, 134, 2815–2822 CrossRef CAS PubMed.
- Y. Matsumoto, M. Koinuma, S. Ida, S. Hayami, T. Taniguchi, K. Hatakeyama, H. Tateishi, Y. Watanabe and S. Amano, Photoreaction of Graphene Oxide Nanosheets in Water, J. Phys. Chem. C, 2011, 115, 19280–19286 CrossRef CAS.
- D. A. Sokolov, K. R. Shepperd and T. M. Orlando, Formation of Graphene Features from Direct Laser-Induced Reduction of Graphite Oxide, J. Phys. Chem. Lett., 2010, 1, 2633–2636 CrossRef CAS.
- R. Trusovas, K. Ratautas, G. Raciukaitis, J. Barkauskas, I. Stankeviciene, G. Niaura and R. Mazeikiene, Reduction of graphite oxide to graphene with laser irradiation, Carbon, 2013, 52, 574–582 CrossRef CAS.
- R. K. Yadav, J. O. Lee, A. Kumar, N. J. Park, D. Yadav, J. Y. Kim and J. O. Baeg, Highly Improved Solar Energy Harvesting for Fuel Production from CO2 by a Newly Designed Graphene Film Photocatalyst, Sci. Rep., 2018, 8, 16741 CrossRef PubMed.
- T. H. Ji, Y. Y. Hua, M. Sun and N. Ma, The mechanism of the reaction of graphite oxide to reduced graphene oxide under ultraviolet irradiation, Carbon, 2013, 54, 412–418 CrossRef CAS.
- R. A. Soler-Crespo, W. Gao, L. Mao, H. T. Nguyen, M. R. Roenbeck, J. T. Paci, J. Huang, S. T. Nguyen and H. D. Espinosa, The Role of Water in Mediating Interfacial Adhesion and Shear Strength in Graphene Oxide, ACS Nano, 2018, 12, 6089–6099 CrossRef CAS PubMed.
Footnotes |
| † Electronic supplementary information (ESI) available: Further experimental details and information on analysis. Example TERS and micro-Raman spectra, and additional TERS intensity maps. See DOI: https://doi.org/10.1039/d3cp04711c |
| ‡ Present address: Department of Engineering, Westlake University, Hangzhou, China. |
| This journal is © the Owner Societies 2024 |