 Open Access Article
Exploring asymmetry induced entropy in tetraalkylammonium–urea DES systems: what can be learned from inelastic neutron scattering?†
Catarina F.
Araújo
 a,
Paulo
Ribeiro-Claro
 a,
Pedro D.
Vaz
 b,
Svemir
Rudić
 c,
Rafael A. F.
Serrano
 a,
Liliana P.
Silva
 a,
J. A. P.
Coutinho
 a and
Mariela M.
Nolasco
 *a
*a
aDepartment of Chemistry, Universidade de Aveiro CICECO, Aveiro, Portugal. E-mail: mnolasco@ua.pt
bChampalimaud Centre for the Unknown, Lung Unit, Champalimaud Foundation, Av. Brasilia, Lisboa, Portugal
cISIS Neutron & Muon Source, STFC Rutherford Appleton Laboratory, Didcot, UK
First published on 11th December 2023
Abstract
In this work, inelastic neutron scattering (INS) spectroscopy is used to investigate the impact of entropic factors on the behaviour of deep eutectic solvents (DES). Periodic density functional theory calculations (DFT) provide a reliable assignment of the vibrational modes of pure compounds. This assignment guides the analysis of INS spectra of binary mixtures – with particular attention to methyl torsional modes. Deviations from ideality in the mixtures of tetraalkylammonium salts with urea are readily determined through a simplified thermodynamic approach. This study reports and discusses the relationship between the cation's asymmetry, the INS spectra of the eutectic mixture and its deviation from ideality. Contrary to the majority of systems studied so far, the deep eutectic system comprised of [N2,2,2,1]Cl and urea appears to owe its deviation from ideality to entropic rather than enthalpic factors.
Introduction
The behaviour of deep eutectic solvents (DES) is one of the hottest topics in contemporary chemistry.1–3 The term “deep eutectic” stems from the peculiar phenomenon that the melting point of a DES is significantly lower than that of an ideal mixture of its components – in a typical type-III DES, an organic salt (e.g. choline chloride) and a hydrogen bond donor (e.g. urea). The most often cited rationalization for this phenomenon is that the hydrogen bond donor (HBD) interacts with the anion, leading to negative deviations from ideality, a result of entropic and enthalpic effects which are often difficult to tell apart. In general, most studies on DES focus on enthalpic factors, i.e., on the newly established intermolecular interactions among the mixture components while the influence of entropic changes remains unclear. Abbott did point out, in his earlier DES works,1 that salts with symmetric cations do not tend to form low melting mixtures, perhaps due to their greater ease of packing efficiently with the HBD, leading to ordered solids. However, since then, only a handful of recent studies have explored the role of entropy in deep eutectic formation. For instance, Kollau and co-workers4 advocate for the need of better thermodynamic models to describe the non-ideal phase behaviour of eutectic systems, since the commonly applied ones assume an ideal entropy of mixing, unlikely to hold true when DES components greatly differ in shape and size. By assuming an ideal entropy of mixing, the entropic contribution is underestimated and the excess free energy is assumed to stem uniquely from enthalpic factors.Showing similar concerns, Bruinhorst et al.5 points out that “the link between the state-of-the-art knowledge of the DES liquid microstructure and its macroscopic properties is still missing” and that the “delicate balance between intermolecular interactions and disorder that is believed to be at the basis of deep eutectics (…) should be reflected in macroscopic thermodynamics as a balance between mixing enthalpy and entropy” but “such observation has so far not been made experimentally”.
Recently, Martin and colleagues6 proposed a new solvation shell-ionic liquid (SSIL) model which takes into account the solvation shell characteristics of the eutectic mixture and possible complex formation to estimate the contributions of entropic and enthalpic factors to the deviation from ideality. Surprisingly, and contrary to the current consensus, according to the SSIL model the choline chloride:urea deep eutectic owes its melting point depression to an increase in the entropy of fusion relative to that expected for an ideal solution, while the enthalpic factors show an ideal behaviour.
Clearly, the influence of entropy in deep eutectic formation is an emerging topic in the field of deep eutectic solvents and there is a pressing need for further studies on this matter. The present work aims to explore the role of entropic factors in deep eutectic formation by comparing ideal-behaving and deep eutectic systems with similar enthalpic profiles but contrasting degrees of cationic symmetry which are expected to differ, essentially, in their entropic behaviour.
Previous studies from our laboratory7,8 took advantage of the unique capabilities of INS to gain insights into the structure and dynamics of choline chloride-based DES. For instance, it was demonstrated that the chemical surroundings of the cationic head of tetraalkylammonium ions may be probed by observing the methyl torsional modes, whose frequency increases as free space around methyl groups decreases.7 Methyl torsions are readily observable using INS, but weak and hard to resolve in optical spectra (Raman scattering or far-infrared absorption).
In addition, the experimental INS spectra can also be simulated using density functional theory (DFT) calculations. This is because INS spectroscopy does not have selection rules, meaning that all vibrational modes can contribute to the spectrum. The intensity of each mode is proportional to both the atomic scattering cross sections (well-defined physical constants) and the amplitude of atomic motions (a straightforward result of vibrational calculations). In this way, the computational spectroscopy approach provides a reliable and mostly unambiguous way to assign the bands observed in INS spectra. For crystalline systems, periodic-DFT calculations are the adequate choice, as they can accurately account for lattice interactions. For amorphous systems, the discrete calculations approximation – namely using cluster models – is the viable option.
In this work, the low frequency INS profile of deep eutectic solvents based on urea and tetraalkylammonium cations with varying degrees of symmetry (Scheme 1) are compared. The systems considered include two symmetrical cations (tetramethyl ammonium, [N1,1,1,1]+ and tetraethylammonium, [N2,2,2,2]+) and one asymmetrical cation, triethylmethyl ammonium [N2,2,2,1]+.
Slightly tweaking the cation – by substituting an ethyl by a methyl group – is not expected to produce significant changes in the enthalpic profile of the mixture, since the hydrogen bonding capability has not been altered. Thus, any relevant changes in the melting temperature from [N2,2,2,2]Cl to [N2,2,2,1]Cl mixtures with urea must stem from entropic factors. Architectural differences are assessed through the analysis of collective modes – which inform on the degree of order in the mixture –, intermolecular stretching modes and environment-sensitive internal modes, such as methyl torsions.
In a first step, a reliable assignment of INS spectra of pure alkylammonium salts will be obtained with the support of periodic-DFT calculations, with the aim of better understanding the spectra of the mixtures. Deviations from ideality in the mixtures of each alkylammonium salt with urea will be determined through a simplified thermodynamic approach. Finally, the INS spectra of the mixtures will be interpreted, with the help of discrete DFT calculations for cluster models. The relationship between the cation's asymmetry, the deviation from ideality, and the INS spectra of the eutectic mixtures will be reported and discussed.
Materials and methods
Chemicals
All pure compounds were obtained commercially: tetramethylammonium chloride (≥98% purity, Sigma-Aldrich), tetraethylammonium chloride (≥99% purity, Sigma-Aldrich) and triethylmethylammonium chloride (≥97% purity, Sigma-Aldrich).Phase diagram measurements
Binary mixtures between urea and tetraalkylammonium salts were prepared in different proportions covering the full compositions range (at mole fraction intervals of 0.1) by weighting the proper amounts of each pure substance inside a dry-argon glovebox using an analytical balance (model ALS 220-4 N from Kern, with a repeatability of 0.2 mg). Depending on the physical state of the final mixture, a capillary melting point apparatus or an oil bath was used to measure its melting point. The solid mixtures of all systems were firstly ground in the glove box and the temperatures were measured following the melting point capillary method described previously by Martins et al.9 For the mixtures presenting a pasty consistency (x(urea) = 0.5 to 0.8 of the [N2,2,2,1]Cl:urea system), samples were heated in an oil bath under stirring until completely melting. The melting temperatures were measured using a Pt100 probe (±0.1 K) corresponding to the last solid disappearance.Sample preparation for INS measurements
The eutectic compositions for the systems in study varied between x(urea) = 0.5 to 0.72 which roughly corresponds to an urea![[thin space (1/6-em)]](https://www.rsc.org/images/entities/char_2009.gif) :
:![[thin space (1/6-em)]](https://www.rsc.org/images/entities/char_2009.gif) salt ratio spanning 1
salt ratio spanning 1![[thin space (1/6-em)]](https://www.rsc.org/images/entities/char_2009.gif) :
:![[thin space (1/6-em)]](https://www.rsc.org/images/entities/char_2009.gif) 1 to 1
1 to 1![[thin space (1/6-em)]](https://www.rsc.org/images/entities/char_2009.gif) :
:![[thin space (1/6-em)]](https://www.rsc.org/images/entities/char_2009.gif) 3. In order to assess the spectroscopic effect of altering the cation while keeping every other variable constant, the 1
3. In order to assess the spectroscopic effect of altering the cation while keeping every other variable constant, the 1![[thin space (1/6-em)]](https://www.rsc.org/images/entities/char_2009.gif) :
:![[thin space (1/6-em)]](https://www.rsc.org/images/entities/char_2009.gif) 2 composition was chosen for direct comparison across different systems. In addition, for the [N2,2,2,1]Cl
2 composition was chosen for direct comparison across different systems. In addition, for the [N2,2,2,1]Cl![[thin space (1/6-em)]](https://www.rsc.org/images/entities/char_2009.gif) :
:![[thin space (1/6-em)]](https://www.rsc.org/images/entities/char_2009.gif) urea system, a mixture with the 1
urea system, a mixture with the 1![[thin space (1/6-em)]](https://www.rsc.org/images/entities/char_2009.gif) :
:![[thin space (1/6-em)]](https://www.rsc.org/images/entities/char_2009.gif) 3 proportion was also measured. The binary mixtures were all prepared by the heating method. Prior to mixture preparation, the individual components were dried combining vacuum and heating in a Schlenck apparatus. After drying, the components were weighted inside a glovebox into sealed glass vials and placed under constant stirring and temperature until a homogenous transparent liquid was obtained. The mixtures were then allowed to return to room temperature.
3 proportion was also measured. The binary mixtures were all prepared by the heating method. Prior to mixture preparation, the individual components were dried combining vacuum and heating in a Schlenck apparatus. After drying, the components were weighted inside a glovebox into sealed glass vials and placed under constant stirring and temperature until a homogenous transparent liquid was obtained. The mixtures were then allowed to return to room temperature.
Spectra acquisition
The INS spectra were collected using the TOSCA10–13 time-of-flight spectrometer at the ISIS Neutron and Muon Source of the STFC Rutherford Appleton Laboratory (Chilton, UK). Each sample, weighing ca. 0.6–1.0 g, was transferred to a flat thin-walled aluminium can, inside a controlled atmosphere glove box, to avoid moisture uptake. The mixtures were heated above their respective melting points until reaching the liquid state and then “shock-frozen” by quenching samples in liquid nitrogen before placement in the beam path, to avoid phase separation and preserve the room-temperature morphology of possible amorphous and crystalline regions. For the slow cooling samples, the procedure previously described was employed.8 The sealed can was then mounted perpendicular to the incident beam using a regular TOSCA centered stick. Spectra were collected below 15 K, measured for the 0 to 8000 cm−1 region. Data was converted to the conventional scattering law, S(Q,ν) vs. energy transfer (in cm−1), using the MANTID program (version 4.0.0).14 All the INS spectra of DES samples and the INS spectrum of pure chloride alkylammonium salts were obtained within project RB1810054.15 The TOSCA spectra of urea and tetramethylammonium bromide were previously recorded by Jonhson and colleagues16 and by John Tomkinson, respectively, and are available at the INS database.17Periodic DFT calculations
Calculations were performed using the plane wave pseudopotential method as implemented in CASTEP 8.0 code.18,19 All calculations were done using the Perdew–Burke–Ernzerhof (PBE) functional based on the generalized gradient gauge (GGA) approximation.20 The plane-wave cutoff energy was set at 830 eV. Brillouin zone sampling of electronic states was performed on 2 × 4 × 5 Monkhorst–Pack grid. The initial structures were obtained from ref. 21 and 22 or built from ref. 23 and 24. Geometry optimizations were carried out with fixed cell parameters and accuracy of the optimization requested residual forces to fall below 0.005 eV A−1. Phonon frequencies were obtained by diagonalization of dynamical matrices calculated using density-functional perturbation theory.25 The calculated atomic displacements in each mode that are part of the CASTEP output enable visualization of the atomic motions and support the assignment of vibrational modes. The inelastic neutron scattering simulated intensities were estimated from the calculated eigenvectors using the AbINS software,26 a part of the Mantid package.14Discrete DFT calculations
Geometry optimizations and vibrational frequency calculations of salt:urea systems were computed using the Gaussian 09 software, using the B3LYP density functional with the 6-31+G(d) basis set. The clusters were built from the cluster used for “reline”7 and include two salt pairs and four urea molecules. This is considered the minimum size cluster required to describe all the relevant interactions in a DES mixture.7 Optimizations were performed without constraints and all the optimized structures were found to be real minima, with no imaginary frequencies. The inelastic neutron scattering simulated intensities were estimated from the calculated eigenvectors using the AbINS software, as above.Results and discussion
The pure compounds: calculated vs. experimental spectra
As mentioned above, periodic-DFT calculations have a very good track record of predicting the INS spectra of crystalline systems. In some cases, the predicted INS spectrum not only provides a good description of the general band profile, but also identifies in detail spectral effects associated with crystalline packing and multi-quanta transitions. This is the case of the [N1,1,1,1]Br system, which is highlighted in Fig. 1.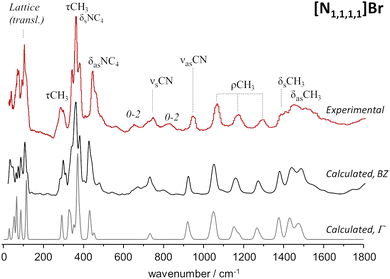 | ||
| Fig. 1 Experimental (top line, red) and calculated (middle, bottom) spectra for tetramethylammonium bromide, [N1,1,1,1]Br. Bottom line shows the fundamental transitions at the Γ-point, while the middle line includes dispersion over the Brillouin zone. Experimental spectrum from TOSCA database.17 | ||
Fig. 1 compares the experimental and periodic-DFT calculated INS spectra for [N1,1,1,1]Br. As it can be seen, the calculated spectrum averaged over the Brillouin zone and including multiquanta transitions (middle line, BZ) provides a remarkable description of the experimental spectrum. The figure includes the calculated spectrum obtained for the fundamental transitions at the Γ-point (bottom line) to highlight the importance of both dispersion over the Brillouin zone and combination modes. Dispersion affects the general band profile up to ca. 500 cm−1, while the presence of multiquanta transitions becomes evident in the 500–900 cm−1 range. The same general agreement between experimental and calculated spectra is observed for [N1,1,1,1]Cl (Fig. S1, ESI†).
The INS spectra of tetramethylammonium halides have already been assigned,27,28 but herein reported results allow some additional clarifications. The band at ca. 368 cm−1 is typically ascribed to the NC4 deformation modes, but present calculations show the presence of CH3 torsions in the same region. Due to the large INS intensity of torsional motions, their contribution to the observed band profile cannot be ignored. In addition, this strong band at ca. 368 cm−1 is identified as the origin of the overtone and combination bands observed at ca. 655 cm−1 (368 + 292), 725 cm−1 (2 × 368) and 820 cm−1 (368 + 450).
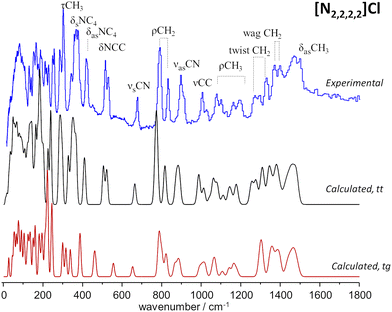
Fig. 2 compares the experimental INS spectra of [N2,2,2,2]Cl with the periodic-DFT calculated spectra for two polymorphs reported in the literature, labelled HIVROT24 and HIVROT0129 in the Cambridge Crystallographic Data Centre. The main difference between the two polymorphic forms is the conformation of ethyl groups in the cation: in the first case, there are two crossing C–C–N–C–C chains with trans–trans (tt) conformation, while in the second the chain conformation is trans–gauche (tg). As it can be seen in Fig. 2, periodic-DFT calculations can readily distinguish between the two forms. This is particularly evident when considering the description of INS profiles in the 300–800 cm−1 region, which clearly points to the presence of the trans–trans polymorph. As observed previously for similar systems30 (and for tetramethyl systems above), the torsional motions of –CH3 groups span up to 380 cm−1, strongly mixing with the NC4 deformation modes in the higher wavenumber side. In the low wavenumber region, torsional motions of –CH3 groups mix with the torsions of the –CH2CH3 fragment (ca. 100–200 cm−1) and even with the librational (lattice) modes at ca. 100 cm−1. This mixing explains the absence of the “band gap” between internal (molecular) and external (lattice) modes, observed for the smaller tetramethyl systems.
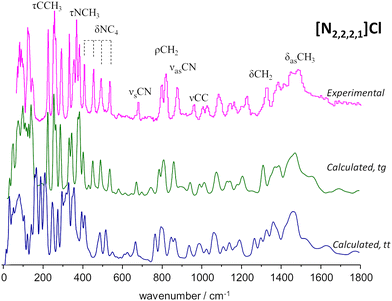
To the best of our knowledge, there is no experimental report on the crystalline structure of the [N2,2,2,1]Cl salt. Since a crystalline model is a pre-requisite to periodic-DFT calculations two candidate crystal structures were built by adapting the existing CIF files for tetraethylammonium chloride (CSD refcode: HIVROT), with trans–trans conformational pattern, and triethylmethylammonium bromide (CDS refcode: AYEZOW), with trans–gauche ethylene chains. Both structures were subject to geometry optimization using CASTEP and the resulting INS spectra are shown on Fig. 3, in comparison with the experimental spectrum.
(The INS spectra of the four systems can be compared in Fig. S2, ESI†).
The evident agreement between the observed INS spectrum and that estimated from a candidate structure identical to [N2,2,2,1]Br allows to unambiguously conclude that the alkylammonium cation adopts the trans–gauche conformation in the [N2,2,2,1]Cl crystal.‡ The large discrepancies observed below 600 cm−1 between the spectra estimated for the two candidate structures are due not only to conformational differences but also to distinct packing motifs. In particular, the gap in the 175–200 cm−1 region observed in the experimental spectrum, which is accurately reproduced by the tg structure estimated spectrum but lacking in its tt counterpart, is due to different degrees of crowding around the cation. In the tg candidate structure the distance between chloride anions and the cationic center spans from 4.0–4.4 Å while the tt structure displays Cl−⋯N+ distances of 4.3–4.9 Å. As a result, in the tt structure the methyl end-groups experience less crowding and their methyl torsional frequencies are found at a lower wavenumber than those of the tg structure, thereby occupying the 175–200 cm−1 region and providing a neat illustration of the capabilities of methyl torsions as sensors of the alkylammonium cation's immediate environment.
The solid–liquid equilibrium (SLE) phase diagrams
As discussed previously,3,31 the SLE curves of an eutectic-type liquid mixture whose individual components solidify into pure and immiscible solid phases – and when no solid–solid phase transitions are present, can be described using the simplified equation: | (1) |
The thermodynamic properties of quaternary ammonium salts are very scarce in the literature with melting enthalpies being particularly hard to measure due to the tendency of these compounds to decompose before reaching their melting point. However, for the purpose of this study, the ideal line of the urea component (dashed line in Fig. 4B) is sufficient to define the behaviour of the mixture. In fact, since the melting temperatures of alkylammonium salts are typically above 500 K9,31 and the salt![[thin space (1/6-em)]](https://www.rsc.org/images/entities/char_2009.gif) :
:![[thin space (1/6-em)]](https://www.rsc.org/images/entities/char_2009.gif) urea ratio for the ideal eutectic point is expected to be between ca. 1
urea ratio for the ideal eutectic point is expected to be between ca. 1![[thin space (1/6-em)]](https://www.rsc.org/images/entities/char_2009.gif) :
:![[thin space (1/6-em)]](https://www.rsc.org/images/entities/char_2009.gif) 1–1
1–1![[thin space (1/6-em)]](https://www.rsc.org/images/entities/char_2009.gif) :
:![[thin space (1/6-em)]](https://www.rsc.org/images/entities/char_2009.gif) 3, the temperature of the ideal eutectic point must fall within the 360 ± 30 K interval of the urea SLE ideal line.
3, the temperature of the ideal eutectic point must fall within the 360 ± 30 K interval of the urea SLE ideal line.
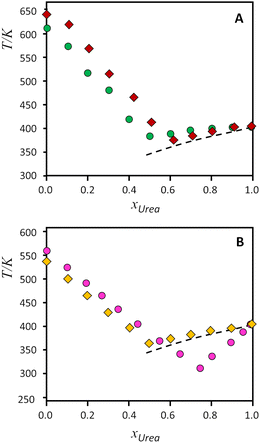 | ||
| Fig. 4 Solid–liquid equilibrium phase diagrams for the binary systems composed of urea and tetraalkylammonium salts. Top, A: (green circles) [N1,1,1,1]Cl, (red diamonds) [N1,1,1,1]Br; bottom, B, (gold diamonds) [N2,2,2,2]Cl, (pink circles) [N2,2,2,1]Cl. Symbols represent the data experimentally measured (from ref. 9, except [N2,2,2,1]Cl, this work), while the dashed lines represent the ideal solid–liquid equilibrium for urea. | ||
As it can be seen on Fig. 4(A) and (B), urea presents slight positive deviations when mixed with symmetrical alkylammonium salts, and only the [N2,2,2,1]Cl:urea system presents a strong deviation from ideality for the urea component. The effect of the exchange from chloride to bromide in [N1,1,1,1] salts (Fig. 4A) has been reported to decrease the non-ideality of the bromide salt, leading to near-ideal behaviour.9 On the other hand, Fig. 4B evidences the different behaviour between the symmetrical [N2,2,2,2]Cl and the asymmetrical [N2,2,2,1]Cl systems, with a strong deviation from ideality of urea for the asymmetrical compound. The non-ideality of the salts cannot be rigorously evaluated because of the lack of melting enthalpies, but the experimental melting temperatures follow the same trend in both salts.
The INS spectra of alkylammonium:urea mixtures
To obtain the INS spectra, samples must be at very low temperatures, typically at 15–20 K, in a helium cooled cryostat (see ESI† text on INS). Before placing in the cryostat, samples may be subject either to “shock freezing” or to “slow cooling” procedures. It has been shown that “shock freezing” allows to capture the room-temperature morphology of the liquid sample, namely its amorphous character, while a slow cooling procedure can originate crystal phase separation or co-crystallization.8 In the DES mixtures herein reported, no difference was observed between these procedures, and both “shock freezing” and “slow cooling” yield identical INS spectra. The comparison between “shock freezing” and “slow cooling” spectra for the case of the [N2,2,2,1]Cl:urea mixture is shown in Fig. S3, ESI.†
Fig. 5 illustrates the behaviour of urea:salt mixtures for the case of the salts with symmetrical cations. The INS spectrum of the [N2,2,2,2]Cl![[thin space (1/6-em)]](https://www.rsc.org/images/entities/char_2009.gif) :
:![[thin space (1/6-em)]](https://www.rsc.org/images/entities/char_2009.gif) urea mixture with the conventional 1
urea mixture with the conventional 1![[thin space (1/6-em)]](https://www.rsc.org/images/entities/char_2009.gif) :
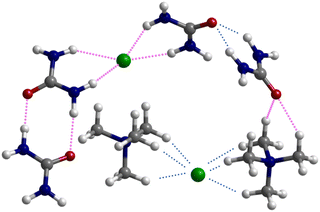
:![[thin space (1/6-em)]](https://www.rsc.org/images/entities/char_2009.gif) 2 mole ratio, close to the experimental eutectic point, is compared with the INS spectra of pure components (see ESI† for the similar [N1,1,1,1]Cl:urea system, Fig. S4, ESI†). The assignments presented are supported from discrete DFT calculations, based on a cluster model previously found to account for all the relevant intermolecular contacts, as described in the experimental section and illustrated in Fig. 6 (for the comparison between experimental and calculated spectra see ESI,† Fig. S5–S7).
2 mole ratio, close to the experimental eutectic point, is compared with the INS spectra of pure components (see ESI† for the similar [N1,1,1,1]Cl:urea system, Fig. S4, ESI†). The assignments presented are supported from discrete DFT calculations, based on a cluster model previously found to account for all the relevant intermolecular contacts, as described in the experimental section and illustrated in Fig. 6 (for the comparison between experimental and calculated spectra see ESI,† Fig. S5–S7).
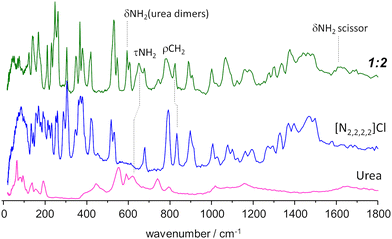 | ||
Fig. 5 INS spectrum of the tetraethylammonium chloride![[thin space (1/6-em)]](https://www.rsc.org/images/entities/char_2009.gif) : :![[thin space (1/6-em)]](https://www.rsc.org/images/entities/char_2009.gif) urea 1 urea 1![[thin space (1/6-em)]](https://www.rsc.org/images/entities/char_2009.gif) : :![[thin space (1/6-em)]](https://www.rsc.org/images/entities/char_2009.gif) 2 mixture (top line, green), compared with the INS spectrum of pure components, urea (bottom, magenta) and tetraethylammonium chloride (middle, blue). Band assignments are shown for relevant vibrational modes. Experimental spectrum of urea from TOSCA database.16 2 mixture (top line, green), compared with the INS spectrum of pure components, urea (bottom, magenta) and tetraethylammonium chloride (middle, blue). Band assignments are shown for relevant vibrational modes. Experimental spectrum of urea from TOSCA database.16 | ||
Above ca. 800 cm−1, the spectrum of the mixture does not show strong deviations from the sum of the spectra of individual components. Nevertheless, the small differences observed can be amplified by a subtraction spectra procedure, as used in a previous INS report.32 Subtraction spectra allow the identification of a new sharp band at ca. 1075 cm−1 in [N1,1,1,1]Cl:urea and 1065 cm−1 in [N2,2,2,2]Cl:urea (assigned to CH3 rocking modes) and some intensity changes in the region of ca. 1600 cm−1 (NH2 scissor modes) for both systems.
However, below 800 cm−1, larger changes are observed. Concerning the urea component, the band at ca. 620 cm−1 in the pure compound appears to be shifted upwards in the mixture. More important is the disappearance of the bands in the 450–550 cm−1 region, and the emergence of a pair of sharp bands at ca. 590 cm−1. This pair of bands is assigned to bending modes of urea dimers, thus signalling the disruption of the urea crystalline structure upon melting.
Regarding the [N2,2,2,2]Cl component, the changes upon mixing are observed mainly in the region below 400 cm−1, which includes the NC4 bending modes, the –CH3 torsional modes, and the non-molecular, or intermolecular, lattice modes. The sharpness of the observed bands is characteristic of ordered materials, suggesting the formation of an organized framework in the mixture (even in shock-frozen samples) which clearly differs from that found in the pure compounds. Therefore, the pure components do not “solidify into pure and immiscible solid phases” as assumed by the thermodynamic model used to estimate ideal behaviour. However, since there is still uncertainty regarding the architecture of the solid mixture at thermodynamic equilibrium (i.e. the novel framework observed through INS might be metastable) the authors employ the standard thermodynamic model for the “simplest eutectic case”.5
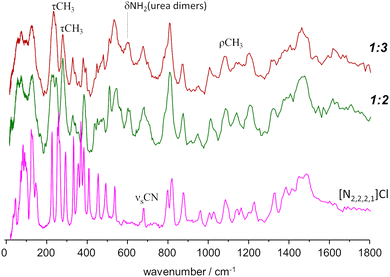
A different situation arises for the non-symmetrical [N2,2,2,1]Cl:urea system, shown in Fig. 7. This figure includes the INS spectra of two mixture compositions: the conventional 1![[thin space (1/6-em)]](https://www.rsc.org/images/entities/char_2009.gif) :
:![[thin space (1/6-em)]](https://www.rsc.org/images/entities/char_2009.gif) 2 mole ratio and the 1
2 mole ratio and the 1![[thin space (1/6-em)]](https://www.rsc.org/images/entities/char_2009.gif) :
:![[thin space (1/6-em)]](https://www.rsc.org/images/entities/char_2009.gif) 3 mole ratio, closer to the experimental eutectic point (see Fig. 3). As in the case of the previous systems, the region above 800 cm−1 is not highly sensitive to the effects of mixture. Nevertheless, the subtraction spectrum evidences some intensity increase in the region of the symmetric CH3 bending modes (ca. 1400–1450 cm−1) and an upwards shift of the in-plane NH2 bending modes (from ca. 1130 to ca. 1190 cm−1).
3 mole ratio, closer to the experimental eutectic point (see Fig. 3). As in the case of the previous systems, the region above 800 cm−1 is not highly sensitive to the effects of mixture. Nevertheless, the subtraction spectrum evidences some intensity increase in the region of the symmetric CH3 bending modes (ca. 1400–1450 cm−1) and an upwards shift of the in-plane NH2 bending modes (from ca. 1130 to ca. 1190 cm−1).
However, below 800 cm−1, the changes are more evident, as the well-defined sharp bands that characterize the INS spectra of pure salts are clearly lost. The 200–400 cm−1 range will be the focus of discussion below, but the effects of the mixing are observed for the whole region. The presence of urea dimers is also signalled by the band pair at ca. 590 cm−1, as observed for the [N2,2,2,2]Cl:urea analogue. The urea bending modes and the NC4 and NCC bending modes of the ammonium cation (see Fig. 3 labels) are clearly disturbed in both the 1![[thin space (1/6-em)]](https://www.rsc.org/images/entities/char_2009.gif) :
:![[thin space (1/6-em)]](https://www.rsc.org/images/entities/char_2009.gif) 2 and 1
2 and 1![[thin space (1/6-em)]](https://www.rsc.org/images/entities/char_2009.gif) :
:![[thin space (1/6-em)]](https://www.rsc.org/images/entities/char_2009.gif) 3 mixtures.
3 mixtures.
As mentioned above, the torsional modes of the methyl groups were found to provide relevant information concerning the structure of the amorphous solid formed upon quenching the liquid sample (fast temperature drop, or “shock freeze”). Fig. 8 presents the INS spectra in the region of methyl torsions for the three systems herein considered, compared with the reported spectrum for the “reline” system (cholinium chloride![[thin space (1/6-em)]](https://www.rsc.org/images/entities/char_2009.gif) :
:![[thin space (1/6-em)]](https://www.rsc.org/images/entities/char_2009.gif) urea 1
urea 1![[thin space (1/6-em)]](https://www.rsc.org/images/entities/char_2009.gif) :
:![[thin space (1/6-em)]](https://www.rsc.org/images/entities/char_2009.gif) 2).7 It is clear from Fig. 8 that the INS spectra of the systems with symmetrical alkylammonium cations differ from the non-symmetrical systems. While the former group presents a pattern of sharp bands, characteristic of an ordered environment, the latter gives rise to broader bands, typical of disordered systems.
2).7 It is clear from Fig. 8 that the INS spectra of the systems with symmetrical alkylammonium cations differ from the non-symmetrical systems. While the former group presents a pattern of sharp bands, characteristic of an ordered environment, the latter gives rise to broader bands, typical of disordered systems.
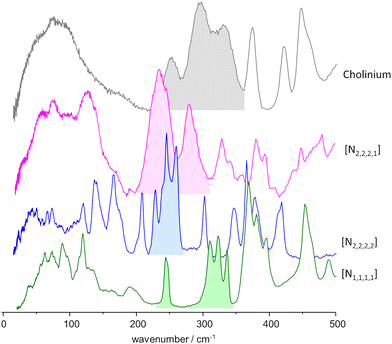 | ||
Fig. 8 INS spectra, in the region of the methyl torsional modes, of the mixtures with urea and the three alkylammonium chloride salts, compared with the “reline” case.7 Labels identify the cation only: from bottom to top, tetramethylammonium chloride![[thin space (1/6-em)]](https://www.rsc.org/images/entities/char_2009.gif) : :![[thin space (1/6-em)]](https://www.rsc.org/images/entities/char_2009.gif) urea 1 urea 1![[thin space (1/6-em)]](https://www.rsc.org/images/entities/char_2009.gif) : :![[thin space (1/6-em)]](https://www.rsc.org/images/entities/char_2009.gif) 2, tetraethylammonium chloride 2, tetraethylammonium chloride![[thin space (1/6-em)]](https://www.rsc.org/images/entities/char_2009.gif) : :![[thin space (1/6-em)]](https://www.rsc.org/images/entities/char_2009.gif) urea 1 urea 1![[thin space (1/6-em)]](https://www.rsc.org/images/entities/char_2009.gif) : :![[thin space (1/6-em)]](https://www.rsc.org/images/entities/char_2009.gif) 2, triethylmethylammonium chloride 2, triethylmethylammonium chloride![[thin space (1/6-em)]](https://www.rsc.org/images/entities/char_2009.gif) : :![[thin space (1/6-em)]](https://www.rsc.org/images/entities/char_2009.gif) urea 1 urea 1![[thin space (1/6-em)]](https://www.rsc.org/images/entities/char_2009.gif) : :![[thin space (1/6-em)]](https://www.rsc.org/images/entities/char_2009.gif) 3, and cholinium chloride 3, and cholinium chloride![[thin space (1/6-em)]](https://www.rsc.org/images/entities/char_2009.gif) : :![[thin space (1/6-em)]](https://www.rsc.org/images/entities/char_2009.gif) urea 1 urea 1![[thin space (1/6-em)]](https://www.rsc.org/images/entities/char_2009.gif) : :![[thin space (1/6-em)]](https://www.rsc.org/images/entities/char_2009.gif) 2 (“reline”). 2 (“reline”). | ||
The same information is well apparent in the collective mode region, below ca. 100 cm−1. For mixtures with symmetric cations, the INS intensity profile below 100 cm−1 exhibits fine detail, with sharp modes stemming from organized domains within the mixture. In contrast, for systems based on asymmetric cations, the collective mode profile is broad and devoid of sharp features, reflecting a higher degree of disorder.
Cation asymmetry and entropy of mixing
Periodic-DFT calculations on the pure salts provide a sound and reliable assignment of the corresponding INS spectra. This allows the identification of the characteristic bands of each alkylammonium cation, particularly the large amplitude-low wavenumber modes for which spectroscopy with neutrons becomes particularly advantageous.In the case of the [N2,2,2,1]Cl salt, the proposed crystalline structure, based on the X-ray structure of the bromide derivative,33 gives rise to a convincingly accurate calculated INS spectrum which greatly resembles the one observed through experiment. In this structure, the ethylene conformation is gauche for two chains and trans for the third one. For the symmetrical [N2,2,2,2]Cl, trans–gauche isomerism of the ethylene chains gives rise to different polymorphs. In this way, polymorphism cannot be excluded for [N2,2,2,1]Cl.
As expected, the smaller systems, [N1,1,1,1]Cl and [N1,1,1,1]Br, present the simplest INS spectra. From the chloride to the bromide salt, there is a slight decrease in the frequency of the methyl torsional motions and in the N–C stretching modes. This decrease is expected from the lower stiffness around methyl groups, as CH⋯Br interactions are weaker than CH⋯Cl.
Significantly, these same modes display a greater downshift, as compared with [N1,1,1,1]Cl, when considering the larger [N2,2,2,2]Cl and [N2,2,2,1]Cl systems. This downshift may be ascribed to the mass increase, in the case of N–C stretching, and to a weaker CH⋯Cl interaction, in the case of the methyl torsions. In fact, considering the experimental crystalline structures, in [N1,1,1,1]Cl all CH3 groups contact with three chloride anions, while in [N2,2,2,2]Cl the anions are shared between CH2 and CH3 groups. The relevant point is that both systems (i.e., [N2,2,2,2]Cl and [N2,2,2,1]Cl) present quite similar wavenumber shifts relative to [N1,1,1,1]Cl.
The information provided from the INS spectra of pure salts is in general agreement with the SLE phase diagrams for the mixtures – with the systems divided in two pairs, smaller vs. larger, as shown in Fig. 4. The melting points of pure salts (considered with the caveats discussed earlier)9 are higher for the smaller systems. The comparison for tetramethylammonium bromide vs. chloride:urea systems was reported elsewhere,9 concluding that both components behave closer to thermodynamic ideality, in spite of small differences on the overall interactions present. In addition, negative deviations from ideality for urea were found to be related with the hydrogen-bonding acceptor role of the anion, since NH⋯Cl interactions are stronger than NH⋯O.9 However, in what concerns the larger systems herein discussed, there is no reason to assume that the strength of the CH⋯Cl, NH⋯Cl, or C–H⋯O interactions would be significantly different from one system to another. The similarity between the two systems is somewhat reflected in the behaviour of the SLE lines for the salt-rich mixture side (see Fig. 4). Unfortunately, it is difficult to measure experimentally the enthalpy of fusion of tetraalkylammonium halides using standard differential scanning calorimetry equipment due to their tendency to decompose before melting when subjected to standard heating rates. Recently, Bruinhorst and colleagues34 succeeded in directly measuring the enthalpy of fusion of choline chloride using (ultra-)fast differential scanning calorimetry at the European Synchrotron Radiation Facility. However, for the purposes of the present study, it is sufficient to compare the thermodynamic profile of the symmetric and asymmetric salts as estimated by CASTEP. As shown in Fig. S8 (ESI†), the variation of heat capacity with temperature estimated for [N2222]Cl and [N2221]Cl follows similar, almost superimposed curves. At 298 K the heat capacity value estimated for N2221Cl is 0.9% higher than that estimated for N2222Cl. Then, it is reasonable to conclude that the enthalpic profile of the asymmetric and symmetric tetraalkylammonium salts is very similar and, therefore, the large deviation from ideality found for the eutectic point of the [N2,2,2,1]Cl:urea mixture must stem mostly from entropic factors.
It is interesting to note that the increased asymmetry of the cation causes deviations from ideality observed in the SLE curve of the urea component (right side of diagram in Fig. 4B). This can be explained considering the effect of cation asymmetry in the liquid phase of the mixtures. It is well-known that for ideal mixtures, whose enthalpy of mixing is null, the melting point depression originates from an increase in configurations—i.e., entropy—when mixing components in the liquid state. As pointed out by Martin and colleagues,6 “(…) the thermodynamic basis for solution formation is assumed to be the entropy of mixing, ΔSmix, for which the increased entropy of B in A or A in B solutions relative to that of the pure phases, is responsible for the freezing point depression of each phase.” Thus, the effect of the alkylammonium salt upon the entropy of mixing can be assessed by observing the urea-rich side of the SLE diagram, and vice versa. Looking at the phase diagrams of Fig. 4B, for the urea-rich mixtures, both salts produce a melting point depression of solid urea. However, the cation asymmetry promotes a larger entropy of mixing in the [N2,2,2,1]Cl:urea liquid phase, due to the orientation-dependent configurations of the cation. This increased entropy in the liquid phase translates into a lower melting point, giving rise to the observed deviations from ideality in the urea side of the diagram. On the other hand, for the salt rich mixtures (left side of diagram), the cation asymmetry is already accounted for in the melting points of pure compounds. Hence, urea affects the melting points of both salts in the same way, resulting in the parallel SLE lines that are observed. This result reasserts the importance of accounting for entropy when attempting to determine the physical drivers underlying deep eutectic formation and confirms the usefulness of INS spectroscopy as a tool for probing the degree of order in eutectic mixtures.
Conclusion
The answer to the question posed in the title is easily found in the results presented here. Compared with the cases of symmetrical cations, the mixture with the asymmetrically substituted cation presents a stronger deviation from ideality and several flagging INS features, the most relevant being the broadening of bands ascribed to torsional motions of the methyl group. These changes, which were first reported for the “reline” DES, have been related with the displacement of the chloride anions by the urea molecules, resulting in less hindered methyl groups. Since the enthalpic profile of the three reported salts is very similar, the strong non-ideal behaviour, which is manifested as a low melting temperature at the eutectic point, must stem from entropic factors. In this way, it can be concluded that INS spectroscopy discloses the asymmetry induced entropy factors in tetraalkylammonium:urea mixtures and emerges as a useful tool in the study of entropy as a driver of deep eutectic formation.Author contributions
All authors contributed toward the planning, preparation and implementation of the fieldwork, data analysis and interpretation, and writing the manuscript. MMN was responsible for INS project at ISIS (DOI: https://doi.org/10.5286/ISIS.E.RB1810054); PDV and MMN were responsible for periodic DFT calculations; CFA was responsible for initial laboratory work and discrete DFT calculations, as a part of her PhD thesis under supervision of MMN, JAPC and PRC; RAFS was responsible for final discrete DFT calculations, as a part of his BSc thesis under supervision of MMN and PRC; PRC, CFA and MMC were engaged in sample environment, data acquisition and data processing tasks; SR, the instrument scientist at ISIS, provided the expertise on INS data collection and analysis; LPS performed and JAPC provided student supervision for preparation, processing, and physical characterization of DES samples.Conflicts of interest
There are no conflicts to declare.Acknowledgements
This work was developed within the scope of the project CICECO-Aveiro Institute of Materials, UIDB/50011/2020, UIDP/50011/2020 & LA/P/0006/2020, financed by national funds through the FCT/MCTES (PIDDAC). FCT is also acknowledged for the PhD grant to CFA (SFRH/BD/129040/2017). The STFC Rutherford Appleton Laboratory is thanked for access to neutron beam facilities (TOSCA/RB1810054, DOI: https://doi.org/10.5286/ISIS.E.RB1810054). CASTEP calculations were made possible due to the computing resources provided by STFC Scientific Computing Department's SCARF cluster.Notes and references
- A. P. Abbott, G. Capper, D. L. Davies, R. K. Rasheed and V. Tambyrajah, Novel solvent properties of choline chloride/urea mixtures, Chem. Commun., 2003, 70–71 RSC.
- B. B. Hansen, S. Spittle, B. Chen, D. Poe, Y. Zhang, J. M. Klein, A. Horton, L. Adhikari, T. Zelovich, B. W. Doherty, B. Gurkan, E. J. Maginn, A. Ragauskas, M. Dadmun, T. A. Zawodzinski, G. A. Baker, M. E. Tuckerman, R. F. Savinell and J. R. Sangoro, Deep Eutectic Solvents: A Review of Fundamentals and Applications, Chem. Rev., 2021, 121, 1232–1285 CrossRef CAS PubMed.
- D. O. Abranches and J. A. P. Coutinho, Everything YouWanted to Know about Deep Eutectic Solvents butWere Afraid to Be Told, Annu. Rev. Chem. Biomol. Eng., 2023, 14, 141–163 CrossRef CAS PubMed.
- L. J. B. M. Kollau, M. Vis, A. van den Bruinhorst, R. Tuinier and G. de With, Entropy models for the description of the solid-liquid regime of deep eutectic solutions, J. Mol. Liq., 2020, 302, 112155 CrossRef CAS.
- A. van den Bruinhorst and M. C. Gomes, Is there depth to eutectic solvents?, Curr. Opin. Green Sustainable Chem., 2022, 37, 100659 CrossRef CAS.
- J. D. D. Martin and A. M. M. Shipman, Deep Dive into Eutectics: On the Origin of Deep and Elevated Eutectics, J. Electrochem. Soc., 2023, 170, 066508 CrossRef CAS.
- C. F. Araujo, J. A. P. Coutinho, M. M. Nolasco, S. F. Parker, P. J. A. Ribeiro-Claro, S. Rudić, B. I. G. Soares and P. D. Vaz, Inelastic neutron scattering study of reline: Shedding light on the hydrogen bonding network of deep eutectic solvents, Phys. Chem. Chem. Phys., 2017, 19, 17998–18009 RSC.
- M. M. Nolasco, S. N. Pedro, C. Vilela, P. D. Vaz, P. Ribeiro-Claro, S. Rudic, S. F. Parker, C. S. R. Freire, M. G. Freire and A. J. D. Silvestre, Water in Deep Eutectic Solvents: New Insights From Inelastic Neutron Scattering Spectroscopy, Front. Phys., 2022, 10, 834571 CrossRef.
- M. A. R. Martins, D. O. Abranches, L. P. Silva, S. P. Pinho and J. A. P. Coutinho, Insights into the Chloride versus Bromide Effect on the Formation of Urea-Quaternary Ammonium Eutectic Solvents, Ind. Eng. Chem. Res., 2022, 61, 11988–11995 CrossRef CAS.
- ISIS Facility INS/TOSCA, https://www.isis.stfc.ac.uk/Pages/tosca.aspx, (accessed 15 September 2022).
- S. F. Parker, D. Lennon and P. W. Albers, Vibrational Spectroscopy with Neutrons: A Review of New Directions, Appl. Spectrosc., 2011, 65, 1325–1341 CrossRef CAS.
- S. F. Parker, F. Fernandez-Alonso, A. J. Ramirez-Cuesta, J. Tomkinson, S. Rudic, R. S. Pinna, G. Gorini and J. Fernandez Castanon, Recent and future developments on TOSCA at ISIS, ed. M. Jimenez-Ruiz and S. Parker, Journal of Physics: Conference Series, 2014, vol. 554, 012003 Search PubMed.
- R. S. Pinna, S. Rudić, S. F. Parker, J. Armstrong, M. Zanetti, G. Škoro, S. P. Waller, D. Zacek, C. A. Smith, M. J. Capstick, D. J. McPhail, D. E. Pooley, G. D. Howells, G. Gorini and F. Fernandez-Alonso, The neutron guide upgrade of the TOSCA spectrometer, Nucl. Instrum. Methods Phys. Res., Sect. A, 2018, 896, 68–74 CrossRef CAS.
- O. Arnold, J. C. Bilheux, J. M. Borreguero, A. Buts, S. I. Campbell, L. Chapon, M. Doucet, N. Draper, R. F. Leal, M. A. Gigg, V. E. Lynch, A. Markvardsen, D. J. Mikkelson, R. L. Mikkelson, R. Miller, K. Palmen, P. Parker, G. Passos, T. G. Perring, P. F. Peterson, S. Ren, M. A. Reuter, A. T. Savici, J. W. Taylor, R. J. Taylor, R. Tolchenoy, W. Zhou and J. Zikoysky, Mantid-Data analysis and visualization package for neutron scattering and mu SR experiments, Nucl. Instrum. Methods Phys. Res., Sect. A, 2014, 764, 156–166 CrossRef CAS.
- M. M. Nolasco, A. Ribeiro, P. J. A. Ribeiro-Claro, S. Rudic, C. F. Araujo and P. D. Vaz, Exploring asymmetry-induced entropy in deep eutectic solvents, STFC ISIS Neutron Muon Source, 2018 DOI:10.5286/ISIS.E.RB1810054.
- M. R. Johnson, K. Parlinski, I. Natkaniec and B. S. Hudson, Ab initio calculations and INS measurements of phonons and molecular vibrations in a model peptide compound - urea, Chem. Phys., 2003, 291, 53–60 CrossRef CAS.
- ISIS-RAL-STFC, TOSCA Database.
- S. J. Clark, M. D. Segall, C. J. Pickard, P. J. Hasnip, M. J. Probert, K. Refson and M. C. Payne, First principles methods using CASTEP, Z. Krist., 2005, 220, 567–570 CAS.
- K. Refson, P. R. Tulip and S. J. Clark, Variational density-functional perturbation theory for dielectrics and lattice dynamics, Phys. Rev. B, 2006, 73, 155114 CrossRef.
- J. P. Perdew, K. Burke and M. Ernzerhof, Generalized gradient approximation made simple, Phys. Rev. Lett., 1996, 77, 3865–3868 CrossRef CAS PubMed.
- U. Böhme and M. Gerwig, Tetramethylammonium Chloride Determination, Experimental Crystal Structure Determination, CCDC 1874521, 2018 Search PubMed.
- S. Tang, Z. Zhao, J. Chen, T. Yang, Y. Wang, X. Chen, M. Lv and W. Z. Yuan, Tetramethylammonium bromide, Experimental Crystal Structure Determination, CCDC 2108393, 2022 Search PubMed.
- J. R. Schmid, N,N-diethyl-N-methylethanaminium bromide, Experimental Crystal Structure Determination, CCDC 2015011, 2021 Search PubMed.
- R. J. Staples, Z. Kristallogr. - New Cryst. Struct., 1999, 214, 231–232 CAS.
- V. Milman, A. Perlov, K. Refson, S. J. Clark, J. Gavartin and B. Winkler, Structural, electronic and vibrational properties of tetragonal zirconia under pressure: a density functional theory study, J. Phys.: Condens. Matter, 2009, 21, 485404 CrossRef PubMed.
- K. Dymkowski, S. F. Parker, F. Fernandez-Alonso and S. Mukhopadhyay, AbINS: The modern software for INS interpretation, Phys. B, 2018, 551, 443–448 CrossRef CAS.
- C. I. Ratcliffe and T. C. Waddignton, Torsional modes in multimethylammonium halides, J. Chem. Soc., Faraday Trans. 2, 1976, 72, 1935–1956 RSC.
- J. Eckert, T. D. Sewell, J. D. Kress, E. M. Kober, L. L. Wang and G. Olah, Vibrational analysis of the inelastic neutron scattering spectrum of tetramethylammonium borohydride by molecular dynamics simulations and electronic structure calculations, J. Phys. Chem. A, 2004, 108, 11369–11374 CrossRef CAS.
- Y. Yan, J. T. T. Mague and J. P. P. Donahue, A polymorph of tetraethylammonium chloride, Acta Crystallogr., Sect. E: Struct. Rep. Online, 2009, 65, O1491–U1779 CrossRef CAS PubMed.
- H. V. Brand, L. A. Curtiss, L. E. Iton, F. R. Trouw and T. O. Brun, Theoretical and inelastic neutron-scattering studies of tetraethylammonium cation as a molecular sieve template, J. Phys. Chem., 1994, 98, 1293–1301 CrossRef CAS.
- D. O. Abranches, L. P. Silva, M. A. R. Martins, L. Fernandez, S. P. Pinho and J. A. P. Coutinho, Can cholinium chloride form eutectic solvents with organic chloride-based salts?, Fluid Phase Equilib., 2019, 493, 120–126 CrossRef CAS.
- C. Vilela, C. S. R. Freire, C. Araújo, S. Rudić, A. J. D. Silvestre, P. D. Vaz, P. J. A. Ribeiro-Claro and M. M. Nolasco, Understanding the structure and dynamics of nanocellulose-based composites with neutral and ionic poly(methacrylate) derivatives using inelastic neutron scattering and DFT calculations, Molecules, 2020, 25, 1689 CrossRef CAS PubMed.
- Q. I. Li and T. C. W. Mak, Hydrogen-Bonded Urea-Anion Host Lattices. Part 4. Comparative Study of Inclusion Compounds of Urea with Tetraethylammonium and Tetraethylphosphonium Chlorides, J. Inclusion Phenom. Mol. Recognit. Chem., 1997, 28, 151–161 CrossRef CAS.
- A. van den Bruinhorst, J. Avila, M. Rosenthal, A. Pellegrino, M. Burghammer and M. Costa Gomes, Defying decomposition: the curious case of choline chloride, Nat. Commun., 2023, 14, 6684 CrossRef CAS PubMed.
Footnotes |
| † Electronic supplementary information (ESI) available. See DOI: https://doi.org/10.1039/d3cp04961b |
| ‡ Optimized crystal structure data for [N2,2,2,1]Cl available at https://www.crystallography.net/tcod/30000119.html |
| This journal is © the Owner Societies 2024 |


