 Open Access Article
Upper storage-capacity limit and multiple occupancy phenomena in H2-hydroquinone clathrates using Monte Carlo and DFT simulations
B.
Parage
ab,
C.
Miqueu
b,
M.
Pérez-Rodríguez†
a,
T.
Méndez-Morales
c and
M. M.
Piñeiro
 *a
*a
aUniversidade de Vigo, Departamento de Física Aplicada, E-36310, Vigo, Spain. E-mail: mmpineiro@uvigo.es
bLaboratoire des Fluides Complexes et leurs Réservoirs, UMR 5150, Université de Pau et des Pays de l'Adour, 64600, Anglet, France
cGrupo de Nanomateriais, Fotónica e Materia Branda, Departamento de Física de Partículas, Universidade de Santiago de Compostela, Campus Vida s/n E-15782, Spain
First published on 5th February 2024
Abstract
The upper hydrogen-storage capacity limit of the β-hydroquinone clathrate has been investigated using hybrid Grand–Canonical Monte Carlo/Molecular Dynamics simulations, for temperatures ranging from 77 K to 300 K. The evolution with pressure of the cage occupancies has been monitored in detail, describing the progressive nature of the uptake process. It is found that the storage capacity of the pure β-HQ + H2 clathrate could reach 0.6 wt% (weight percentage) only for pressures above 1400 bar, at ambient temperature. The enhancement of the storage capacities by the multiple occupancy phenomenom was accordingly shown to be very limited by the need for extreme conditions. Following this observation, an unmodified version of the van der Waals & Platteeuw theory was applied allowing for the prediction of experimentally accessible formation pressures. Density functional theory calculations were addittionnaly performed to comprehensively characterize the hydrogen diffusion process within the clathrate crystalline structure, considering different occupancy scenarios.
1 Introduction
In the race for the development of renewable energies, hydrogen is now clearly one of the most credible alternatives to fossil fuels. Despite the extensive research carried out in recent years, its widespread use is still hindered by several technical drawbacks, one of them being the lack of a method encompassing both safety and efficiency for storage and transport.1,2 The two current main processes, gas compression at 300–700 bar or liquefaction at 20 K have, respectively, high financial and energetic cost weakening the progress towards the so-called Hydrogen Economy. For a complete description of the current progress towards the development of hydrogen use as a global energy vector, one can refer for instance to the comprehensive review by Staffell et al.,3 and references therein.The search for possible alternatives is nowadays focused on different targets, with a particular emphasis on inclusion solids, that can store hydrogen either through physical or chemical entrapment.4 Among the wide range of candidates (for instance carbon porous,5,6 Mg-based,7 solid-state,8 and metal organic framework (MOF) materials9), clathrate materials stand out for their low cost, operational safety and fully reversible reactions.10 Clathrates are solid-state molecular complexes consisting in a crystalline lattice able to host small molecules within networks of nano-sized cavities.11,12 The encaging species is then termed as host, while the encaged one is referred to as guest.
Among the organic compounds able to form clathrates, the benzene-1,4-diol, or hydroquinone (denoted as HQ), appears today as one interesting track for storing molecular hydrogen. Four polymorphic forms have so far been observed for HQ (α,β,γ,δ), but only the so-called β-phase actually corresponds to a proper clathrate.13–15 The HQ clathrate is usually formed by recrystallization from solution using an adequate solvent (acetone, ethanol, etc.), in which are dissolved both the host molecules (HQ) and the guest species.16 Another way to obtain it is by pressurizing the ambient stable α-phase with the gas species of interest.17
Three different types of β-hydroquinone structure exist depending on the type of encaged molecule. For CO2, the structure is said of type I and pertains to the R![[3 with combining macron]](https://www.rsc.org/images/entities/char_0033_0304.gif) symmetry group, with unit cell dimensions a = b = 16.207 ± 0.006 Å and c = 5.780 ± 0.002 Å.16 The crystalline arrangement consists in independent linear channels of interconnected cavities. Each cavity is delimited by two parallel planar hexagonal rings of H-bonded hydroxyl groups, and retains a roughly spherical form, with a ∼4 Å radius. The overall stoichiometry corresponds to 1
symmetry group, with unit cell dimensions a = b = 16.207 ± 0.006 Å and c = 5.780 ± 0.002 Å.16 The crystalline arrangement consists in independent linear channels of interconnected cavities. Each cavity is delimited by two parallel planar hexagonal rings of H-bonded hydroxyl groups, and retains a roughly spherical form, with a ∼4 Å radius. The overall stoichiometry corresponds to 1![[thin space (1/6-em)]](https://www.rsc.org/images/entities/char_2009.gif) :
:![[thin space (1/6-em)]](https://www.rsc.org/images/entities/char_2009.gif) 3 cavity to HQ molecules.
3 cavity to HQ molecules.
Regarding hydrogen, the β-HQ + H2 clathrate was observed by Strobel et al.17 to form at much lower pressures and presented a better guest retention through heating than simple H2 hydrates.18 experimentally highlighted high pressure multiple occupancy of the cavities – i.e. the possibility to find more than one guest molecule per cavity – with up to full triple occupancy at ∼3 GPa. Molecular dynamics simulations performed by Daschbach et al.19 showed that high loadings (3–4 H2 per cavity) exhibited enhanced stability at low temperatures (20 K), but tended to become globally unfavorable at ambient temperature. Han et al.20 filled with hydrogen an empty β-HQ structure, initially formed with CO2, reporting so far the fastest uptake and release for hydrogen (2 s), and weight percentages of 0.19 wt% and 0.38 wt% at 10 MPa and 35 MPa, respectively, both at ambient temperature. Recent experimental and simulation investigations showed that these values could be readily improved either by dehydrogenating, doping or confining the HQ framework, reaching uptake rates higher than 6.5 wt% in some cases.17,21,22
Nonetheless, several issues must be addressed before the hydroquinone clathrate may be envisaged as a widespread hydrogen storage media. Among the lingering questions, the determination of the upper storage capacity limit, along with the pressure and temperature dependence of multiple occupancy, remain unanswered. Also, the lack of detailed experimental or theoretical data concerning the β-HQ + H2 clathrate equilibrium curve remains crippling for foreseeing experimental manipulations.
The aim of this work is to computationally determine the hydrogen-storage capacity of the pure H2-hydroquinone clathrate at several temperatures and pressures, by performing hybrid Grand Canonical Monte Carlo/Molecular Dynamics simulations. Results are discussed in the light of the current clathrate thermodynamic modeling, and used to evaluate the theoretical formation conditions of the β-HQ + H2 clathrate above 200 K. In addition, the inter-cage transition barriers for various cage occupancies are computed using density functional theory, highlighting the inner dynamics of the uptake process.
2 Methodology
2.1 Hydrid grand canonical Monte Carlo/molecular dynamics simulations
Since we aim to determine the storage capacity of the β-HQ + H2 clathrate, the thermodynamic variable we are basically interested in is the average number of H2 molecules in the β-structure at equilibrium with fixed thermodynamic conditions. Such a quantity can be accessed by performing Grand Canonical Monte Carlo (GCMC) simulations. This method was successfully employed by Papadimitriou et al.23 in the case of H2 hydrates.When applying this technique, H2 gas molecules are randomly exchanged from within a β-structure at fixed volume V, and a fictitious gas reservoir imposing both temperature T and chemical potential μ. One H2 molecule is thus created or removed with equal probability at a random position inside the structure, generating a new micro-state that can either be accepted or rejected on an energy criterion. The acceptance probabilities are those formulated by Metropolis et al.,24 and allow to accurately sample the states which contribution to equilibrium is most significant.
In order to capture the H2 inter-cage diffusion effect, the GCMC algorithm is in this work interspersed with molecular dynamics (MD) steps, as recently performed on the same system by Méndez-Morales et al.25 The number of molecules in the system remains consequently briefly fixed while Newton's equations of motion are iteratively solved over few time steps, by means of the selected molecular model for hydrogen and hydroquinone. Thus, the employed method corresponds to hydrid Grand Canonical Monte Carlo/Molecular Dynamics simulations.
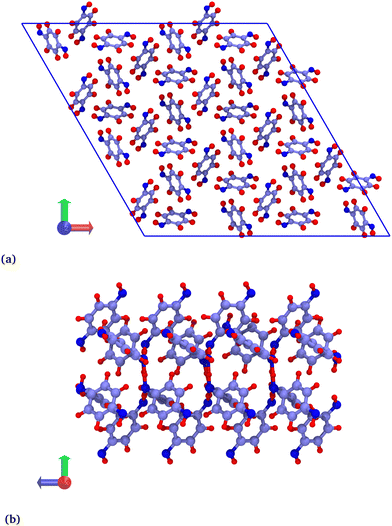
Hybrid GCMC/MD simulations were carried out in a rhombohedral box corresponding to a 2 × 2 × 8 replicated β-HQ unit cell (Fig. 1a), i.e. 288 HQ molecules and 96 cavities. The atomic positions are those of the β-HQ + CO2 clathrate, experimentally obtained by Torré et al.16 using X-ray diffraction. This is actually of no importance since the structure was shown to adapt to the type of encaged guest.26
For HQ, the molecular model is parameterized using the classical OPLS-AA force field,27 but using the partial atomic charges recalculated by.26 This combination was shown to describe with accuracy the structure of the β-HQ clathrates for different pure-guest and mixture clathrates. Comesaña et al.26 Regarding hydrogen, the two-sites Cracknell model28 with a 0.7414 Å bond length is employed.
Simulations were performed using the LAMMPS29 2020 simulation package. Parameters for energy calculation are those usually applied when simulating the β-HQ structure.19,25 Both van der Waals and Coulombic interactions were treated with a real space cutoff of 11 Å, and a dispersive long range tail correction. The SHAKE30 algorithm was used to constraint bonds and angles to their equilibrium values. Periodic boundary conditions were applied in the three directions of space. Temperature was imposed by means of the Nose–Hoover thermostat with a 10 fs relaxation time. Investigated temperatures are 77 K, 150 K, 200 K, 250 K and 300 K at pressures from 10 bar to 5000 bar.
Each run consisted in 400![[thin space (1/6-em)]](https://www.rsc.org/images/entities/char_2009.gif) 000 MD (time-)steps of 1 fs, interrupted every 10 time-steps by 10 consecutive GCMC insertion-deletion attempts. The starting configuration either corresponds to an empty β-HQ structure or a triply loaded one (i.e. 3H2/cavity). It was preliminary assessed that the final results were independent of the initial loading of the structure by computing complete isotherms starting from both configurations, reaching in both cases the same final equilibrium state. The only difference being the computing time needed to reach equilibrium, the starting configurations were subsequently chosen the closest to the guessed equilibrium state for given T and P conditions. For every system, a first run was realized to equilibrate the average number of H2 molecules into the structure. A second identical run was then made starting from the equilibrated box, dumping the atomic coordinates every 20 steps. The average number of H2 molecules was finally accessed by averaging the 20
000 MD (time-)steps of 1 fs, interrupted every 10 time-steps by 10 consecutive GCMC insertion-deletion attempts. The starting configuration either corresponds to an empty β-HQ structure or a triply loaded one (i.e. 3H2/cavity). It was preliminary assessed that the final results were independent of the initial loading of the structure by computing complete isotherms starting from both configurations, reaching in both cases the same final equilibrium state. The only difference being the computing time needed to reach equilibrium, the starting configurations were subsequently chosen the closest to the guessed equilibrium state for given T and P conditions. For every system, a first run was realized to equilibrate the average number of H2 molecules into the structure. A second identical run was then made starting from the equilibrated box, dumping the atomic coordinates every 20 steps. The average number of H2 molecules was finally accessed by averaging the 20![[thin space (1/6-em)]](https://www.rsc.org/images/entities/char_2009.gif) 000 outputted configurations. The occupancy repartition – i.e. the fraction of cavity occupied by 1, 2, etc., H2 molecules – was analysed with a python code using the MDanalysis library.31
000 outputted configurations. The occupancy repartition – i.e. the fraction of cavity occupied by 1, 2, etc., H2 molecules – was analysed with a python code using the MDanalysis library.31
2.2 Fugacity model
The determination of fugacity prior to each molecular simulation calculation deserves a detailed comment at this point. In the simulation, fixing temperature and pressure is equivalent to fixing the temperature and the chemical potential of the fictitious H2 reservoir. An accurate fugacity model is therefore required in order to simulate real fluid conditions. The Soave–Redlich–Kwong32 equation of state (SRK EoS) is used in this work with hydrogen critical parameters Tc = 33.0 K, Pc = 12.84 bar and ω = −0.219.33Following the standard procedure for cubic EoS, the fugacity coefficient Φ(T, P) can be derived in terms of the compressibility factor Z:
 | (1) |
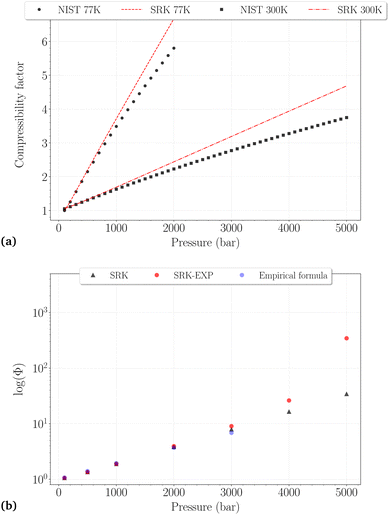 | ||
| Fig. 2 (a) Comparison between the NIST reported values and the SRK calculated values for the compressibility factor of H2 at 77 K (dashed line, black circles) and 300 K (dashdotted line, black squares). (b) Comparison of the fugacity coefficients at 300 K obtained with different methods: SRK-EOS (black triangles), SRK-EOS with experimental density values (red circles),34 empirical formula (blue circles). | ||
Whatever the temperature, it is not surprising to find that the SRK EoS overestimates the compressibility factor, roughly from 500 bar and 1000 bar at 77 K and 300 K, respectively, with deviations increasing for denser phases. At 300 K, a very good agreement between the different fugacity coefficients is observed up to 3000 bar, although the deviations on Z reach ∼15%. It can thus be reasonably assumed that Φ may be trusted slightly beyond the PVT accuracy of the EoS used. Fixing an approximate and arbitrary limit of 10% error on the compressibility factor, we consider that the calculated fugacity coefficients can be reasonably trusted up to 1500 bar at 77 K, 2000 bar at 150 K, 200 K and 250 K, and 3000 bar at 300 K. Above these thresholds, they are more likely highly underestimated, as observed for the last two points on the right side of Fig. 2b.
2.3 Density functional theory calculations
Density Functional Theory (DFT) is based on the fact that finding the ground energy of a many-body system can be achieved by minimizing a so-called energy functional, with respect to the electronic density. The aim of this part is to use DFT to calculate the transition energy barriers of an H2 molecule going from a filled cage to an empty adjacent one. Similar calculations have already been performed to study guest transitions in hydrates,36,37 and even in some case for the β-HQ + H2 clathrate.38 This methodology will be shown to provide an interesting complementary approach to the study of the average clathrate cage occupancies.Calculations were carried out with the GAUSSIAN 16 package.39 The Perdew, Burke and Ernzerhof (PBE) exchange–correlation functional40 was used for its accuracy in the modeling of H-bonded structures,41 along with the Grimme correction for dispersive interactions. In order to reduce calculation time, the 3-21G Pople-type basis set is employed.
The system consists in four empty aligned cages (338 atoms, Fig. 1b), constructed and preoptimized by Pérez-Rodríguez et al.38 Three initial configurations were built by placing from one to three H2 molecules in one of the central cages. Atom coordinates were those reported by Daschbach et al.19 using MD simulations. Structures were first optimized, constraining only the positions of the outer oxygens in order to allow the cell to adapt to the loading.38 The relevant H2 molecule was then displaced following a path parallel to the channel axis, from its initially optimized position to the center of the adjacent cage, by creating 10 intermediate configurations. The energy barrier was computed by making an optimization/single-point energy calculation on each one of the equi-spaced path positions, this time also constraining the position of the moving H2 molecule. The three optimized initial configurations used for computing the transitions barriers are shown on Fig. 3. The highlighted atoms on Fig. 4 correspond to the fixed outer oxygens mentioned above.
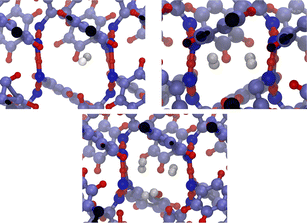 | ||
| Fig. 3 Filled β-HQ cages with from one to three H2 molecules used in DFT calculations. Same atom color code as in Fig. 1a and b. H2 guest molecules in white. | ||
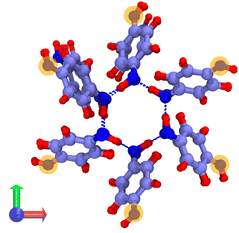 | ||
| Fig. 4 Cross section of a β-HQ channel (DFT system) viewed along the z-axis. Highlighted atoms correspond to the fixed outer oxygens during the optimization process. Same atom color code as in Fig. 1a and b. | ||
2.4 Clathrate classical thermodynamic modelling
The main approach concerning the macroscopic thermodynamic modelling of clathrates corresponds to the theory initially developed by van der Waals and Platteuw (vdW&P),42 1958. Based on statistical mechanics, this model allows for the prediction of the formation conditions and phase equilibria of clathrates with a wide range of guests. Concerning gas-hydroquinone clathrates, the equilibrium curve is derived by solving the equality between the chemical potentials of the α-phase and the β-phase at given temperature and pressure conditions. In practice the chemical potentials are replaced by their differences with those of the empty metastable β-phase, facilitating calculations. The original version of the theory was recently revised by Conde et al.43 in order to account for the possible solubility of guest molecules in the α-phase, as it was experimentally observed for hydrogen with HQ.44 The equilibrium condition accordingly writes:43| Δμβ = Δμα + Δμα-sol | (2) |
| Δμβ − Δμα-sol = RT(να − νβ)ln(1 − θ) | (3) |
 | (4) |
 | (5) |
 | (6) |
 | (7) |
 | (8) |
In the forthcoming calculations (see Section 3.3), the classical Lorentz–Berthelot mixing rules are used to estimate the H2-HQ pair potential parameters, with HQ parameters (σ = 2.90 Å, ε/kB = 150.06 K),42 and H2 parameters (σ = 2.93 Å, ε/kB = 37.00 K).46
For more than one guest into a cavity (k ≥ 2), guest–guest interactions have to be accounted for in the calculation of C(k), making the generalisation of eqn (6) a nested multidimensional integral.47 This latter problem has so far rendered cumbersome the inclusion of multiple occupancy phenomena in the modelling of clathrates, even though approximate methods have been proposed.48
3 Results and discussion
3.1 Storage capacities at cryogenic temperature (77 K)
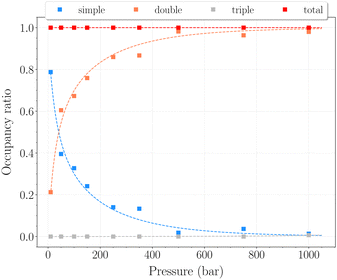
The set of simulations performed at 77 K was done for pressures between 10 and 1250 bar. Initial configurations correspond to a triply loaded clathrate, since it was found to reach faster equilibrium than the empty one.On Fig. 5, the H2 uptake in the clathrate as a function of pressure is shown. The content varies from ∼0.73 wt% to ∼1.20 wt%, with at first a strong dependence on pressure, below 500 bar. This trend is followed by a clearly marked stabilisation in the range 500–1250 bar. This is undoubtedly related to the evolution of the average cavity occupancy ratios shown on Fig. 6. Within the examined pressure range, the structure already appears to be fully occupied, with 80% of singly occupied cavities and 20% of doubly occupied cavities, at 10 bar. A quite fast inversion of this order is then observed with the increase of pressure, corresponding to the strong dependence cited above. The plateau observed on Fig. 5 matches the saturation of the structure with two H2 per cavity, double occupancy becoming exclusive at 1000 bar. An apparent discrepancy with the experimental value reported by Woo et al.21 of ∼1.63 wt% at 80 bar and 77 K is to be noted. This experimental result corresponds to 2–3 H2 per cavity, which contradicts the non-occurence of triple occupancy in our GCMC simulations. The accuracy of the employed classical description for the host–guest interactions might be arguable at such a low temperature, as it would lead to a wrong sampling of the phase-space in the case it is inadequate.
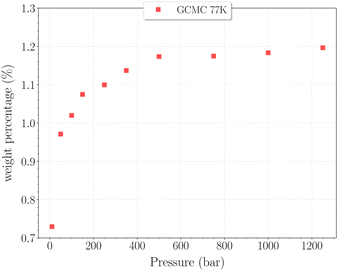 | ||
| Fig. 5 Hydrogen weight percentage as a function of pressure for the β-HQ clathrate at 77 K (red squares). | ||
3.2 Storage capacities at higher temperatures (200–300 K)
For higher temperatures, the starting configuration for the simulations corresponds to the empty β-HQ structure, for identical reasons as in 3.1. The H2 uptake in the clathrate as a function of pressure is shown on Fig. 7 and 8.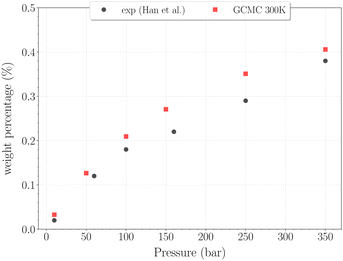 | ||
| Fig. 7 Hydrogen weight percentage as a function of pressure for the β-HQ clathrate at 300 K (red squares) compared to20 results (black circles). | ||
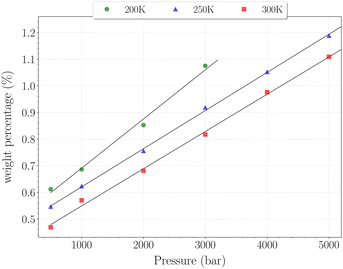 | ||
| Fig. 8 Hydrogen weight percentage as a function of pressure for the β-HQ clathrate at 200 K (circles), 250 K (triangles) and 300 K (squares), with linear fits. | ||
The H2 content obtained in simulation at 300 K and up to 350 bar is shown on Fig. 7, alongside the experimental values reported by Han et al.20 A remarkably accurate correspondence is observed in this comparison, supporting the soundness of the method employed, at least in a range of temperatures where the classical description remains accurate enough. Results for higher pressures are reported in Fig. 8. Again, a really good correlation is obtained with the experimental weight percentage reported by Strobel et al.17 of ∼0.64 wt% at 2000 bar and 296 K. A clearly marked linear dependence of the H2 uptake with pressure is observed for all three temperatures. The slope coefficients are ∼18.5 × 10⁻⁵ wt% bar−1 at 200 K and ∼14.0 × 10⁻⁵ wt% bar−1 at both 250 K and 300 K, which turn out to be 50 times greater than values reported for H2 hydrates at similar conditions.23 In any case, it is worth recalling that the highest pressure points of each curve are likely to be underestimated, as the SRK fugacity becomes inaccurate for H2 at such high pressures, as discussed in Section 2.2.
In this range of temperatures, it is rather difficult to fill the structure, as it requires for instance almost 1400 bar to reach the stoichiometric threshold of one H2 per cavity (or 0.6 wt%) at 300 K. Lowering the temperature allows a faster uptake with pressure but still too slow-paced to reach interesting values under conditions relevant to practical industrial applications. As it can been seen on Fig. 9, the filling is primarily done with the structure nearly fully accommodating one H2 per cavity. At 250 K, pressures greater than 2800 bar are required for doubly occupied cavities to become dominant, while triple occupancy remains nearly negligible below 5000 bar. Similar trends are observed at 200 K and 300 K but shifted toward a lower and higher pressure range, respectively. As temperature rises, the multiple H2 guest occupation modes for HQ clathrates are shifted to remarkably higher pressure ranges. These observations are consistent, although differing by roughly one order of magnitude, with the experimental estimation of the β-HQ + H2 occupancy done by18 from volume considerations of the pure components. At 343 K, they estimate the thresholds of two and three H2 per cavity to be reached around ∼1.5 GPa and ∼3 GPa, respectively. Also, our results match previous observations reporting a greater stability of lower loading at ambient conditions.19
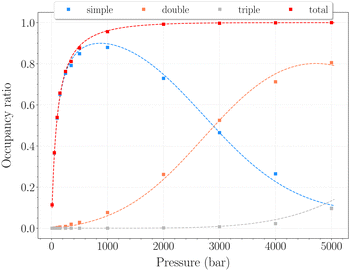 | ||
| Fig. 9 Occupancy ratio of the cavities as a function of pressure for the β-HQ clathrate at 250 K. Same color code as in Fig. 6. | ||
3.3 Theory-simulation comparative analysis
The determination of the cage occupancy's pressure dependence brings useful insights for the theoretical thermodynamic modelling of this system. The theory elements used in the following are those presented and discussed in Section 2.4.On the one hand, the presented results show that the enhancement of the β-HQ clathrate storage capacities by the H2 multiple occupancy phenomena is in practice very limited by the need for extremely high pressures. For temperatures above 200 K, it is reasonable to assume that the clathrate equilibrium curve is located within a pressure range where single occupancy remains practically exclusive. This latter assumption allows to predict the formation conditions of the β-HQ + H2 clathrate with no need to account for multiple occupancy in the thermodynamic modelling. Using a Fortran 90 code, eqn (2) was solved, yielding theoretical formation pressures of 30.7 bar at 200 K, 78.4 bar at 250 K and 151.2 bar at 300 K. These values are compatible with the experimentally reported formation occurrence of the clathrate from the α-phase at 700 bar and 296 K.17 Formation conditions at 77 K and 150 K predicted with this method should nevertheless not be trusted, since doubly occupied cages become not negligible even at low pressures.
On the other hand, the observed trends on Fig. 6 and 9 demonstrate the progressive nature of the filling process. The structure will first nearly fully accommodate one H2 per cavity before doubly occupied cavities can occur. It is obvious here that doubly occupied cavities almost exclusively result from the filling of singly occupied ones, which is not necessarily the case with H2 hydrates.23 This behavior is a remarkable validation for the Langmuir-type functions introduced in eqn (5), which are widely used to model such isotherms. The conclusions drawn from the GCMC simulations can thus be exploited to access useful theoretical parameters.
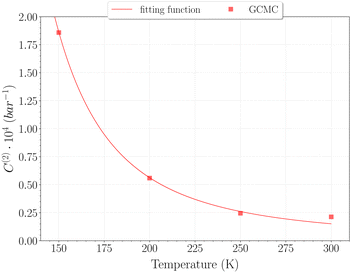
Taking advantage of the shape of the Langmuir isotherms, the double occupancy Langmuir constant C(2) was easily evaluated by linear regression of the GCMC data. The following relation, derived from eqn (5):
 | (9) |
 | (10) |
Due to the absence of a straightforward expression like eqn (9), the C(1) Langmuir constant was obtained by directly fitting the GCMC occupancy data with the θ1-isotherm, keeping the maximum occupancy fixed at three H2 molecules within a cavity.
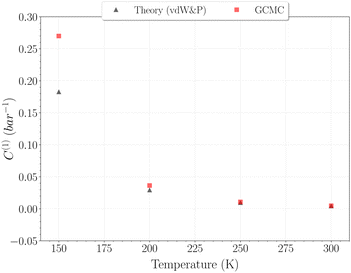
The selection of the θ1-isotherm, as opposed to θ2, is most appropriate for determining C(1), given that contributions of C(2) and C(3) remain of second order in this isotherm. The obtained values for C(1) from 150 K are shown on Fig. 11, alongside the theoretical ones calculated from eqn (6). A quite satisfying match is observed for the three last temperatures (above 200 K). This correlation further underscores the quality of our results in this temperature range, as the theoretical and simulation approaches utilize very different tools, be it only in the treatment of host–guest interactions or phase-space sampling. Both GCMC points at 77 K and 150 K are quite far form those calculated theoretically, being over and underestimated, respectively. The classical treatment of inter-molecular interaction being likely to be discutable at these temperatures, neither method should be unequivocally considered more reliable. It is worth mentioning that values obtained with this method for the C(2) constant converged to the same of that using eqn (9), whereas again no stable values could be obtained for C(3).
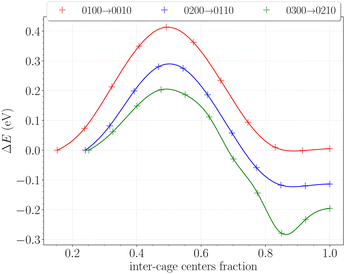
3.4 Inter-cage transition barriers
The inter-cage transition barriers for initially up to three H2 in a cavity are reported on Fig. 12. The x-axis and y-axis correspond respectively to the fractional inter-cage centers distance, and to the total energy difference with respect to the H2 initial position.The transition barrier peaks are estimated at 0.41 eV for the 0100 → 0010 transition, 0.29 eV for the 0200 → 0110 transition and 0.20 eV for the 0300 → 0210 transition. For comparison, the same calculations performed on hydrates between two large cages yielded barriers of 0.23 eV, 0.30 eV and 0.25 eV at similar loadings.49 The proximity of these values – especially for initial double and triple occupancies – reflects the structural similarities between the hydroxyl rings in the β-HQ clathrate and the water hexamers delimiting hydrate cages. Also, the obtained value for the 0100 → 0010 transition perfectly matches the linear dependence of the barrier peak with the atomic radii of the guest found by Rodríguez-García et al.50 using MD umbrella sampling, with an error below 5% on their predicted value of 0.39 eV at 310 K and 10 bar.
In our case, increasing the occupancy visibly decreases the barrier peak, by as much as 30% for two H2 in a cavity and 50% for three H2 in a cavity, relative to when the transported H2 is alone in the cage. Moreover, barrier peaks significantly increase when looking at the reverse paths, soaring respectively to 0.42 eV and 0.58 eV for the 0110 → 0200 and 0210 → 0300 transitions. These findings support the previous observations made on the filling process of the system. It is now clear that the structure will firstly accommodate one H2 per cavity, since multiply occupied cages will be easily scattered in the neighboring ones. The reverse process is even relatively less likely as the barriers significantly increase for the hop back. This is fully consistent with previous observations reporting enhanced intercage diffusion for doubly and triply occupied cavities,19 further corroborating our understanding of the system's behavior.
Even though these results allow for a convenient way to interpret the GCMC data, it should be remembered that DFT calculations amount to a temperature of 0 K. Concomitant dynamical effects of both the H2 molecules and the HQ lattice should be considered in order to establish a more accurate picture of the inter-cage diffusion phenomena at ambient temperatures.
4 Conclusions
The aim of this work was to investigate the hydrogen-storage capacity of the pure H2-hydroquinone clathrate through molecular simulations in order to evaluate its feasibility as a storage media for molecular hydrogen. The presented results allow to gather and complete the so far scarce and scattered data on this system, but also to unfold further experimental and theoretical research perspectives.The determination of the H2 uptake with pressure was achieved by performing Hybrid Grand–Canonical Monte Carlo/Molecular Dynamics simulations at various thermodynamic conditions. Results demonstrate a low uptake of hydrogen at ambient conditions, even for pressures that can be regarded as extreme for practical applications (0.6 wt% at 1400 bar and 300 K), confirming the available experimental data.17,20 It was shown that working at cryogenic temperature would allow a faster uptake but still requiring at least 500 bar to reach the double stoichiometric threshold of two H2 per cavity. The multiple occupancy phenomena was accordingly found not to allow for a significant improvement of the storage capacities, as every occupancy degree was found to result from the previous one. One explanation for these findings could be that the stabilization of the host lattice, resulting from the inclusion of H2 molecules, is too small compared to the corresponding entropy decrease, thus hindering the reduction of the total free-energy. These results therefore highly question the potential use of the pure hydroquinone clathrate for hydrogen storage exclusively, as the determined uptakes really fall short of the ultimate 6.5 wt% target fixed by the Department of Energy of the United States.10
The transition barriers for various cage occupancies were computed in parallel using density functional theory. The obtained values show a decrease of the barrier peak when increasing the cage loading, providing further confirmation of the already reported easy hydrogen diffusion along the channels of the β-structure.19 Also, it is now clear that the main advantage of the hydroquinone clathrate with H2 lies in its fast capture and release of the gas, which constitutes a major advantage for industrial applications.4
Beyond giving information on the filling process, the detailed analysis of the occupancy ratios provided guiding insights for the thermodynamic modeling of the β-HQ + H2 clathrate. A version of the theory only accounting for singly occupied cavities was theoretically found to be sufficient for predicting, we hope, accurate formation pressures at temperatures above 200 K. The determined conditions are much more moderate than those for H2 hydrates, and now await for experimental validation.
Further simulation investigations on the β-HQ + H2 clathrate should now focus on ways to improve its storage capacity. Among the most interesting tracks, doping the framework with fullerene (C60) was recently demonstrated to allow a great enhancement of the hydrogen uptake.21 The effect of more standard promoters in the gas phase, such as tetrahydrofuran or carbon dioxide, has not been investigated yet. It is reasonable to think that the distortion of the lattice resulting of the inclusion of bigger molecules may lead to an increase of the maximum cage occupancy. Ultimately, the study of the hydroquinone clathrate's stability in nanoporous matrices was recently mentioned as necessary in order to asses the potential of the confining method at the theoretical level.22
Author contributions
Baptiste Parage: formal analysis (lead); investigation (equal); conceptualization (equal); methodology (equal); writing – original draft (lead). Christelle Miqueu: conceptualization (equal); investigation (equal); methodology (equal); supervision (equal); writing – review editing (equal). Martín Pérez-Rodríguez: conceptualization (equal); investigation (supporting); methodology (equal); writing – review editing (equal). Trinidad Méndez-Morales: conceptualization (equal); investigation (supporting); methodology (equal); writing – review editing (equal). Manuel M. Piñeiro: conceptualization (equal); investigation (equal); methodology (equal); supervision (equal); writing – review editing (equal); writing – original draft (supporting); funding acquisition (lead); project administration(lead).Conflicts of interest
The authors declare no conflict of interest.Acknowledgements
The authors acknowledge financial support from Spanish Ministerio de Ciencia e Innovación (MCIN), through grant Ref. PID2021-125081NB-I00, and computational resources provided by Centro de Supercomputación de Galicia (CESGA, https://www.cesga.es). MPR acknowledges “María Zambrano” contract of the Univ. de Vigo, financed by the Spanish Ministerio de Universidades/33.50.460A.752 and by “European Union NextGenerationEU/PRTR”, and grant Ref. CNS2022-135881 financed by MCIN/AEI/10.13039/501100011033. CM and BP acknowledge the E2S UPPA hub Newpores (ANR-12-IDEX-0002).References
- J. Andersson and S. Grönkvist, Int. J. Hydrogen Energy, 2019, 44, 11901–11919 CrossRef CAS.
- R. Moradi and K. M. Groth, Int. J. Hydrogen Energy, 2019, 44, 12254–12269 CrossRef CAS.
- I. Staffell, D. Scamman, A. Velazquez Abad, P. Balcombe, P. E. Dodds, P. Ekins, N. Shah and K. R. Ward, Energy Environ. Sci., 2019, 12, 463–491 RSC.
- H. P. Veluswamy, R. Kumar and P. Linga, Appl. Energy, 2014, 122, 112–132 CrossRef CAS.
- C. Gu, G.-H. Gao and Y.-X. Yu, J. Chem. Phys., 2003, 119, 488–495 CrossRef CAS.
- K. Raja Karthick, T. Anusuya and V. Kumar, Phys. Chem. Chem. Phys., 2023, 25, 262–273 RSC.
- F. Cuevas, D. Korablov and M. Latroche, Phys. Chem. Chem. Phys., 2012, 14, 1200–1211 RSC.
- A. C. Stowe, W. J. Shaw, J. C. Linehan, B. Schmid and T. Autrey, Phys. Chem. Chem. Phys., 2007, 9, 1831–1836 RSC.
- Z. Xiaocheng, L. Pengxiao and Z. Ying, Inorg. Chim. Acta, 2023, 557, 121683 CrossRef.
- A. Gupta, G. V. Baron, P. Perreault, S. Lenaerts, R.-G. Ciocarlan, P. Cool, P. G. Mileo, S. Rogge, V. Van Speybroeck, G. Watson, P. Van Der Voort, M. Houlleberghs, E. Breynaert, J. Martens and J. F. Denayer, Energy Storage Mater., 2021, 41, 69–107 CrossRef.
- E. D. Sloan and C. A. Koh, Clathrate Hydrates of Natural Gases, CRC Press, 3rd edn, 2007 Search PubMed.
- J. A. Ripmeester and S. Alavi, Clathrate Hydrates, Molecular Science and Characterization, Wiley-VCH, 2022 Search PubMed.
- D. E. Palin and H. M. Powell, Nature, 1945, 156, 334–335 CrossRef CAS.
- D. E. Palin and H. M. Powell, J. Chem. Soc., 1947, 1947, 208–221 RSC.
- D. E. Palin and H. M. Powell, J. Chem. Soc., 1948, 1948, 815–821 RSC.
- J.-P. Torré, R. Coupan, M. Chabod, E. Pere, S. Labat, A. Khoukh, R. Brown, J.-M. Sotiropoulos and H. Gornitzka, Cryst. Growth Des., 2016, 16, 5330–5338 CrossRef.
- T. A. Strobel, Y. Kim, G. S. Andrews, J. R. Ferrell III, C. A. Koh, A. M. Herring and E. D. Sloan, J. Am. Chem. Soc., 2008, 130, 14975–14977 CrossRef CAS PubMed.
- V. F. Rozsa and T. A. Strobel, J. Phys. Chem. Lett., 2014, 5, 1880–1884 CrossRef CAS PubMed.
- J. L. Daschbach, T.-M. Chang, L. R. Corrales, L. X. Dang and P. McGrail, J. Phys. Chem. B, 2006, 110, 17291–17295 CrossRef CAS PubMed.
- K. W. Han, Y.-J. Lee, J. S. Jang, T.-I. Jeon, J. Park, T. Kawamura, Y. Yamamoto, T. Sugahara, T. Vogt, J.-W. Lee, Y. Lee and J.-H. Yoon, Chem. Phys. Lett., 2012, 546, 120–124 CrossRef CAS.
- Y. Woo, B.-S. Kim, J.-W. Lee, J. Park, M. Cha, S. Takeya, J. Im, Y. Lee, T.-I. Jeon, H. Bae, H. Lee, S. S. Han, B. C. Yeo, D. Kim and J.-H. Yoon, Chem. Mater., 2018, 30, 3028–3039 CrossRef CAS.
- A. Pennetier, École doctorale des sciences exactes et de leurs applications, PhD thesis, UPPA, 2023.
- N. I. Papadimitriou, I. N. Tsimpanogiannis, A. T. Papaioannou and A. K. Stubos, J. Phys. Chem. C, 2008, 112, 10294–10302 CrossRef CAS.
- N. Metropolis, A. W. Rosenbluth, M. N. Rosenbluth, A. H. Teller and E. Teller, J. Chem. Phys., 1953, 21, 1087–1092 CrossRef CAS.
- T. Méndez-Morales, H. Montes-Campos, M. Pérez-Rodríguez and M. M. Piñeiro, J. Mol. Liq., 2022, 360, 119487 CrossRef.
- A. Comesaña, M. Pérez-Rodríguez, A. M. Fernández-Fernández and M. M. Piñeiro, J. Chem. Phys., 2018, 148, 244502 CrossRef PubMed.
- W. L. Jorgensen, D. S. Maxwell and J. Tirado-Rives, J. Am. Chem. Soc., 1996, 118, 11225–11236 CrossRef CAS.
- R. F. Cracknell, Phys. Chem. Chem. Phys., 2001, 3, 2091–2097 RSC.
- A. P. Thompson, H. M. Aktulga, R. Berger, D. S. Bolintineanu, W. M. Brown, P. S. Crozier, P. J. in’t Veld, A. Kohlmeyer, S. G. Moore, T. D. Nguyen, R. Shan, M. J. Stevens, J. Tranchida, C. Trott and S. J. Plimpton, Comp. Phys. Comm., 2022, 271, 108171 CrossRef CAS.
- J. P. Ryckaert, G. Ciccotti and H. Berendsen, J. Comput. Phys., 1977, 23, 327–341 CrossRef CAS.
- N. Michaud-Agrawal, E. J. Denning, T. B. Woolf and O. Beckstein, J. Comput. Chem., 2011, 32, 2319–2327 CrossRef CAS PubMed.
- G. Soave, Chem. Eng. Sci., 1972, 27, 1197–1203 CrossRef CAS.
- C. Traxinger, J. Zips and M. Pfitzner, Thermodynamic analysis and large-eddy simulations of LOx-CH4 and LOx-H2 flames at high pressure, Joint Propulsion Conference, 2018 DOI:10.2514/6.2018-4765.
- H. R. Shaw and D. R. Wones, Am. J. Sci., 1964, 262, 918–929 CrossRef CAS.
- P. J. Linstrom and W. G. Mallard, J. Chem. Eng. Data, 2001, 46, 1059–1063 CrossRef CAS.
- A. Vidal-Vidal, M. Pérez-Rodríguez, J.-P. Torré and M. M. Piñeiro, Phys. Chem. Chem. Phys., 2015, 17, 6963–6975 RSC.
- A. Vidal-Vidal, M. Pérez-Rodríguez and M. M. Piñeiro, RSC Adv., 2016, 6, 1966–1972 RSC.
- M. Pérez-Rodríguez, J. Otero-Fernández, A. Comesaña, A. M. Fernández-Fernández and M. M. Piñeiro, ACS Omega, 2018, 3, 18771–18782 CrossRef PubMed.
- M. J. Frisch, G. W. Trucks, H. B. Schlegel, G. E. Scuseria, M. A. Robb, J. R. Cheeseman, G. Scalmani, V. Barone, G. A. Petersson, H. Nakatsuji, X. Li, M. Caricato, A. V. Marenich, J. Bloino, B. G. Janesko, R. Gomperts, B. Mennucci, H. P. Hratchian, J. V. Ortiz, A. F. Izmaylov, J. L. Sonnenberg, D. Williams-Young, F. Ding, F. Lipparini, F. Egidi, J. Goings, B. Peng, A. Petrone, T. Henderson, D. Ranasinghe, V. G. Zakrzewski, J. Gao, N. Rega, G. Zheng, W. Liang, M. Hada, M. Ehara, K. Toyota, R. Fukuda, J. Hasegawa, M. Ishida, T. Nakajima, Y. Honda, O. Kitao, H. Nakai, T. Vreven, K. Throssell, J. A. Montgomery, Jr., J. E. Peralta, F. Ogliaro, M. J. Bearpark, J. J. Heyd, E. N. Brothers, K. N. Kudin, V. N. Staroverov, T. A. Keith, R. Kobayashi, J. Normand, K. Raghavachari, A. P. Rendell, J. C. Burant, S. S. Iyengar, J. Tomasi, M. Cossi, J. M. Millam, M. Klene, C. Adamo, R. Cammi, J. W. Ochterski, R. L. Martin, K. Morokuma, O. Farkas, J. B. Foresman and D. J. Fox, Gaussian˜16 Revision C.01, Gaussian Inc., Wallingford CT, 2016 Search PubMed.
- J. P. Perdew, K. Burke and M. Ernzerhof, Phys. Rev. Lett., 1996, 77, 3865–3868 CrossRef CAS PubMed.
- B. Santra, A. Michaelides and M. Scheffler, J. Chem. Phys., 2007, 127, 184104 CrossRef PubMed.
- J. H. van der Waals and J. C. Platteeuw, Clathrate Solutions, John Wiley & Sons, Ltd, 1958 Search PubMed.
- M. M. Conde, J. P. Torré and C. Miqueu, Phys. Chem. Chem. Phys., 2016, 18, 10018–10027 RSC.
- J.-H. Yoon, Y.-J. Lee, J. Park, T. Kawamura, Y. Yamamoto, T. Komai, S. Takeya, S. S. Han, J.-W. Lee and Y. Lee, Chem. Phys. Chem., 2009, 10, 352–355 CrossRef CAS PubMed.
- J. E. Lennard-Jones and A. F. Devonshire, Proc. R. Soc. London, Ser. A, 1939, 170, 464–484 CAS.
- A. Chitsazan, M. Monajjemi, H. Aghaei and M. Sayadian, Orient. J. Chem., 2017, 33, 1366–1374 CrossRef CAS.
- J. B. Klauda and S. Sandler, Chem. Eng. Sci., 2003, 58, 27–41 CrossRef CAS.
- A. Martín, J. Phys. Chem. B, 2010, 114, 9602–9607 CrossRef PubMed.
- T. T. Trinh, M. H. Waage, T. S. van Erp and S. Kjelstrup, Phys. Chem. Chem. Phys., 2015, 17, 13808–13812 RSC.
- B. Rodríguez-García, M. M. Piñeiro and M. Pérez-Rodríguez, J. Chem. Phys., 2023, 158, 044503 CrossRef PubMed.
Footnote |
| † Present address: Instituto de Química Física Blas Cabrera, CSIC, E-28006, Madrid, Spain. |
| This journal is © the Owner Societies 2024 |

