Size and shape effects on chemical ordering in Ni–Pt nanoalloys
Pamela
Camilos
 *a,
Céline
Varvenne
 ab and
Christine
Mottet
 a
a
aAix-Marseille University/CNRS, CINaM UMR 7325, Campus de Luminy, Marseille 13288, France. E-mail: christine.mottet@univ-amu.fr
bCNRS, INSA Lyon, Universite Claude Bernard Lyon 1, MATEIS, UMR5510, 69621 Villeurbanne, France
First published on 7th May 2024
Abstract
The atomic structure and chemical ordering of Ni–Pt nanoalloys of different sizes and shapes are studied by numerical simulations using Monte Carlo methods and a realistic interatomic potential. The bulk Ni–Pt ordering tendency remains in fcc nanoparticles but we show some chemical ordering frustrations linked to surface reconstructions depending on the cluster size and shape. A reversed temperature dependence of Pt surface segregation is also established. In the particular case of fivefold symmetry as in icosahedra, ordering is observed in the core and on the facets at low temperatures with segregation of the smaller element (Ni) in the core because of atomic strain. We show that the icosahedral shape favors Pt surface segregation in comparison with octahedral and truncated octahedral structures.
1 Introduction
Pt-based nanoparticles (NPs) are very promising as electrocatalysts for fuel cells1 notably the ones used in automotive applications2 because the addition of a second metal reduces commercialization costs and at the same time improves selectivity and durability.3,4 The catalytic activity depends on the atomic structure and the chemical arrangement of the two metals on the surface, and is also influenced by the shape and morphology of the catalysts. Depending on the nanostructures (solid, hollow, “sea sponge” or core–shell NiPt systems) the electrocatalytic activities for the oxygen reduction reaction (ORR) have been characterized showing up to 10-fold enhancement in comparison to pure Pt catalysts attributed to microstrain.5 Another study of Pt3Ni nanoframes with 3D electrocatalytic surfaces6,7 showed an amazing enhancement of the ORR activity (factor of 36), after having demonstrated that the Pt3Ni(111) surface itself is 10-fold more active than the corresponding Pt(111) one.8 Finally, Pt3Ni icosahedral nanoparticles have been synthesised in liquid solution with an extraordinary ORR specific activity,9 50% higher than that of the equivalent Pt3Ni octahedral catalysts, both displaying essentially {111} facets. The authors explained the difference with the elastic strain which is more pronounced in the icosahedral nanoparticles than in the octahedral ones. Surface strain is crucial in the ORR catalytic activity, as observed in core–shell nanoparticles10 and theoretically demonstrated,11 as well as platinum surface segregation, as revealed on octahedral and cubo-octahedral nanoparticles by Monte Carlo simulations.12On the other hand, theoretical works using density functional theory (DFT) calculations on infinite Pt–Ni(111) alloy surfaces have studied the selectivity towards water production as compared to hydrogen peroxide; the last one being responsible for degradation of the membrane or the electrode in the fuel cell.13 This study showed the impact of the nature and structure of the Pt3Ni(111) surface. A DFT study of MgO-supported PtNi nanoparticles of 1.5 nm also showed a quantitative improvement of the ORR activity by alloying.14
However, no specific study of the chemical configuration of octahedral, truncated octahedral or icosahedral nanoparticles has been carried out so far, while the growth process to elaborate the alloy nanoparticles could have been decisive for the obtained chemical configurations, either core/shell or inter-mixed. The chemical configuration could impact any catalytic activity, knowing also that nanoparticles in experiments usually have out-of-equilibrium configurations.
This interplay between the chemical configuration, equilibrium state and catalysis has been observed experimentally in another context, on monodispersed NixPt(1−x) nanoalloy particles obtained by colloidal synthesis,15 where the solid solution structure (intermixing between the two elements) is observed by cross-linking imaging and chemical analysis using transmission electron microscopy and X-ray diffraction techniques. Such alloyed nanoparticles, over the whole range of chemical compositions, present interesting modulations in the catalytic synthesis of single-wall carbon nanotubes (SWCNTs). However, the limited temperature in the elaboration process does not ensure that a complete equilibrium configuration has been achieved, as we would have expected if nanoalloys were heated at sufficiently high temperature to allow for atomic diffusion and possible chemical ordering. This has been achieved in a recent study performed on FePt, CoPt and NiPt nanoalloys used as electrocatalysts employing in situ high temperature X-ray diffraction and atomic scale dark field scanning transmission electron microscopy characterization on annealed nanoparticles.16
In the present work, we will study the chemical arrangement of the different species in Ni–Pt nanoalloys at thermodynamic equilibrium using equilibrium Monte Carlo simulations, and sufficiently realistic interatomic potentials that we fitted mostly on ab initio density functional theory data. This system is in principle comparable to Co–Pt nanoalloys that have been extensively studied,17 either by X-ray diffraction,18,19 transmission electron microscopy20,21 or theoretically,22 in particular to characterize the ordered L10 structure also appearing in the bulk phase diagram and having pronounced magnetic anisotropy.23,24 Special attention is paid here to the NiPt3 composition, as its good ORR specific activity has been identified by a set of experimental works.6–9
After the first section devoted to the description of the development of the theoretical model (interatomic potential) and simulation methods (Monte Carlo algorithm and chosen statistical ensembles), the results of optimized chemical configurations at finite temperature on various relevant Ni–Pt nanoparticle shapes (truncated octahedra (TOh), octahedra (Oh) and icosahedra (Ih)) will be presented and discussed, showing a variety of possible core and surface ordered states. In addition, an inversed temperature dependence of Pt surface segregation is identified, which is driven by ordering effects and shows an interesting shape dependency. We finally conclude and give worthwhile prospects of our work on the catalytic and mechanical properties of Ni–Pt nanoalloys.
2 Theoretical model and simulation details
The computation of the equilibrium properties of nanoalloys requires a sampling technique coupled with an efficient classical interaction model, since the energy of a very large number of atomic configurations must be evaluated.25 In this section, we first describe the chosen interatomic potential and the procedure used to identify its parameters for finite size Ni–Pt systems. Then we detail the chosen off-lattice Monte Carlo techniques to sample the atomic configurations, and finally we show the validation of the potential on several bulk and nanoparticle alloy properties.2.1 Development of the energetic model
The selected interatomic potential is a many-body potential based on a tight-binding framework within the second moment approximation (TB-SMA) of the density of states of the d-band, well suited for transition and noble metals.26 It is composed of a site-energy attractive band term with a non-additive square-root dependence of the neighboring environment: | (1) |
 | (2) |
| α–β | p αβ | q αβ | A αβ | ξ αβ | r 3 αβ | r 4 αβ |
|---|---|---|---|---|---|---|
| Ni–Ni | 10.3447 | 2.1000 | 0.1122 | 1.6389 | 4.3111 | 4.9780 |
| Pt–Pt | 10.7960 | 3.1976 | 0.1993 | 2.2318 | 4.8745 | 5.6286 |
| Ni–Pt | 10.5703 | 2.6488 | 0.2260 | 2.3300 | 4.8745 | 4.9780 |
DFT calculations have been performed with the Vasp package,27–29 using the generalized gradient approximation (GGA)30 with the Perdew–Burke–Ernzerhof exchange–correlation functional31 and projector augmented-wave (PAW) pseudopotentials.32,33 The plane-wave basis set has an energy cutoff of 600 eV. Unrestricted spin-polarized calculations have been considered systematically due to the magnetic nature of the Ni–Pt system, considering s and d electrons for each metal. The Brillouin zone is integrated within the Monkhorst–Pack method,34 using a regular k-mesh of 18 × 18 × 18 in the conventional fcc cell (and an equivalent density for supercells).
The lattice parameters, cohesive energies, elastic constants and surface energies of the pure fcc metals, together with mixing enthalpies of perfectly ordered and solution energies of dilute alloys, have been calculated using DFT and compared to experimental values (see Tables 2 and 3). In Table 2, we can see for Pt that the lattice parameter is overestimated whereas the cohesive energy is underestimated by the DFT calculations which is a usual result when using the GGA functional. What is less usual is that the lattice parameter of Ni is the same as the experimental one and the cohesive energy is strongly overestimated. Our spin-polarized calculations for Ni account for magnetism, but they are not accurate enough to properly treat the correlations in Ni. Experimental bulk moduli are well reproduced by our DFT calculations for both Ni and Pt and shear moduli for Ni. Anisotropic surface energies of pure Ni and pure Pt follow the order γ(111) < γ(100), as usually observed for fcc metals and compare reasonably to the experimental estimates,37 though they are overestimated for Ni and underestimated for Pt. Concerning alloy properties, given in Table 3, the DFT solution energies of Ni (resp. Pt) in the Pt (resp. Ni) matrix and mixing enthalpies of the stoichiometric Ni3 Pt, NiPt and NiPt3 ordered alloys (see structural details on top of Fig. 6) are in good agreement with experimental values.38
| Ni | Pt | |||||
|---|---|---|---|---|---|---|
| Exp. | DFT | SMA | Exp. | DFT | SMA | |
| a | 3.52 | 3.52 | 3.52 | 3.92 | 3.98 | 3.98 |
| E coh | −4.44 | −5.05 | −4.81 | −5.84 | −5.53 | −5.53 |
| B | 188 | 189 | 233 | 288 | 245 | 204 |
| C 44 | 132 | 135 | 120 | 77 | — | 105 |
| C′ | 55 | 64 | 40 | 52 | — | 37 |
| γ (100) | 2400 | 2800 | 1964 | 2500 | 1850 | 1344 |
| γ (111) | — | 2590 | 1838 | — | 1480 | 1190 |
| Ni (Pt) | Ni3Pt (L12) | NiPt (L10) | NiPt3 (L12) | Pt (Ni) | ||
|---|---|---|---|---|---|---|
| ΔHm (meV per atom) | ||||||
| Exp. | −280 | −70 | −96 | −64 | −330 | |
| DFT | −142 | −58 | −96 | −63 | −133 | |
| SMA | −1004 | −207 | −325 | −235 | −1144 | |
| a (Å) | ||||||
| Exp. | 3.52 | 3.646 | 3.815 | 3.837 | 3.92 | |
| SMA | 3.52 | 3.72 | 3.90 | 3.925 | 3.98 | |
| c (Å) | ||||||
| Exp. | 3.589 | |||||
| SMA | 3.75 | |||||
| c /a | ||||||
| Exp. | 0.94 | |||||
| SMA | 0.96 | |||||
| T c (K) | ||||||
| Exp. | 815 | 930 | 790 | |||
| SMA | 650 | 720 | 650 | |||
The fitting strategy we adopted is the following. The pαα, qαα, Aαα and ξαα parameters for the pure elements have been fitted to the DFT values of the fcc lattice parameter, cohesive energies and bulk modulus, checking afterwards that the values of surface energy and other elastic constants are well reproduced (see Table 2). Taking into account the fact that the DFT Ni cohesive energy is largely overestimated whereas the Pt one is underestimated, we decided to target an intermediate value for the Ni cohesive energy. As a result, the Pt surface energy is slightly lower than the Ni one within the SMA potential, which ensures the surface segregation of Pt, as expected from the experimental observation on semi-infinite crystals.44,45 Also note in Table 2 that the gap between the Ni and Pt SMA surface energies is reduced compared to the DFT one, and this corresponds better to the experimental surface energies of both elements which are nearly equal. The computed bulk modulus and shear elastic constants are rather well reproduced for Ni, and less accurate for Pt, but are still acceptable.
The Aαβ and ξαβ hetero-atomic parameters for the mixed interactions were initially fitted on T = 0 K solution and mixing enthalpies, but the constraints on these quantities have been partially released in order to better fit the experimental order/disorder critical temperatures using Monte Carlo simulations (see the next section for simulation details). Indeed, as the model is meant to simulate finite temperature phenomena, we noticed that a good fitting of the mixing enthalpies at T = 0 K does not allow us to reproduce the ordering/disordering transitions as in the experiments. The mixing enthalpies of our final TB-SMA model for Ni–Pt alloys are then much higher than the ones calculated by DFT, or even the ones given by the experimental thermodynamic data.38 However, and this is much more important for our purpose, the critical order/disorder temperatures obtained by Monte Carlo simulations using our SMA potential for the Ni–Pt bulk ordered alloys (Ni3Pt, NiPt and NiPt3) are in quite good agreement with the experimental ones.41 Finally, the lattice parameters of the different compounds are close to experimental values.
In conclusion, the new SMA potential with parameters in Table 1 shows reasonable interpolation capabilities for the specifications we set, i.e. good bulk and surface properties for pure elements and correct critical order–disorder transition temperatures for the stoichiometric Ni–Pt alloys.
2.2 Monte Carlo simulations
To compute the equilibrium properties of Ni–Pt systems, Monte Carlo (MC) simulations based on the Metropolis algorithm46 are carried out in the isothermal–isobaric (NiPT) and semi-grand isothermal–isobaric (NΔμiPT) ensembles. In the NiPT simulations, the number of atoms of each element is conserved, together with the temperature and the pressure which means that the volume is allowed to change in order to maintain a constant pressure47 (equal to zero here). We apply three types of MC moves: random atomic displacements, random exchange between atoms of different species and volume changes. Each MC trial that modifies the energy of the system is accepted with a probability equal to: | (3) |
 | (4) |
In the NΔμiPT simulations, the total number of atoms is conserved, together with temperature and pressure, but the number of atoms of each species can change, keeping constant the difference of the chemical potentials of the two species, Δμ = μB − μA, which leads to the following probability:
 | (5) |
For a system with N atoms we typically run 3000 macrosteps, where the first 1000 macrosteps are used to equilibrate the system, and the last 2000 are used to calculate the ensemble averages. In each macrostep, we randomly propose atom displacements, atom exchanges/transmutations (exchanges in the isothermal–isobaric ensemble and transmutations in the semi-grand isothermal–isobaric ensemble), and variations of the total volume in the case of periodic conditions (i.e. bulk systems). The number of trials of each type is a parameter of the Monte Carlo simulation. Typically, we chose 10N displacements and 300 volume trials for N atomic exchanges/transmutations. The number of macrosteps depends therefore on the total number of atoms in the system, N. In bulk systems, N varies between 256 and 4000, and the number of macrosteps varies between 5 and 60 million. In clusters, N varies between 405 and 8217, and the number of macrosteps varies between 6 and 130 million. In all cases, at least 5500 steps per atom are used to equilibrate the system, and then at least 11![[thin space (1/6-em)]](https://www.rsc.org/images/entities/char_2009.gif) 000 steps per atom are used to calculate averages (see Appendix A for convergence details).
000 steps per atom are used to calculate averages (see Appendix A for convergence details).
In the NiPT simulations of order/disorder transitions, the composition and temperature are fixed, and we run successive simulations with an increasing or decreasing temperature ramp. We initialize the system to an L10 or an L12 ordered structure when heating and to a randomly distributed configuration when cooling. In NΔμiPT simulations, the total number of atoms and chemical potential differences are fixed, and we run successive simulations with a Δμ ramp, with an initial configuration of pure Ni when increasing Δμ and of pure Pt when decreasing it. Such Δμ ramps allow us to span the whole binary alloy concentration range during one isothermal simulation run. In both types of simulations, each Monte Carlo run starts from the configuration stabilized in the precedent run.
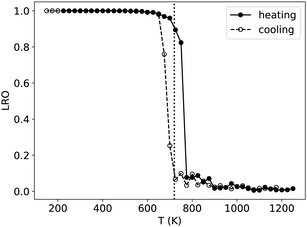
The detection of the L10 order/disorder transition in simulations is made through the computation of a long-range order (LRO) parameter. In order to take into account the possible coexistence of different L10 orientation variants, the LRO parameter of the L10 phase is calculated as the maximum value in the three directions:
 | (6) |
2.3 Bulk compound properties with the SMA potential
To further confirm the ability of our semi-empirical potential in reproducing some bulk alloy properties, we first evaluate in Fig. 2 (left panels) the convergence with respect to the simulation box size of the lattice parameters (at 300 K) and order/disorder critical temperatures for the three Ni3Pt, NiPt and NiPt3 compounds. The left side of Fig. 2 shows that convergence is reached for box sizes larger than 2000 atoms for both quantities.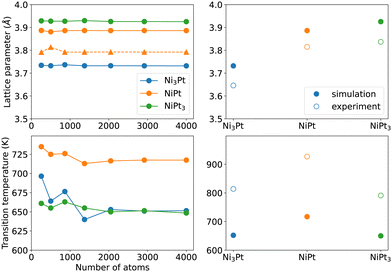 | ||
| Fig. 2 Bulk lattice parameters at 300 K (top left with circles for a and triangles for c lattice constants) and critical order/disorder transition temperatures (bottom left) of the Ni3Pt, NiPt and NiPt3 ordered alloys, as a function of the number of atoms in the simulation box. The right panels compare their converged values to the experimental ones.40–43 | ||
The right panels of Fig. 2 display the converged values of lattice constants a and Tc for the three compounds. It is seen that, even though our model underestimates the critical temperatures and overestimates the lattice parameters, it reproduces their trends with alloy composition with a very good qualitative agreement with experiments40–43 (also reported in Table 3). Values in Table 3 further indicate that the L10 tetragonality ratio c/a = 0.98 at 300 K is close to the experimental one. Lattice constants of ordered phases were not adjusted quantities, so the correct SMA trend with composition confirms that the SMA potential is rather robust for alloy simulations of the Ni–Pt system.
3 Results and discussion
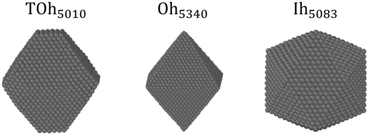
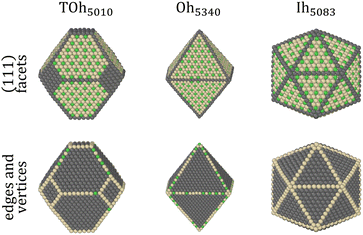
It has been shown in other similar binary systems like Co–Pt that the core of nanoparticles (NPs) tends to have the same ordering as the bulk alloys, and that the facets tend to have the same ordering as the infinite alloy surfaces.48 However, this is not always the case due to shape, size and surface effects that can lead to core frustrations. We thus perform NΔμiPT (covering the whole concentration range) and NiPT (in the temperature range between 250 K and 950 K) simulations of nanoparticles with truncated octahedral (TOh), octahedral (Oh) and icosahedral (Ih) shapes, and of sizes ranging between 2 and 6–7 nm, in order to study how temperature, composition, shape and size influence the detailed equilibrium morphology of Ni–Pt NPs. These choices of Ni–Pt particle size range and shape are relevant to those obtained experimentally by chemical synthesis,5,9 yet being tractable for off-lattice Monte Carlo simulations.Fig. 3 shows the 3D views of the three chosen NP shapes with the fcc structure: TOh with 5010 atoms (TOh5010), Oh with 5340 atoms (Oh5340), and Ih with 5083 atoms (Ih5083) having a five-fold symmetry and a near-fcc structure with 12 first neighbours. Oh and Ih shapes present only {111} facets whereas TOh, as indicated by its name, presents also {100} facets, which come from the truncation of the corners of an Oh polyhedron. In the following, we first focus on the TOh shape to investigate NP size effects, low-temperature chemical ordering vs. composition, and segregation behavior versus temperature for NiPt3. We examine shape effects in the last part of this section.
3.1 Decrease of the order/disorder transition temperature with NP size in NiPt TOh
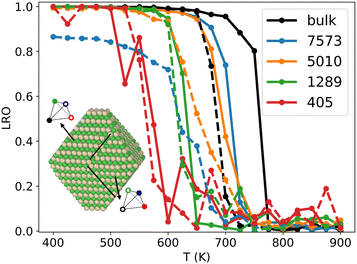
It has long been known that the melting temperature of metallic NPs decreases with NP size.49,50 With the same idea, several works have shown that the critical order/disorder transition temperature Tc decreases as the NP gets smaller.20 To investigate the influence of NP size on Tc in the Ni–Pt system, we use NiPT simulations with increasing and decreasing temperature ramps, performed on equiatomic NiPt TOh particles of sizes ranging from 405 to 7573 atoms. We calculate the LRO parameter (eqn (6)) in the core of the NPs – defined by removing the three outermost particle layers – and compare the resulting LRO vs. temperature curves to the bulk.We report the results in Fig. 4, which shows that, below a certain temperature and regardless of NP size, the core of the NP exhibits an L10 ordering, just like in the bulk (LRO = 1). There is an apparent exception for the biggest particle TOh7573, where the cooling curve reaches a low-temperature plateau LRO ≃ 0.85. The inset in Fig. 4 shows the atomic configuration of the TOh7573 core at 400 K. Two L10 translation variants are clearly identified, so an L10 order is actually seen in this particle, but is not fully captured by our definition of LRO in eqn (6). It should also be noted that there is a hysteresis between the heating and cooling curves (well-known metastability effect). The width of this hysteresis decreases between bulk and large nanoparticles and also with nanoparticle size, reaching almost zero in TOh1289 NP. As an aside, we observe rather noisy LRO curves for the smallest nanoparticle, TOh405, which can be ascribed to the very small number of atoms in the NP core (only 19) after removing the 3 outermost layers. This perhaps shows the limitations of our fixed definition of the core zone regardless of the NP size, but in any case highlights the need for larger sampling for a low core atom number (6000 macrosteps were performed to obtain the TOh405 curves, i.e. twice our default value, and it is clearly not enough).
More importantly, our results show that the smaller the particle, the greater the decrease in Tc with respect to the bulk value, with a small decrease of the order of 50 K for the biggest particle (TOh7573) and a notable decrease of the order of 150 K for the smallest particle (TOh405). This is consistent with experiments reporting Tc in 5 nm NiPt nanoalloys that is around 30 K lower than the experimentally reported bulk value.16 This good agreement further supports the use of our SMA potential for equilibrium properties of nano-alloys. The important size effect we have evidenced must be taken into account if one wishes to order NPs via experimental annealing, which must be carried out at a temperature high enough for the atomic diffusion to lead to ordering and low enough to stay below the size-dependent Tc.
3.2 Low-temperature chemical ordering in TOh NPs
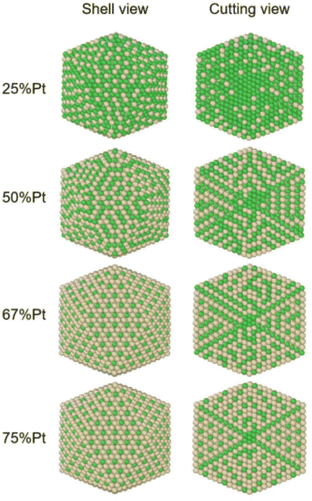
In order to identify ordered equilibrium structures in Ni–Pt NPs, we study both core and surface ordering in TOh Ni–Pt over the whole composition range at low temperature. We run NΔμiPT simulations at 300 K, which is a temperature below Tc for all our studied NPs, and we analyze the Pt occupation in the core and facets as a function of composition. We do this for two different NP sizes, one relatively small (1289 atoms) and one relatively big (5010 atoms), so as to analyze any relevant size effects. Fig. 5 shows the equilibrium structures of TOh1289 at different compositions, by distinguishing the global 3D shape, then the core and the different facets.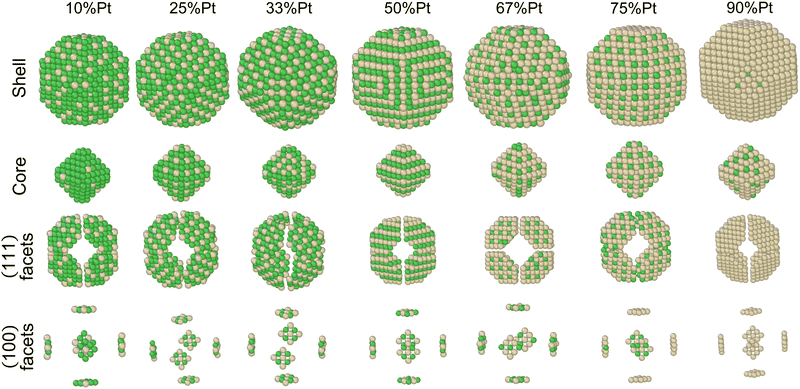 | ||
Fig. 5 Snapshots of TOh1289 after thermal equilibration at different compositions showing, from top to bottom, the chemical ordering on the NPs whole surface, core, {111} and {100} facets. Green atoms represent Ni and beige atoms represent Pt. The ordering observed in Ni3Pt, NiPt, and NiPt3 is, respectively, in the core: L12, L10, L12; on {111} facets:  for 25 to 33%, p(2 × 1) at 50% and p(2 × 2) for 67 to 75% of Pt; on {100} facets: Pt-rich c(2 × 2) up to 67% of Pt, then 2 Pt-rich c(2 × 2) and 4 Pt-pure for 75% of Pt. See Fig. 8 for the structure of the various surface ordered phases, and main text for details. for 25 to 33%, p(2 × 1) at 50% and p(2 × 2) for 67 to 75% of Pt; on {100} facets: Pt-rich c(2 × 2) up to 67% of Pt, then 2 Pt-rich c(2 × 2) and 4 Pt-pure for 75% of Pt. See Fig. 8 for the structure of the various surface ordered phases, and main text for details. | ||
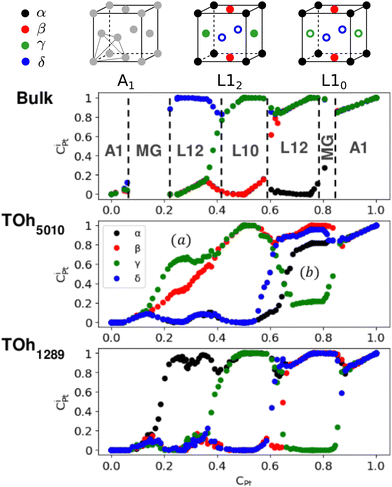
First, we focus on studying the core chemical ordering. We plot in Fig. 6 the Pt core occupations on the four different sublattices of the conventional fcc cell to compare the two TOh NP sizes with the Ni–Pt bulk. The bulk Pt occupation curves clearly indicate the existence of three well identified ordered phases: Ni3Pt and NiPt3 with L12 ordering (one over the four sublattices is occupied by one species, the other three by the other species) and NiPt with L10 ordering (two by two occupations) as depicted on top of Fig. 6, and of a Ni-rich and a Pt-rich A1 disordered phase (all the sublattices are equally occupied). Globally, sublattice occupations are almost the same in the bulk and in the core of the NPs, with few notable differences. Both NPs show the presence of the three ordered phases in the core – just like in the bulk – and as displayed in Fig. 5 in the core views for different Pt compositions of TOh1289 nanoparticles. Non-stoichiometric L12 phases are also visible in the cores, e.g. at 33% and 67% Pt content, as shown in Fig. 5, illustrating the existence of a wide range of compositions for which ordered phases are stable, as in the bulk (see Fig. 6). One of the main differences is the absence in the NPs of the two miscibility gaps present in the bulk, in the Pt concentration ranges of 10–20% Pt and 80–83% Pt. This is a consequence of the finite size of the NPs which prevents the coexistence of different phases in it. This absence of miscibility gap between A1 and L12 phases was already observed in Co–Pt NPs.48 Transitions between the different ordered phases are smoother in NPs and more abrupt into the bulk; this is a usual result for NPs.
We also notice in Fig. 6 that the sublattice occupancies are partial in the larger NP size TOh5010 – see labels (a) and (b) in Fig. 6 – which is not intuitive since one would expect that increasing the size leads to a behaviour closer to the bulk. What happens here is that when the NP size is large enough (here 5010 atoms, which is even larger than the 4000 atoms simulation box for the bulk), there can be a coexistence of different variants of the ordered phase. This is in particular true for the L12 phases, as shown in Fig. 7a and b where we represent slices of the cores of the TOh5010 NPs with Ni3Pt and NiPt3 compositions. For both Ni3Pt and NiPt3, three different translation variants of the L12 phases are identified within the NP cores, which are separated by anti-phase boundaries (APB). Note that two different translation variants of one orientation of the L10 NiPt phase were also present in the core of TOh7583 (Fig. 4), again separated by some APBs (of a different kind). APBs usually have an energy cost and should disappear for longer runs. This situation should not be confused with the coexistence of differently ordered phase orientation variants geometrically imposed by the very strong segregation of a chemical species on the surface, like in Pt–Ag nanoalloys.51 In our case, two phase nuclei have emerged rather independently in the NPs and are shifted by a translation or rotation that creates an APB when they come into contact. The antiphase boundary positions are not imposed by geometric constraints and can be eliminated in longer simulation runs. This type of plane defects could nevertheless exist experimentally in large NPs, since even after annealing the NPs are not always in their full equilibrium configuration. This means that large NPs can display a microstructure, in the same way as commonly observed in bulk metallic alloys.52
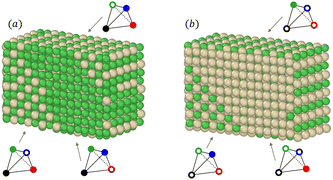 | ||
| Fig. 7 Snapshots of slices from the core of (a) Ni3Pt and (b) NiPt3 TOh5010 nanoparticles at 300 K. Same labels (a) and (b) are reported in Fig. 6 for clarity. The three arrows point towards three different L12 translation variants which coexist in the cores of the NPs for this rather large NP size. The associated chemical occupation is given in the tetrahedron schemes, following the same conventions as in Fig. 6. | ||
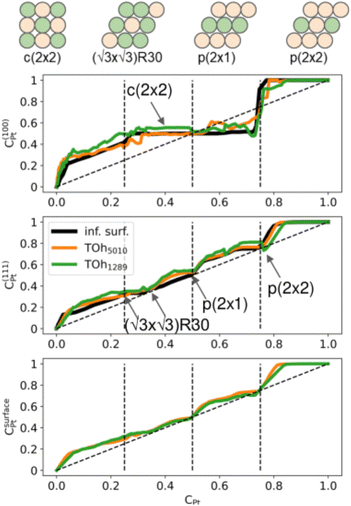
Second, we consider the surface composition and in particular the surface arrangement in the different facets of the NPs. In Fig. 8, we plot the Pt concentration per site on the {100} facets, on the {111} facets and on the total NP surface for the two NP sizes at 300 K, and we compare them to the site occupation on infinite (100) and (111) surface slabs, respectively. Both nanoparticles exhibit the same qualitative behaviour as the infinite theoretical surfaces, with the facets of the bigger NP size being closer to the infinite surfaces. In general, there is slightly more Pt on the facets than on the infinite surfaces, especially on the {111} facets. The {100} facets present a plateau corresponding to a c(2 × 2) ordered surface (see schemes in Fig. 8), which extends from approximately 25% Pt to 73% Pt. Above 75% Pt, there is a strong segregation on the {100} facets which quickly become Pt-pure. The {111} facets, on the other hand, present three different ordered structures around 33% Pt, 50% Pt and 75% Pt. Overall, when considering the total NP surface which includes edges and vertices, we found that there is Pt surface segregation and Ni sub-surface segregation (not shown) over the whole composition range except in NiPt and NiPt3, when the L10 and L12 core ordered phases are dominant.
We now analyze more specifically the interplay between surface and core chemical ordering in TOh NPs at different compositions, referring to Fig. 5, 6 and 8. At very low Pt concentrations (below 10% Pt), there is a strong Pt surface segregation on the facets, as in the infinite surfaces, and the core is almost fully occupied by Ni atoms. This leads to a core–shell like structure with pure Ni in the core and a Ni–Pt solid solution in the outer layers. At higher compositions, around 25% Pt, both the core and the facets start to exhibit ordering tendency. In Ni3Pt NPs, the core shows a L12 ordering tendency. The surface is enriched in Pt, and the {100} facets have c(2 × 2) ordering while the {111} facets present the  ordering. The c(2 × 2) ordering extends from approximately 25% Pt to 73% Pt and is either Ni-rich or Pt-rich depending on the composition (and only in TOh1289 due to the odd number of atoms on this facet). Note that the
  ordering on the {111} facets has been previously observed in CoPt nanoalloys22 at low Pt concentration. This surface ordering is stable and observed at higher concentrations like 33% Pt. The ordering on both types of facets is not compatible with an L12 phase in the core and creates frustration, mainly in the sub-surface, but also in the core.
Around 50% Pt, the core of the NP exhibits an L10 ordering, just like in the bulk. In both bulk and NPs, the transition between the Ni-rich L12 and the L10 phase happens by progressively filling with Pt one of the Ni occupied sublattices (between approximately 37 and 41% Pt). Similar to CoPt NPs,48 the NiPt NP ends with mixed c(2 × 2) {100} facets in all directions, instead of having four mixed and two Ni pure to fit perfectly the L10 phase across the whole NP (see column 4 in Fig. 5). This leads to small frustrations in the sub-surfaces.
Amongst the expected ordered phases, NiPt3 nanoparticles are the only ones which show perfect ordering (L12) that spreads along the whole NP (see Fig. 5). Two of the {100} facets have c(2 × 2) ordering while the remaining four are Pt pure and the {111} facets are p(2 × 2) ordered. The surface as a whole is therefore the natural prolongation of the L12 phase in the core. This is probably due to the fact that, on one hand, Pt has a tendency to segregate on the surface, and on the other hand, the core ordering in this case requires a Pt-rich surface, which favors Pt surface segregation. We do not see the same behaviour in the L12 Ni3Pt composition since in that case, Pt surface segregation leads rather to only c(2 × 2) mixed {100} ones (see Fig. 5 second row) and the {111} facets present the  ordering which is not compatible with the L12 ordered phase in the core. On the one hand, the
  structure contains slightly more Pt than the corresponding p(2 × 2), which satisfies Pt surface segregation, but on the other hand, it destabilizes the core, as can be seen in column 3 of Fig. 5 and also on Fig. 6 at 33% Pt. In the Pt-rich side, we notice that the core ordering domain around L12 NiPt3 extends over a slightly larger composition range than in the bulk (see columns 5 and 6 of Fig. 5). This is due to the Pt surface enrichment allowing the core to remain ordered in a larger composition domain, putting the excess of Pt on the surface. In this composition range, it is the p(2 × 2) {111} facets that are stabilized instead of the
  ones because the last one contains slightly less Pt than the corresponding Pt-rich p(2 × 2). This is in contrast with Co–Pt TOh NPs48 for the same Pt compositions, where the reappearance of the
  is observed: this is one important qualitative difference between these two binary systems that is due to the stronger Pt segregation tendency in Ni–Pt. Finally, at very high Pt concentrations (above 85% Pt), the surface is fully occupied by Pt atoms with a Pt-rich solid solution in the core (see the last column in Fig. 5).
3.3 Pt surface segregation enhancement with temperature in TOh NiPt3
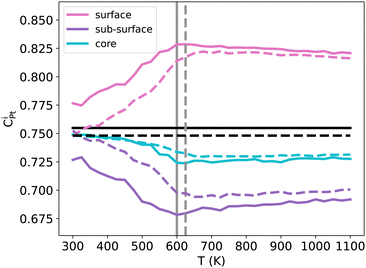
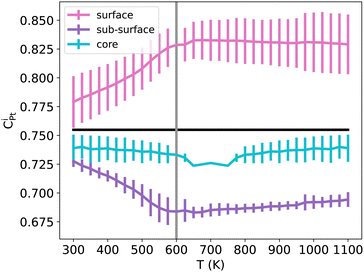
The important ORR activity measured in various NPs, surfaces and/or other nanoframes at the specific NiPt3 composition5–9 motivates a dedicated study of Pt segregation, as the quantity of available Pt at the surface could be an important parameter for this reaction. The usual expectation is a pronounced Pt surface segregation at equilibrium, which is stronger at lower temperatures and in the Pt-rich domain. However, our previous results have shown that this is not the case at 300 K in the case of NiPt3 NPs, where perfect L12 ordering is observed along the whole NP (see Fig. 5). We thus investigate the segregation behavior more closely by studying the temperature effect on the Pt surface, subsurface and core concentration of NiPt3 nanoparticles (see Fig. 9).We observe almost the same behaviors for both TOh1289 and TOh5010 over the whole temperature range, and trends are robust against MC sampling, see Appendix A. The differences between the two particles are mainly due to the parity of the number of atoms on the facets, allowing them to be either enriched in Pt with respect to the average composition (TOh1289), or not (TOh5010).
At low temperatures (around 300 K), both NPs show a perfect L12 which extends from the core to the surface. As discussed previously, there is no segregation at these temperatures: this is completely true for TOh5010 and almost correct for TOh1289, if we consider the precision on the concentration scale. When the temperature is increased while keeping T < Tc, the Pt concentration at the surface increases rapidly while it decreases in the subsurface at almost the same rate. The Pt surface segregation occurs at the expense of the subsurface which becomes depleted in Pt as compared to the average nanoalloy composition. The difference in composition between the surface and subsurface is more important in TOh1289 because the facets have an odd number of atoms, and the deviation in composition is more than 10% Pt for both sizes. In the core, the Pt concentration decreases but by less than 2% Pt. At temperatures higher than Tc, all compositions reach a plateau and the system forms a solid solution in the core with around 73% Pt, surrounded by solid solution shells which are either depleted (the subsurface) or enriched (the surface) in Pt. At very high temperatures, the Pt surface composition decreases at a very slow rate, tending to homogenize the system to form a single phase Pt-rich solid solution. However, the coexistence of the solid solution core with solid solution shells is still very stable at 1100 K and the system will likely melt before forming a single solid solution. Consequently, experimentally prepared NiPt3 NPs will be stable with this multi core–shell solid solution structure, even when annealed.
The Pt composition profile thus forms a sandwich with alternating shells of different Pt concentrations: a surface significantly enriched in Pt as compared to the average concentration, a subsurface highly depleted in Pt compared with the average concentration, a second subsurface enriched in Pt, and a core slightly depleted. This is in qualitative agreement with previous experimental and theoretical works done on {100} and {111} infinite surfaces of disordered NiPt3, and which show an oscillating Pt profile near the surface with a strong Pt surface segregation.44,53
To summarize, at low temperatures, the L12 core ordering dominates and prevents Pt surface segregation. At higher temperatures, as the core becomes disordered, Pt atoms segregate at the surface at the expense of the subsurface, while the core forms a solid solution slightly depleted in Pt. NP annealing is therefore a tool to control/enhance Pt surface segregation, the consequence of which on the NP catalytic activity would be worth investigating.
3.4 Shape effect on chemical ordering and segregation in Ih NiPt3
As highlighted in the experimental works cited in the introduction, the shape of a nanoalloy can have a great impact on its catalytic properties, possibly related to a change in chemical ordering with the particle geometry and/or internal stress effects. We thus compare in the following the equilibrium chemical ordering obtained in the other two NP shapes, Oh and Ih, with the one studied so far, TOh. TOh and Oh have almost the same geometry, with the {100} facets missing in the latter. We found that similar NP sizes of TOh and Oh present the same ordering on {111} facets and in the core, over the whole range of composition and temperature (the results for Oh are thus not repeated here). Ih NPs however are structurally quite different, and this leads to more complex ordering, both in the core and on the surface, which we now detail.
Fig. 10 shows the chemical ordering on an Ih5083 surface and in its core for different compositions at 300 K. The main difference with the TOh of the equivalent size (TOh5010) is that, in Ni3Pt and NiPt, there is a tendency for local ordering in each Ih tetrahedron along L12 and L10, accompanied by a local disorder in the core center of the Ih NP, where sites are occupied by Ni atoms. Ni atoms are smaller than Pt atoms and the core of Ih is known to be compressed54 leading to the segregation of the smaller atoms in the core center to release the stress in the center of the NP as in Pd–Au Ih.55 The observed ordering is highly frustrated at 50% Pt – multiple portions of alternating pure Pt and pure Ni planes are visible – and frustrations lead to relatively disordered surfaces, in contrast to TOh NiPt. On the other hand, NiPt3 nanoalloys show clear ordering in each of the tetrahedra, with Ni junctions in the core. This ordering spreads to the {111} facets ordered along p(2 × 2) to form an NP with rotational variants of perfectly ordered L12 tetrahedra. Just like the TOh case, {111} facets have a  ordering in the Ni-rich region, and a p(2 × 2) ordering in the Pt-rich region compatible with the core L12 ordering. Again, this asymmetry in behavior is due to Pt surface segregation which favors the formation of concentrated Pt facets.
The shape of NPs could also have an impact on Pt surface segregation, as the chemical ordering changes from one type of facet to the other and depends on how different facets are intertwined. TOh, Oh and Ih all present {111} facets but have different overall surfaces. In order to investigate how this affects surface segregation for the specific NiPt3 composition of interest, we extend the previous study of temperature effect on surface segregation to the different NP shapes. Fig. 11 displays the TOh5010, Oh5340 and Ih5083 equilibrium configurations for the NiPt3 composition at 300 K, and Fig. 12 shows the NP whole surface, {111} facets, subsurface and core Pt equilibrium compositions vs. temperature curves.
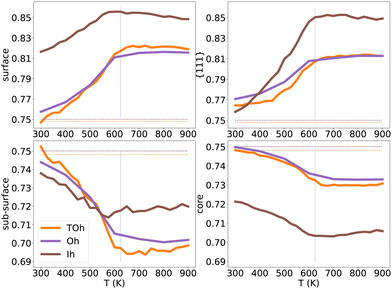 | ||
| Fig. 12 NiPt3 surface, {111} facets, subsurface and core Pt concentration per site as a function of temperature for the three NP shapes TOh5010 (orange), Oh5340 (purple) and Ih5083 (brown), shown in Fig. 11. Horizontal lines represent the average Pt concentration. Vertical lines represent the critical transition temperature, which here is the same regardless of shapes. | ||
Over the whole range of temperatures (Fig. 12), Oh and TOh behave almost identically, i.e. the surface, subsurface and core Pt concentration vs. T curves are very close. This is not surprising since they have almost the same core and surface structures, except for the missing {100} facets in Oh. Ih NPs, however, behave differently both qualitatively and quantitatively.
At low temperatures, the Pt composition on {111} facets of Ih5083 is almost equal to the average Pt composition, and regardless of the shape, we observe a p(2 × 2) ordering on the {111} facets. Despite this, the total surface of the Ih shows higher Pt surface enrichment due to Pt atoms occupying all the sites at the edges and corners of the Ih (see Fig. 11). The core of the Ih shows L12 ordering in each twinned tetrahedral core, forming several rotational variants with Ni atoms in the center core of the Ih. The geometry of the Ih leads to extra stress at its center, which forces smaller atoms to occupy the Ih core center to relax these constraints.55 This favors Ni segregation in the center despite the local ordering in each tetrahedron and leads to a more important Ni segregation in the core than the one observed in TOh and Oh. Interestingly, this structural constraint due to the five-fold symmetry results concomitantly in a strong Pt (large atoms) surface segregation. As in TOh and Oh shapes, this Pt segregation is increased when increasing T and reaches a ≈ plateau above Tc, but is stronger in Ih than the one observed in TOh and Oh NiPt3 and for the whole temperature range. This Pt surface concentration enhancement in Ih as compared to TOh and Oh, even if by a few percentages only, could have a positive effect on the catalytic properties of the Ih NPs, and could be related to the higher ORR measured in Ih NPs with respect to Oh NPs,9 even though both these structures only have {111} facets.
4 Conclusions and perspectives
In this paper, we studied chemical ordering in the core and surfaces of TOh, Oh and Ih Ni–Pt nanoparticles, over the whole range of composition and for temperatures between 300 K and 1100 K. Special attention has been devoted to the NiPt3 composition, due to its interest in the catalysis of the ORR. We found that the order/disorder transition temperature decreases with NP size, as predicted and consistent with the experiments. In general, the core of Oh and TOh nanoparticles behaves like the bulk while their facets behave like infinite surfaces. The ordering on the facets tends to privilege Pt segregation and hence Pt-rich ordered surface phases, which creates chemical frustrations in some cases, especially in NPs with low Pt compositions. At low temperatures, the Ni-rich L12 phase and the L10 phase are observed in the core around 25% Pt and 50% Pt with some defects caused by the non-compatibility of the core ordering with the Pt-rich surfaces. The Pt-rich L12 phase is observed in the core around 75% Pt with no defects and with perfect compatibility with the surface ordering. Ih NPs are less ordered due to their complex geometry but still show ordering in each tetrahedron, especially at high Pt compositions. In NiPt3, each tetrahedron is perfectly ordered in the core along the L12 phase which spreads to the surface in the form of the p(2 × 1) ordered phase. For all NP sizes and shapes, we observed that Pt surface segregation is enhanced with temperature, which was not intuitive. Ordering in the core is dominant at low temperatures and Pt surface segregation only leads to some core defects. We also found that the Ih shape promotes Pt surface segregation and Ni core segregation, probably in order to release strain in the core. At low temperatures, the enhancement is due to Pt occupying all sites of edges and vertices while at high temperatures Pt is distributed homogeneously on the surface.To conclude we have shown in this work how the Ni–Pt nanoparticles can be chemically ordered at the surface and in the core in very different ways, which allows us to suggest additional possible influencing factors for catalytic properties. The high ORR activity measured on NiPt3 icosahedra as compared to Oh in the study by Wu et al.9 was attributed to the particular strain on the pseudo {111} facets of the icosahedral nanoparticles. Regarding the results obtained here with Monte Carlo simulations at equilibrium – which is of course not guaranteed in the cited experiments – we can add that not only the strain but also the specific chemical ordering (p(2 × 2) superstructure on the {111} facets) together with the Pt-pure edges and vertices at low temperature and the amount of Pt segregated on the surface by appropriate thermal treatment could influence the catalytic properties of these objects. Consequently, a more specific work dedicated to understanding the effects of NP shape, surface ordering and Pt surface segregation vs. T on ORR specific activity at fixed NiPt3 composition would be of interest.
The detailed information we provided here on the equilibrium chemical configurations of Ni–Pt nanoparticles as a function of temperature, composition, and nanoparticle size and shape will also be beneficial for the community working on mechanical properties of nano-objects. Indeed, pure metallic nanoparticles have ultra-high strength approaching the theoretical limit, leading to the so-called expression: ‘smaller-is-stronger’.56 The addition of substitutional elements in solid solution, instead of increasing the strength as in bulk metallic materials, can induce a softening of the nanoparticle, attributed to the assistance of dislocation nucleation by compositional heterogeneities. This impact of alloying has for instance been characterized both experimentally and theoretically on Co–Ni nanoparticles, exhibiting a softer yield strength57, and in multicomponent nanoparticles58 synthesised in a random state.59 The variety of core and surface chemical order/disorder that we have identified here versus T and Ni–Pt alloy composition goes beyond the ‘simple picture’ of fully random alloy NPs. The way these NP morphologies affect the NP yield strength and temperature dependence is a topic for future work.
Author contributions
All authors contributed equally.Conflicts of interest
There are no conflicts to declare.Appendix
Appendix A Convergence of Monte Carlo simulations
To verify the convergence of our simulations with the number of macrosteps used to equilibrate the system and the number of macrosteps used to calculate ensemble averages, we focused on the case of a TOh1289 NiPt3 NP. For temperatures ranging from 300 K to 1100 K, the average NP energy was converged by 1 meV per atom (a bit higher at Tc) when using our standard value of 1000 macrosteps to equilibrate the system, as compared to a reference calculation using 1800 macrosteps. As for the number of macrosteps to calculate ensemble averages, the precision on the average NP energy when using our standard 2000 macrosteps value is within 2 meV per atom of a reference calculation with 4000 macrosteps.Regarding now the effect of the MC sampling on the segregation behavior, we found that running several independent runs leads to the same qualitative trends in each of the runs, the averaging simply smooths the results. In Fig. 13 we report the results of the average Pt concentration curves for TOh1289 NiPt3 in the surface, subsurface and core, after repeating 20 independent standard runs (each with heating plus cooling sequence). In addition, comparing the present average concentration curves to the ones for a single run (as shown in Fig. 9) indicates that the CPt values are very close for the whole temperature range. The quality of our sampling of the configuration space is thus satisfying for the characterization of Pt segregation in the various NPs.
Acknowledgements
The authors thank Hakim Amara for fruitful discussions and acknowledge support from the French national agency through YOSEMITE ANR-22-CE08-0033-01 grant, together with the International Research Network-IRN “Nanoalloys” of the CNRS. This work was granted access to the HPC resources of IDRIS under the allocation 2017-096829 by GENCI.Notes and references
- X. Ren, Q. Li, L. Liu, Y. Wang, A. Liu and G. Wu, Sustainable Energy Fuels, 2020, 4, 15 RSC.
- M. Debe, Nature, 2012, 486, 43–51 CrossRef CAS PubMed.
- R. Lin, X. Cai, H. Zeng and Z. Yu, Adv. Mater., 2018, 30, 1705332 CrossRef PubMed.
- O. Sorsa, H. Romar, U. Lassi and T. Kallio, Electrochim. Acta, 2017, 230, 9 CrossRef.
- R. Chattot, T. Asset, P. Bordet, J. Drnec, L. Dubau and F. Maillard, ACS Catal., 2017, 7, 398–408 CrossRef CAS.
- C. Chen, Y. Kang, Z. Huo, Z. Zhu, W. Huang, H. L. Xin, J. D. Snyder, D. Li, J. A. Herron and M. Mavrikakis, et al. , Science, 2014, 343, 1339–1343 CrossRef CAS PubMed.
- N. Becknell, Y. Son, D. Kim, D. Li, Y. Yu, Z. Niu, T. Lei, B. T. Sneed, K. L. More, N. M. Markovic, V. R. Stamenkovic and P. Yang, J. Am. Chem. Soc., 2017, 139, 11678–11681 CrossRef CAS PubMed.
- V. R. Stamenkovic, B. Fowler, B. S. Mun, G. Wang, P. N. Ross, C. A. Lucas and N. M. Marković, Science, 2007, 315, 493–497 CrossRef CAS PubMed.
- J. Wu, L. Qi, H. You, A. Gross, J. Li and H. Yang, J. Am. Chem. Soc., 2012, 134, 11880–11883 CrossRef CAS PubMed.
- P. Strasser, S. Koh, T. Anniyev, J. Greeley, K. More, C. Yu, Z. Liu, S. Kaya, D. Nordlund, H. Ogasawara, M. F. Toney and A. Nilsson, Nat. Chem., 2010, 2, 454 CrossRef CAS PubMed.
- P. Moseley and W. A. Curtin, Nano Lett., 2015, 15, 4089–4095 CrossRef CAS PubMed.
- G. Wang, M. A. Van Hove, P. N. Ross and M. I. Baskes, J. Chem. Phys., 2004, 122, 024706 CrossRef PubMed.
- R. F. de Morais, A. A. Franco, P. Sautet and D. Loffreda, ACS Catal., 2016, 6, 5641 CrossRef.
- G. G. Asara, L. O. Paz-Borbón and F. Baletto, ACS Catal., 2016, 6, 4388–4393 CrossRef CAS.
- C. M. Da Silva, A. Girard, M. Dufond, F. Fossard, A. Andrieux-Ledier, V. Huc and A. Loiseau, Nanoscale Adv., 2020, 2, 3882–3889 RSC.
- W.-J. Zeng, C. Wang, Q.-Q. Yan, P. Yin, L. Tong and H.-W. Liang, Nat. Commun., 2022, 13, 7654 CrossRef CAS PubMed.
- P. Andreazza, V. Pierron-Bohnes, F. Tournus, C. Andreazza-Vignolle and V. Dupuis, Surf. Sci. Rep., 2015, 70, 188–258 CrossRef CAS.
- J. Penuelas, P. Andreazza, C. Andreazza-Vignolle, H. C. N. Tolentino, M. De Santis and C. Mottet, Phys. Rev. Lett., 2008, 100, 115502–115505 CrossRef CAS PubMed.
- P. Andreazza, C. Mottet, C. Andreazza-Vignolle, J. Penuelas, H. C. N. Tolentino, M. De Santis, R. Felici and N. Bouet, Phys. Rev. B: Condens. Matter Mater. Phys., 2010, 82, 155453–155460 CrossRef.
- D. Alloyeau, C. Ricolleau, C. Mottet, T. Oikawa, C. Langlois, Y. Le Bouar and A. Loiseau, Nat. Mater., 2009, 8, 940–947 CrossRef CAS PubMed.
- N. Blanc, F. Tournus, V. Dupuis and T. Epicier, Phys. Rev. B: Condens. Matter Mater. Phys., 2011, 83, 092403–092407 CrossRef.
- A. Front, B. Legrand, G. Tréglia and C. Mottet, Surf. Sci., 2019, 679, 128–138 CrossRef CAS.
- F. Tournus, A. Tamion, N. Blanc, A. Hannour, L. Bardotti, B. Prével, P. Ohresser, E. Bonet, T. Epicier and V. Dupuis, Phys. Rev. B: Condens. Matter Mater. Phys., 2008, 77, 144411–144422 CrossRef.
- M. Delalande, M. J.-F. Guinel, L. F. Allard, A. Delattre, R. Le Bris, Y. Samson, P. Bayle-Guillemaud and P. Reiss, J. Phys. Chem. C, 2012, 116, 6866–6872 CrossRef CAS.
- Y. Mishin, Acta Mater., 2021, 214, 1–48 CrossRef.
- V. Rosato, M. Guillopé and B. Legrand, Philos. Mag. A, 1989, 59, 321–336 CrossRef.
- G. Kresse and J. Hafner, Phys. Rev. B: Condens. Matter Mater. Phys., 1993, 47, 558 CrossRef CAS PubMed.
- G. Kresse and J. Furthmüller, Comput. Mater. Sci., 1996, 6, 15–50 CrossRef CAS.
- G. Kresse and J. Furthmüller, Phys. Rev. B: Condens. Matter Mater. Phys., 1996, 54, 11169–11186 CrossRef CAS PubMed.
- J. P. Perdew, J. A. Chevary, S. H. Vosko, K. A. Jackson, M. R. Pederson, D. J. Singh and C. Fiolhais, Phys. Rev. B: Condens. Matter Mater. Phys., 1992, 46, 6671–6687 CrossRef CAS PubMed.
- J. P. Perdew, K. Burke and M. Ernzerhof, Phys. Rev. Lett., 1996, 77, 3865–3868 CrossRef CAS PubMed.
- P. E. Blöchl, Phys. Rev. B: Condens. Matter Mater. Phys., 1994, 50, 17953–17979 CrossRef PubMed.
- G. Kresse and D. Joubert, Phys. Rev. B: Condens. Matter Mater. Phys., 1999, 59, 1758–1775 CrossRef CAS.
- H. J. Monkhorst and J. D. Pack, Phys. Rev. B: Condens. Matter Mater. Phys., 1976, 13, 5188–5192 CrossRef.
- C. Kittel, Introduction to Solid State Physics, Wiley, New York, 7th edn, 1996 Search PubMed.
- F. R. Boer, W. C. M. de Mattens, R. Boom, A. R. Miedema and A. K. Niessen, Cohesion in metals. Transition metal alloys, North Holland, 1988, vol. 1 Search PubMed.
- G. Simmons and H. Wang, Single crystal elastic constants and calculated aggregate properties, The MIT press, 1971 Search PubMed.
- R. Hultgren, P. D. Desai, D. T. Hawkins, M. Gleiser and K. K. Kelley, Selected Values of the Thermodynamic Properties of Binary Alloys, American Society for Metals, Jossey-Bass Publishers, Berkeley, 1981, pp. 777 Search PubMed.
- M. Hansen and K. Anderko, Constitution of Binary Alloys, McGraw-Hill, New York, 1958, pp. 1031 Search PubMed.
- W. Pearson, A Handbook of Lattice Spacings and Structures of Metals and Alloys, Pergamon Press, Oxford, Edinburgh, New York, Paris, Frankfurt, 1958, pp. 131 Search PubMed.
- C. Leroux, M. C. Cadeville, V. Pierron-Bohnes, G. Indent and F. Hinz, J. Phys. F: Met. Phys., 1988, 18, 2033 CrossRef CAS.
- C. E. Dahmani, M. C. Cadeville, J. M. Sanchez and J. L. Morán-López, Phys. Rev. Lett., 1985, 55, 1208–1211 CrossRef CAS PubMed.
- M. Cadeville, C. Dahmani and F. Kern, J. Magn. Magn. Mater., 1986, 54–57, 1055–1056 CrossRef CAS.
- Y. Gauthier, Y. Joly, R. Baudoing and J. Rundgren, Phys. Rev. B: Condens. Matter Mater. Phys., 1985, 31, 6216–6218 CrossRef CAS PubMed.
- Y. Gauthier, R. Baudoing-Savois, J. Rundgren, M. Hammar and M. Gothelid, Surf. Sci., 1995, 327, 100–120 CrossRef CAS.
- N. Metropolis, A. Metropolis, M. Rosenbluth, A. Teller and E. Teller, J. Chem. Phys., 1953, 21, 1087 CrossRef CAS.
- P. C. Kelires, Phys. Rev. B: Condens. Matter Mater. Phys., 2000, 62, 15686–15694 CrossRef CAS.
- A. Front and C. Mottet, J. Phys. Chem. C, 2021, 125, 16358–16365 CrossRef CAS.
- P. Buffat and J.-P. Borel, Phys. Rev. A, 1976, 13, 2287 CrossRef CAS.
- T. Castro, R. Reifenberger, E. Choi and R. Andres, Phys. Rev. B: Condens. Matter Mater. Phys., 1990, 42, 8548 CrossRef CAS PubMed.
- A. Front and C. Mottet, Phys. Chem. Chem. Phys., 2023, 25, 8386–8391 RSC.
- G. Boussinot, Y. Le Bouar and A. Finel, Acta Mater., 2010, 58, 4170–4181 CrossRef CAS.
- G. Tréglia and B. Legrand, Phys. Rev. B: Condens. Matter Mater. Phys., 1987, 35, 4338–4344 CrossRef PubMed.
- C. Mottet, G. Tréglia and B. Legrand, Surf. Sci., 1997, 383, L719–L727 CrossRef CAS.
- B. Zhu, H. Guesmi, J. Creuze, B. Legrand and C. Mottet, Phys. Chem. Chem. Phys., 2015, 17, 28129–28136 RSC.
- J. Amodeo and L. Pizzagalli, C. R. Phys., 2021, 22, 35–66 CrossRef.
- A. Bisht, R. Koju, Y. Qi, J. Hickman, Y. Mishin and E. Rabkin, Nat. Commun., 2021, 12, 2515 CrossRef CAS PubMed.
- J. Yan, S. Yin, M. Asta, R. O. Ritchie, J. Ding and Q. Yu, Nat. Commun., 2022, 13, 2789 CrossRef CAS PubMed.
- C. M. Da Silva, H. Amara, F. Fossard, A. Girard, A. Loiseau and V. Huc, Nanoscale, 2022, 14, 9832–9841 RSC.
| This journal is © the Owner Societies 2024 |

