
 Open Access Article
 This Open Access Article is licensed under a Creative Commons Attribution-Non Commercial 3.0 Unported Licence
Binding energies of ethanol and ethylamine on interstellar water ices: synergy between theory and experiments†
Jessica
Perrero
 ab,
Julie
Vitorino
c,
Emanuele
Congiu
c,
Piero
Ugliengo
*b,
Albert
Rimola
*a and
François
Dulieu
*c
ab,
Julie
Vitorino
c,
Emanuele
Congiu
c,
Piero
Ugliengo
*b,
Albert
Rimola
*a and
François
Dulieu
*c
aDepartament de Química, Universitat Autònoma de Barcelona, Bellaterra, 08193, Catalonia, Spain. E-mail: albert.rimola@uab.cat
bDipartimento di Chimica and Nanostructured Interfaces and Surfaces (NIS) Centre, Università degli Studi di Torino, via P. Giuria 7, 10125, Torino, Italy. E-mail: piero.ugliengo@unito.it
cCY Cergy Paris Université, Observatoire de Paris, PSL University, Sorbonne Université, CNRS, LERMA, F-95000 Cergy, France. E-mail: francois.dulieu@cyu.fr
First published on 7th June 2024
Abstract
Experimental and computational chemistry are two disciplines used to conduct research in astrochemistry, providing essential reference data for both astronomical observations and modeling. These approaches not only mutually support each other, but also serve as complementary tools to overcome their respective limitations. Leveraging on such synergy, we characterized the binding energies (BEs) of ethanol (CH3CH2OH) and ethylamine (CH3CH2NH2), two interstellar complex organic molecules (iCOMs), on crystalline and amorphous water ices through density functional theory (DFT) calculations and temperature-programmed desorption (TPD) experiments. Experimentally, CH3CH2OH and CH3CH2NH2 behave similarly, in which desorption temperatures are higher on the water ices than on a bare gold surface. Computed cohesive energies of pure ethanol and ethylamine bulk structures allow describing of the BEs of the pure species deposited on the gold surface, as extracted from the TPD curve analyses. The BEs of submonolayer coverages of CH3CH2OH and CH3CH2NH2 on the water ices cannot be directly extracted from TPD due to their co-desorption with water, but they are computed through DFT calculations, and found to be greater than the cohesive energy of water. The behaviour of CH3CH2OH and CH3CH2NH2 is different when depositing adsorbate multilayers on the amorphous ice, in that, according to their computed cohesive energies, ethylamine layers present weaker interactions compared to ethanol and water. Finally, from the computed BEs of ethanol, ethylamine and water, we can infer that the snow-lines of these three species in protoplanetary disks will be situated at different distances from the central star. It appears that a fraction of ethanol and ethylamine is already frozen on the grains in the water snow-lines, causing their incorporation in water-rich planetesimals.
1 Introduction
In astrochemistry, ethanol (CH3CH2OH) and ethylamine (CH3CH2NH2) belong to a class of compounds called interstellar complex organic molecules (iCOMs). These are compounds that contain between 6–12 atoms, in which at least one is carbon, also bearing non-metal heteroatoms, like N, O, S or P.1–3 These molecules are the simplest organic compounds synthesised in space, and hence they are thought to represent the dawn of organic chemistry. Additionally, they are thought to be precursors of more complex organic molecules, which can be of biological relevance, such as amino acids, nucleobases and sugars.4Ethylamine is thought to be the precursor of the alanine amino acid, just as methylamine is supposed to be the parent of glycine.5,6 Methylamine and ethylamine have been observed in the coma of comet 67P/C-G together with glycine.7 Furthermore, they have also been detected, together with a handful of amino acids, in comet 81P/Wild2 by the Stardust mission.8 In the interstellar medium (ISM), ethylamine has only been tentatively detected towards the Galactic center cloud G+0.693-0.027.9 On the other hand, ethanol has been detected in several comets (e.g., 67P/C-G,10 Lovejoy,11 and Hale–Bopp12) and in both warm (e.g., Sgr B2,13 Orion,14,15 and SVS-1316) and cold (e.g., L483,17 and TMC-118) environments of the ISM. Recently, it has also been identified in icy mantles.19,20
The presence of a complex molecule such as CH3CH2OH in warm sources was surprising, but plausible due to the environmental temperatures. However, its detection in cold regions challenged astrochemists. The interest in ethanol grew after a correlation between the abundances of glycolaldehyde and ethanol in the protostellar shock region L1157-B1 was evidenced.21 Consequently, a series of gas-phase reactions starting from ethanol and leading to glycolaldehyde were proposed, beginning with a H-abstraction step operated by Cl or OH radicals. From this neutral–neutral gas-phase mechanism, it appeared that ethanol could be the parent molecule of formic acid (HCOOH) and other iCOMs, such as glycolaldehyde (HCOCH2OH), acetic acid (CH3COOH), and acetaldehyde (CH3CHO).22
The reactivity of CH3CH2NH2, due to its scarce detection in the ISM, has been poorly explored. The UV irradiation and thermal processing of methylamine-containing ices yielded a variety of products, such as formamide, ethylamine, methylcyanide and N-heterocycles, showing how molecular complexity can increase upon methylamine processing.23 The production of CH3CH2NH2 is usually attributed to the reaction between ammonia and C-bearing species on the ice mantle. The exposure of NH3 and CH4/C2H6 ices to cosmic ray radiation at 5 K resulted in the formation of CH3NH2 and CH3CH2NH2, respectively.5 At higher temperatures, photolysis of C2H2 + NH3 between 180 and 300 K produced ethylamine (among other products), with a yield proportional to temperature.24
Formation of ethanol, in contrast, has been more explored. Experimentally, both energetic and non-energetic pathways have been identified: UV irradiation of CO2-rich and H2O-rich ices;25 UV irradiation and radiolysis of C2H2:H2O ices;26,27 O addition to ethane;28 and exposure of C2H2:O2 ice to H atoms.29 Computational works also characterized ethanol formation, proposing synthetic routes on dust grains at low temperatures and through almost barrierless pathways. The radical–radical coupling between CH3 and CH2OH on water ice was postulated as a promising mechanism, since its competitive channel (a H-abstraction yielding CH4 and H2CO) was found to be highly disfavoured.30 The reaction of CCH + H2O (where water is a component of the ice mantle), passing through the formation of vinyl alcohol, can yield ethanol after some hydrogenation steps that, in the case of presenting a barrier, can proceed via tunnelling.31 More recently, two works investigated the reactivity of atomic carbon on CO-rich and H2O-rich ices, suggesting that the two scenarios can lead to the formation of iCOMs in a non-energetic way, especially ethanol, when species characterized by a C![[double bond, length as m-dash]](https://www.rsc.org/images/entities/char_e001.gif) CO skeleton are fully hydrogenated.32,33 Clearly, the discrepancy in the quantity of studies regarding these two molecules is linked to their detection. Numerous factors may contribute to the elusive nature of ethylamine to astronomers. For instance, it might predominantly reside in ice mantles rather than in the gas phase; it could exhibit higher reactivity leading to rapid consumption upon entering the gas phase; or it may have spectral features that overlap with those of other molecules. To streamline our investigation, we focused on the first point. The adsorption and desorption processes are determined by the binding energy (BE), a pivotal parameter that quantifies the strength of the interaction between a molecule and a surface.34 It also regulates whether diffusion processes can take place, since diffusion barriers are usually assumed to be a fraction of the BE, e.g., ref. 35–38. The first estimates of CH3CH2OH and CH3CH2NH2 BEs were made by Garrod,39 who proposed BE = 65.5 kJ mol−1 for ethylamine and BE = 52.0 kJ mol−1 for ethanol, in order to introduce them in astrochemical models. In 2011, Lattelais et al.40 determined the BE of CH3CH2OH on water ice to be 56.5 kJ mol−1. More recently, Etim et al.41 computed the BE of ethanol using the methodology introduced by Wakelam et al.,42 that is, simulating the ice with one water molecule and calculating the BE (in Kelvin) using the scaling BEice = 289.019 + (1.65174 × BE1H2O), this way obtaining a value between 37.4 kJ mol−1 and 40.7 kJ mol−1, with an uncertainty in the final result of 30%. To the best of our knowledge, no other estimates are available.
CO skeleton are fully hydrogenated.32,33 Clearly, the discrepancy in the quantity of studies regarding these two molecules is linked to their detection. Numerous factors may contribute to the elusive nature of ethylamine to astronomers. For instance, it might predominantly reside in ice mantles rather than in the gas phase; it could exhibit higher reactivity leading to rapid consumption upon entering the gas phase; or it may have spectral features that overlap with those of other molecules. To streamline our investigation, we focused on the first point. The adsorption and desorption processes are determined by the binding energy (BE), a pivotal parameter that quantifies the strength of the interaction between a molecule and a surface.34 It also regulates whether diffusion processes can take place, since diffusion barriers are usually assumed to be a fraction of the BE, e.g., ref. 35–38. The first estimates of CH3CH2OH and CH3CH2NH2 BEs were made by Garrod,39 who proposed BE = 65.5 kJ mol−1 for ethylamine and BE = 52.0 kJ mol−1 for ethanol, in order to introduce them in astrochemical models. In 2011, Lattelais et al.40 determined the BE of CH3CH2OH on water ice to be 56.5 kJ mol−1. More recently, Etim et al.41 computed the BE of ethanol using the methodology introduced by Wakelam et al.,42 that is, simulating the ice with one water molecule and calculating the BE (in Kelvin) using the scaling BEice = 289.019 + (1.65174 × BE1H2O), this way obtaining a value between 37.4 kJ mol−1 and 40.7 kJ mol−1, with an uncertainty in the final result of 30%. To the best of our knowledge, no other estimates are available.
For this reason, we characterized both experimentally and computationally the BEs of ethanol and ethylamine adsorbed on crystalline and amorphous water ice (CI and ASW, respectively). In order to interpret the results of the experiments, we also computed the bulk and surface cohesive energies of ethanol and ethylamine crystals, as well as the BEs of each species on the most stable surface formed during the growth of the corresponding crystal.
BEs, in addition to being a key parameter in astrochemical models, are also one of the two quantities needed to compare the theoretical calculations with the desorption energy Edes extracted from the experiments, together with the pre-exponential factor ν.34 The latter is often defined as the vibrational frequency of a given species in its surface potential well, and it takes into account the entropic effects of the desorption process. The pre-exponential factor is entered into the equation that determines the thermal desorption rate, together with Edes, which accounts for the enthalpic contribution. There are two main ways to determine ν: one is to adopt the approximated approach of Hasegawa and Herbst,43 the alternative consists of exploiting the transition-state theory within the immobile adsorbate approximation, as Tait et al.44 suggested. In this work, we adopted the latter approach to determine ν, with the aim to derive Edes from the experimental data.
The work is organized as follows: in Section 2 we present the computational results, while Section 3 is dedicated to the laboratory experiments. Discussion of the obtained results through the two approaches is provided in Section 4, along with their astrophysical implications. Finally, we summarized the most important findings of the work in Section 5.
2 Theoretical simulations
For the sake of clarity, we adopted the following notation to distinguish between the molecular adsorbates and the solid-state phases: CH3CH2OH and CH3CH2NH2 refer to the adsorbates, while the bulk and surfaces of ethanol and ethylamine are identified as EtOH and EtNH2. Accordingly, the adsorption of ethanol on an ethanol surface is referred to as CH3CH2OH on an EtOH surface.2.1 Methodology
Quantum chemical periodic calculations were performed with the CRYSTAL17 code, which is suitable for treating systems with zero (molecules), one (polymers), two (slab surfaces), and three (bulks) periodic dimensions. It uses localized Gaussian functions as basis sets, contrary to the plane waves adopted by most of the periodic codes.45 This allows us to rigorously define true periodic 2D models, and avoid having to build replicas of the system along the non-periodic direction. In this work, we modelled 3D (bulks) and 2D (slabs) systems for H2O, EtOH and EtNH2 ices.To compute the BEs, DFT single-point energy calculations were performed on each optimized HF-3c geometry (hereafter referred to as DFT//HF-3c). The hybrid B3LYP functional52–54 combined with the D3(BJ) correction for the dispersion energy was used, a methodology already tested and applied for closed-shell species.55,56 B3LYP-D3(BJ) was combined with an Ahlrichs triple-zeta-valence-quality basis set supplemented with a double set of polarization functions, defined as A-VTZ*.57
All the structures (bulks, surfaces and adsorption complexes) were characterized by HF-3c harmonic frequency calculations performed on the entire system. This serves to confirm the nature of the stationary points and to compute the zero-point-energy (ZPE) correction that accounts for the kinetic vibrational energy at 0 K.
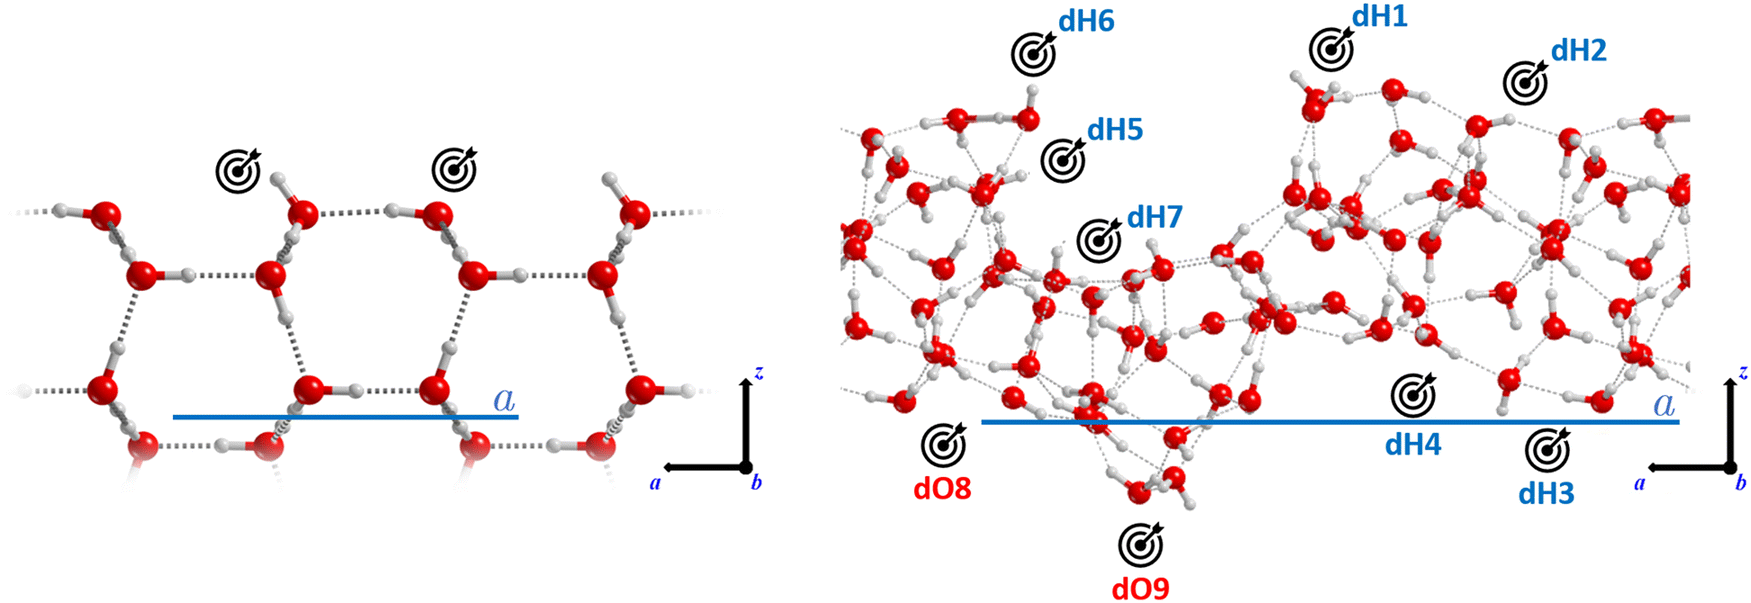 | ||
| Fig. 1 Crystalline (left) and amorphous (right) periodic water ice models adopted in this work. The target icon indicates the binding sites considered for the adsorption of CH3CH2OH and CH3CH2NH2. On the amorphous model, the sites have been labelled as dangling hydrogen atoms (dH1–dH7) and dangling oxygen atoms (dO8–dO9). Colour code: red, oxygen; grey, hydrogen. The unit cell parameter is also highlighted (in blue). | ||
The adsorption complexes were manually constructed placing the adsorbates on the binding sites present in the ice models, following the principle of electrostatic complementarity between the adsorbate and the surface, and fully optimizing the structures. On the crystalline ice model, we characterized three situations: (i) single molecule adsorption (S-ADS), represented by one molecule adsorbed per unit cell; (ii) a half-monolayer (H-ML) coverage, simulated by adsorbing two molecules per unit cell; and (iii) a full monolayer (F-ML) coverage, modelled by adsorbing four molecules per unit cell. Alternatively, on the amorphous ice model, a range of single adsorptions were characterized with the aim to obtain BEs describing the adsorbate/ice interactions of different strengths. Nine positions suitable to adsorb CH3CH2OH and CH3CH2NH2 were identified, among which seven are dangling H atoms (dH) and the remaining two are dangling O atoms (dO). Given the presence of both H-bond acceptor and donor groups in the adsorbates, such an ensemble of binding sites allows the establishment of both types of interactions.
The final binding energy, BE(0), defined as a positive quantity in the case of a favourable interaction, results from subtracting the basis set superposition error (BSSE), arising from the finiteness of the basis set, and adding the HF-3c ZPE correction at 0 Kelvin (ΔZPE = ZPEcomplex − ZPEice − ZPEspecies) to the bare interaction energy (ΔE = Ecomplex − Eice − Especies).
| BE(0) = BE − ΔZPE = −(ΔE − BSSE) − ΔZPE | (1) |
Each BE value can be decomposed in a purely electronic contribution extracted from the pure DFT calculation and a fraction due to purely dispersive interactions, estimated with the D3(BJ) term. We are aware that this approach is not rigorous, thus our estimates should be taken as indicative. A detailed explanation of the computation of the BE(0)s and their energetic contributions can be found in the ESI† and in previously published works.55,56
The surface energy (ES, in J m−2) is the energy required to cut out a slab from the bulk. The most stable surfaces are characterized by the lowest surface energies. ES is calculated through the equation:
 | (2) |
The cohesive energy (EC, in kJ mol−1) of the bulk (or a surface) results from the equation:
 | (3) |
The extraction energy (EX) of a molecule from a surface is the energy cost to extract the molecule from the surface. It is obtained by calculating the energy of the structure that follows the removal of one surface molecule without re-optimization of the structure, and is repeated for each molecule located in the external layer of the surface:
| EX = Ecarved + Emol − Eslab + ΔZPEextr, | (4) |
The most stable surface of a crystal is the most extended one, and is characterized by the lowest ES and the highest EC values. In principle, it should also possess the highest EX, since it is more difficult to extract a molecule from a well-packed structure. The (010) EtOH and the (100) EtNH2 surfaces satisfy these criteria.
Therefore, we simulated the adsorption of CH3CH2OH and CH3CH2NH2 onto these surfaces, identifying three binding sites per adsorbate.
2.2 Results
This section is organized as follows: Section 2.2.1 addresses the modeling of bulks and surfaces of EtOH and EtNH2 crystals; Section 2.2.2 regards the computation of the BE(0)s obtained on such surfaces; Section 2.2.3 presents the BE(0)s for the S-ADS scenario on the crystalline and amorphous water ice surface models; and Section 2.2.4 shows the results for the H-ML and F-ML coverages.In the asymmetric unit, both EtOH and EtNH2 present two crystallographically independent molecules, while the unit cells contain four molecules (see Fig. 2a and d). In both cases, two types of intermolecular interactions can be distinguished: H-bonding between the NH2 (for EtNH2) and OH (for EtOH) groups, and CH3⋯CH3 dispersion. The conformation around the C–C bond is staggered in both molecules. In EtOH, the OH group is differently oriented so that both the trans and the gauche conformers are present in the unit cell. The optimization at the HF-3c level of theory results in a reduction of the cell parameters, and consequently of the cell volume by 7% for EtOH and by 13% for EtNH2 (see Table 1).
 | ||
| Fig. 2 Unit cell of the bulk structures of EtNH2 (a) and EtOH (d). Lateral view of the (100) EtNH2 (b) and (010) EtOH (e) slabs, the most stable surfaces cut out from the respective bulks, exposing their apolar backbone to the external environment (A-layer type). Lateral view of the (100) EtNH2 (c) and (010) EtOH (f) slabs, which were generated by cutting out the surface in order to expose the polar moieties to the external environment (B-layer). | ||
| Ethanol | Ethylamine | |||
|---|---|---|---|---|
| Exp. | Comput. | Exp. | Comput. | |
| a | 5.377 | 5.179 | 8.263 | 7.856 |
| b | 6.882 | 6.773 | 7.310 | 6.949 |
| c | 8.255 | 8.146 | 5.532 | 5.315 |
| α | 90.0 | 90.0 | 90.0 | 89.9 |
| β | 102.2 | 104.8 | 99.1 | 100.0 |
| γ | 90.0 | 90.0 | 90.0 | 89.8 |
| Volume | 298.6 | 276.2 | 329.9 | 285.8 |
The (010), (100), (001), (110), (101), (011), and (111) surfaces were generated from the EtOH and EtNH2 bulk structures, the thicknesses of which satisfy the surface energy convergence condition.62 Special care was paid to the resulting dipole moment across the non-periodic direction of each slab, discarding those with |μ| > 5 D. The stability order of the surfaces was determined primarily on their ES value, and in the second instance on their EC and EX values (shown in Table 2). For both EtOH and EtNH2, the slabs present very small ES values, in agreement with their weakly bound molecular crystal natures. The extraction energy was computed for each molecule laying in the external layer of each surface. Thus, two to four values were computed for each slab. The (100) slabs represent the only exception for both systems, as the molecules defining the top layer are related by symmetry (a glide reflection in EtOH, and a screw rotation in EtNH2) hence providing only one value.
| Surface | μ | E S | E C | E X |
|---|---|---|---|---|
| EtOH | ||||
| (010)A-layer | +7.2 × 10⁻⁴ | 0.0761 | −49.4 | 104.1–108.2 |
| (100) | −3.3 | 0.0994 | −47.9 | 106.0 |
| (101) | −1.7 | 0.1053 | −45.7 | 62.0–113.7 |
| (110) | −2.9 | 0.1594 | −44.0 | 59.0–116.6 |
| (011) | +3.5 | 0.1616 | −40.3 | 60.0–95.2 |
| (010)B-layer | −1.8 × 10⁻¹ | 0.1857 | −42.0 | 58.9–60.0 |
| EtNH2 | ||||
| (100)A-layer | +1.3 × 10⁻⁴ | 0.0673 | −40.4 | 71.5 |
| (001) | +2.4 × 10⁻³ | 0.0797 | −39.9 | 64.8–69.3 |
| (010) | +2.5 × 10⁻⁴ | 0.0790 | −38.9 | 65.0–69.4 |
| (111) | −1.2 × 10⁻³ | 0.0962 | −35.7 | 63.3–80.4 |
| (101) | +1.2 × 10⁻³ | 0.1034 | −33.8 | 36.0–63.5 |
| (110) | +1.8 | 0.1295 | −36.7 | 68.1–84.3 |
| (011) | +8.8 × 10⁻⁴ | 0.1319 | −30.0 | 37.5–60.4 |
| (100)B-layer | −1.5 × 10⁻³ | 0.1857 | −34.1 | 45.6 |
Six EtOH surfaces (see Table 2) were found to comply with the dipole moment constraint. The ladder of stability is (from more to less stable): (010)A-layer > (100) > (101) > (110) > (011) > (010)B-layer (the definition of A-layer and B-layer is explained below). The cohesive energies obtained for these slabs ranges from −49.4 kJ mol−1 (010)A-layer to −40.3 kJ mol−1 (011), while the extraction energy spans the range from 59 to 115 kJ mol−1.
For EtNH2, eight surfaces were characterized (see Table 2), and their stability order is: (100)A-layer > (001) > (010) > (111) > (101) > (110) > (011) > (100)B-layer. All of them have an almost null dipole, with the exception of the (110) slab (μ = 1.8 D), which is responsible for the large ES. The EC values range between −40.4 kJ mol−1 (100)A-layer and −30.0 kJ mol−1 (011), and EX covers the range between 35 and 85 kJ mol−1, which makes ethylamine slightly less bound than ethanol.
Two types of cuts (A-layer and B-layer) were modeled for the (010) EtOH and the (100) EtNH2 surfaces, the former one being the most stable slab cut. In the EtOH-(010) and EtNH2-(100) surfaces, a couple of layers held together by a network of H-bonds is alternated with another couple governed by dispersive forces. Depending on the type of interlayer interaction preserved by the cut, the resulting surface can be characterized by the polar moieties being completely segregated inwards to the slab (A-layer, see Fig. 2b and e) or totally exposed to the exterior (B-layer, see Fig. 2c and f). The presence of polar groups exposed to the surface causes the B-layer cut to be less stable than the A-layer cut, resulting in EtOH-(010)B-layer and EtNH2-(100)B-layer being characterized by the largest ES. The natural consequence is that B-layer type surfaces will yield larger BE(0)s for the adsorption of CH3CH2OH and CH3CH2NH2.
On the EtOH-(010)A-layer surface, we identified two adsorption complexes characterized by a different orientation of the adsorbate with respect to the surface. In the first case, the driving force of the interaction is represented by the dispersive interactions between the aliphatic chains, resulting in the ethanol molecule laying parallel to the surface, with BE(0) = 20.9 kJ mol−1. In the second case, the molecule is placed perpendicularly to the surface to establish a H-bond interaction with one of the partially exposed hydroxyl groups. Dispersive forces also play an important role in the value of BE(0), which is as high as 30.9 kJ mol−1.
On the EtNH2-(100)A-layer surface, we found two very similar adsorption complexes with a BE(0) of 21.4 kJ mol−1 and 21.6 kJ mol−1, due to the symmetry of the surface. They are entirely dominated by dispersive forces, the adsorbate molecule laying parallel to the surface in the two cases. The small difference between the two complexes is due to a slight change in the orientation of the ethylamine with respect to the EtNH2 surface.
The adsorption complex obtained on the EtNH2-(100)B-layer and EtOH-(010)B-layer slabs are characterized by the –OH and –NH2 groups of the adsorbate accepting a H-bond from the surface, resulting in BE(0) = 41.8 kJ mol−1 for CH3CH2OH and BE(0) = 43.0 kJ mol−1 for CH3CH2NH2.
We identified three adsorption complexes of CH3CH2OH onto the CI surface, characterized by a different orientation of the adsorbate with respect to the surface (see bottom panel of Fig. 3). Each complex is characterized by the presence of at least one H-bond. In the weakest bound complex (BE(0) = 33.4 kJ mol−1), CH3CH2OH only acts as a H-bond acceptor, in favour of the interaction of the aliphatic chain with the ice. In the other two complexes, both the O and H atoms of CH3CH2OH are involved in H-bonds, but the orientation of the adsorbate, in the most stable case (BE(0) = 61.6 kJ mol−1), precisely interacts with uncoordinated surface-exposed H2O sites, while, in the other (BE(0) = 42.2 kJ mol−1), a rearrangement of surface-dangling OH groups is required to establish two (longer) H-bonds.
 | ||
| Fig. 3 Optimized geometries of the adsorption complexes of ethylamine (top) and ethanol (bottom) on the crystalline water ice surface model. The corresponding computed BE(0)s are also given. | ||
For CH3CH2OH on the ASW surface, nine binding sites were sampled. The majority of the BE(0) values range from 37 to 48 kJ mol−1 (see Table 3), with two exceptions. In the dO8 site, the ethanol OH group only acts as a (weak) H-bond donor towards the dO atom and hence BE(0) = 26.0 kJ mol−1. In contrast, in the dH7 site, ethanol is located in the cavity of the ASW and establishes three H-bonds, two involving the O atom and one the H atom of the OH moiety, and hence BE(0) = 59.1 kJ mol−1.
| Binding site | CH3CH2OH | CH3CH2NH2 |
|---|---|---|
| dH1 | 37.0 | 50.1 |
| dH2 | 44.8 | 47.8 |
| dH3 | 40.3 | 54.0 |
| dH4 | 42.0 | 54.2 |
| dH5 | 40.5 | 44.8 |
| dH6 | 47.8 | 50.2 |
| dH7 | 59.1 | 71.5 |
| dO8 | 26.0 | 19.2 |
| dO9 | 37.1 | 46.2 |
The adsorption of CH3CH2NH2 on the CI surface model resulted in two adsorption complexes, each characterized by the presence of two H-bonds (see top panel of Fig. 3). In the most stable complex, CH3CH2NH2 is accepting a H-bond through the N atom and donating another H-bond through a H atom of the amino group, resulting in BE(0) = 61.4 kJ mol−1, where the contribution of weak forces is reduced to 40%. In the second (less stable) complex, the two H atoms of the amino group act as H-bond donors, thus resulting in a weaker complex with BE(0) = 23.1 kJ mol−1), where the dispersion interactions of the aliphatic chains are responsible for the larger contribution (almost 90%) to the final BE(0).
For CH3CH2NH2 on the ASW surface, similar to what was observed for CH3CH2OH, the nine BE(0)s range from 45 to 55 kJ mol−1, with the exception of those computed for sites dO8 and dH7, with BE(0) = 19.2 kJ mol−1 and 71.5 kJ mol−1, respectively. The reasons are also weak a H-bond donation for the first case and a very strong interaction dominated by three H-bonds involving each atom of the NH2 group for the second case.
For both species, the H-ML BE(0) values per molecule are slightly larger than those obtained in the S-ADS regime: 66.0 kJ mol−1 (versus 61.6 kJ mol−1) for CH3CH2OH, and 64.5 kJ mol−1 (versus 61.4 kJ mol−1) for CH3CH2NH2. Instead, the F-ML BE(0) values per molecule are smaller, 50.0 kJ mol−1 for CH3CH2OH and 49.5 kJ mol−1 for CH3CH2NH2. This is due to the fact that, in the H-ML cases, two molecules can still easily be accommodated in the cell and find the most favourable geometry to maximize their interactions with the surface. In contrast, in the F-ML cases, the four molecules struggle to fit in the cell and lay with the aliphatic chain pointing upwards, minimizing the interaction with the ice and being surrounded only by the other adsorbates. The lateral interaction between the adsorbates, one of the terms favourably contributing to the BE(0), is mostly based on weak London forces, increasing the weight of dispersive interactions in the final BE(0): from 43% and 44% in the H-ML conditions, to 68% and 79% in the F-ML ones, for CH3CH2OH and CH3CH2NH2, respectively.
Despite the compromises made by our models and the simplified procedures, the present results are guidelines for understanding the process of approaching a monolayer coverage in a real system. That is, the first adsorbate molecules occupy the strongest surface adsorption sites, and then, by increasing the number of adsorbates, surface sites from the strongest to the weakest ones become occupied, until the formation of a monolayer occurs. This assumption holds true in the case of molecules that wet the surface, like ethanol and ethylamine.
3 Laboratory experiments
The desorption energies (Edes) of CH3CH2OH and CH3CH2NH2 have been estimated by means of experimental procedures, and dividing the work into two parts: determination of the monolayer (ML) of ethanol and ethylamine, and temperature-programmed desorption (TPD) measurements to determine the Edes of the adsorbates on crystalline and amorphous water ice films.3.1 Methodology
Ethanol is liquid at room temperature, while ethylamine needs to be diluted in water to be stable (with about 66–72% of CH3CH2NH2 in H2O‡). The two species were first converted into gas in the central molecular beamline of VENUS. The beam has an aperture of approximately 3 mm and a residual pressure of 10−7 mbar. By means of differential pumping through two intermediate stainless steel chambers, the gases were then sent towards the cold surface. The species were deposited on the surface, which was maintained at a constant temperature of 70 K. During this process, the base pressure of the main chamber remains low (up to 5 × 10⁻¹⁰ mbar), ensuring a focalization of the molecules onto the sample and negligible gas–gas interactions above the cold head. During this phase, it is possible to monitor the evolution of the ice in situ via reflection absorption infrared spectroscopy (RAIRS) performed with a Vertex-70 Fourier Transform infrared (FT-IR) spectrometer over a spectral range from 800 to 4500 cm−1 (from 12.5 to 2.22 nm). The production of a mean spectrum is non-destructive and takes place every two minutes, corresponding to 256 scans of the ice.
Once the deposition phase is completed, the desorption of the species from the surface is monitored via temperature-programmed desorption (TPD). After positioning the Hiden 51/3F Quadrupole Mass Spectrometer (QMS) 5 mm in front of the cold head, the surface temperature is gradually increased with a rate of β = 0.15 K s−1 = 9 K min−1 up to 200 K. Throughout the heating process, the different chemical species progressively sublimate from the surface and desorb at a temperature that depends on their nature and on the binding energy with each site offered by the surface. This results in a TPD spectrum where the abundance of each atomic mass unit (amu) is monitored against its thermal desorption temperature. Indeed, the electrons produced by the hot filament of the QMS will likely induce the fragmentation of the molecules hitting its head into several ions. The statistic repartition of the ions, called the cracking pattern, is specific for each species and depends on the ionization energy (set at 30 eV in this work). Each desorption curve can be described with the Polanyi–Wigner equation following an Arrhenius relationship.
 | (5) |
The first method can be performed in situ via infrared measurements during the deposition. The column density N (molecules cm−2) of deposited or newly formed species can be calculated via a modified Lambert–Beer equation,
 | (6) |
 is the integrated area of the infrared absorption feature (cm−1), and f is the corresponding band strength. In the case of ethanol, the calculation shows that the monolayer is reached after approximately 21 minutes, using a band strength of f = 1.4110−17 cm × molecules−1 at 1055 cm−1.64 For ethylamine, the only band-strength values available have been calculated very recently.6 As there are no other available values, most experimental works involving ethylamine (i.e., Danger et al.65) adopted the band strength of methylamine, which was first communicated in 2005 without any known source.66 With the corresponding band strength of amorphous ethylamine f = 3.6910−18 cm × molecules−1 at 1395 cm−1,6 one monolayer of CH3CH2NH2 appears to be reached after 24 minutes of deposition.
The other way is via the TPD measurements as described by Noble et al.67 A monolayer (ML) is defined by the theoretical filling of all available sites on the gold surface, corresponding to approximately 1015 molecules cm−2. During the deposition phase, as the dose is gradually increased, the available sites are progressively filled, beginning from high-depth sites towards low-energy ones, until the deposited amount reaches 1 ML. In the case of ethanol, the values obtained with TPD and infrared measurements match well, giving a ML completion after ∼20 minutes. This is easily determinable with the desorption profile of CH3CH2OH. Ethylamine, however, has a more complex desorption profile, making the monolayer determination more ambiguous. The areas under the main fragment curves of ethylamine and ethanol are not directly comparable, due to their different ionization cross-sections at 30 eV. At this ionization energy, there is no record of an ionization cross-section measurement for ethylamine. The value of 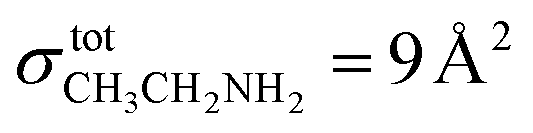 has been used in studies of 67P/C-G7,68 but is only valid at 70 eV. In this work, we chose to use the ionization cross-section of dimethylamine (
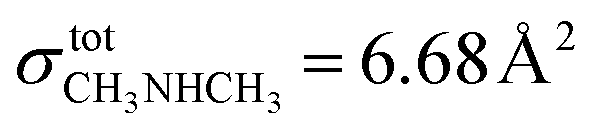 at 30 eV), which also has a 9 Å2 value at 70 eV.69 Considering this, it is possible to demonstrate once again the time of ML completion for ethanol (20 minutes) and ethylamine (24 minutes). Table 4 reports the list of experiments performed.
| Deposited molecule | Quantity deposited (ML) | Substrate type | Substrate thickness (ML) |
|---|---|---|---|
| Ethanol (C2H5OH) | 0.25; 0.5; 0.6; 0.7; 0.75; 1.5 | Gold | — |
| 0.15; 0.25; 0.7; 2.1 | Amorphous H2O | 10; 6.5; 10; 10 | |
| 0.15 | Crystalline H2O | 10 | |
| Ethylamine (C2H5NH2) | 0.2; 0.33; 0.4; 0.7; 0.83; 1.25 | Gold | — |
| 0.08; 0.13; 0.4; 1.25 | Amorphous H2O | 10; 10; 10; 10 | |
| 0.13 | Crystalline H2O | 10 | |
Depending on the temperature and modality of water deposition, different morphologies can be obtained. In our experimental conditions, non-porous amorphous solid water (ASW) – mimicking a compact ice bulk – is easily formed by leaving the cold finger at a steady temperature of 110 K during the deposition. Once a thickness of 10 ML is reached, the sample is cooled down to 70 K in order to deposit one of the molecules of interest. The procedure to form crystalline ice (CI) requires more steps, as a thermal treatment has to be performed on the 10 ML formerly deposited. The ice is first warmed to 140 K at a rate of 9 K min−1, then to 142.5 K at a rate of 6 K min−1. The process of crystallization can be monitored via RAIRS (stopped once the entire ice is crystalline, proved by a major change in the band shape), as well as via QMS to quantify the desorbing H2O until this value remains constant.
The quantity of H2O on the surface can directly be estimated during the deposition by monitoring the partial pressure of water inside the main chamber. Otherwise, it can be verified using the same methods as for ethanol and ethylamine.
3.2 Results
The experiments performed in this work can be divided into two categories: (i) sub-monolayer depositions of the adsorbates on ASW or CI films; and (ii) multilayer depositions of the adsorbates on an ASW film. For each adsorbate, CH3CH2OH and CH3CH2NH2, three sub-monolayer depositions were carried out on ASW and one on CI. Only one multilayer deposition of each species was performed on amorphous H2O. See Table 4 for the experimental details.With this experimental study, our aim is to investigate the modification of the desorption profiles of CH3CH2OH and CH3CH2NH2 depending on the surface type on which they are deposited (gold, ASW and CI), and on the surface coverage (sub-monolayer, monolayer and multilayer). In order to compare these results with the theoretical ones, the desorption energy of the adsorbates was also derived from the TPD curves using software developed in-house.
In the figures of this section, for the sake of clarity, we only display the most abundant molecular ion for each species: m/z = 18 for water ([H2O]+), m/z = 31 for ethanol ([CH2OH]+), and m/z = 30 for ethylamine ([CH2NH2]+). Moreover, as no clear conclusion can be drawn from the infrared spectra produced during the experiments, except for the monolayer calibration (see Section 3.1.2), we chose not to display them in this paper.
3.2.1.1 On a gold substrate. Firstly, the behaviour of CH3CH2OH and CH3CH2NH2 on the bare gold surface was studied to assess the adsorbate/surface interactions, which will be compared with those established when the surface consists of water ice (described in the following subsections). The experiments were initially performed to calibrate the flux to use for each of the two adsorbates. Fig. 4 represents the TPD curves for the m/z = 31 ethanol fragment and the m/z = 30 ethylamine fragment, which desorb at different deposition times. To avoid any ambiguity, and since the deposition times account for the quantities deposited, they have been converted to monolayers (MLs).
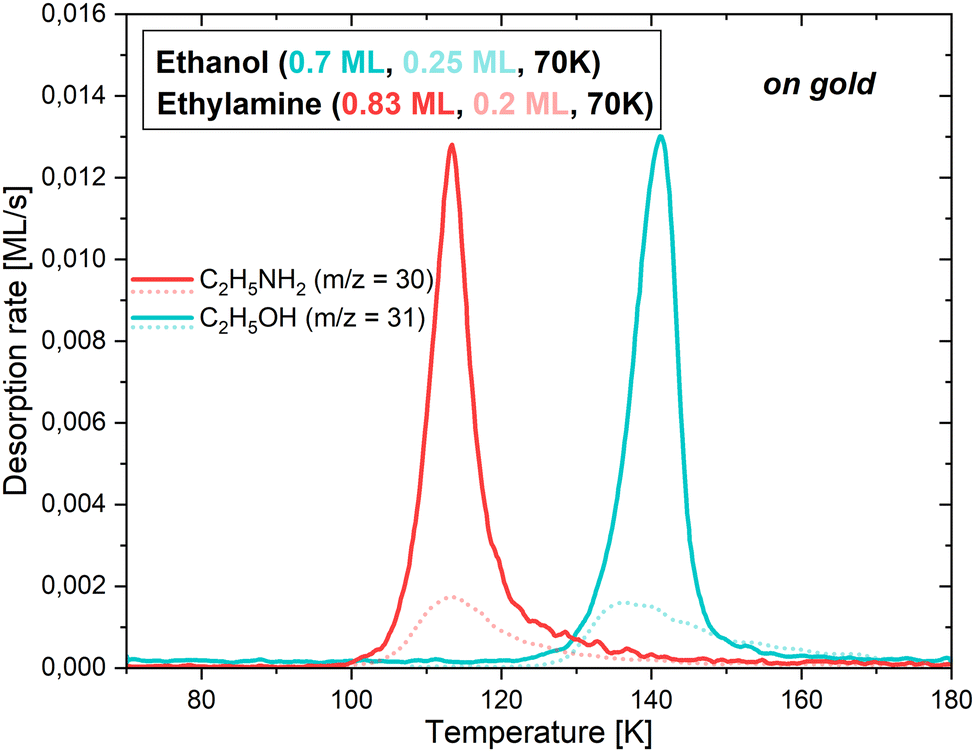 | ||
| Fig. 4 TPD curves for the deposition of 0.7 ML (solid blue line) and 0.25 ML (dotted blue line) of ethanol, and 0.83 ML (solid red line) and 0.2 ML (dotted red line) of ethylamine, on the gold substrate. The most abundant molecular ion is displayed for each molecule. | ||
While CH3CH2OH exhibits a noticeable site-filling behaviour, starting with the strongest binding sites, this is not the case for CH3CH2NH2. The start, end, and maximum of the desorption occurs at 122, 170 and 141 K for 0.7 ML of ethanol, and at 97, 160 and 113 K for 0.83 ML of ethylamine. In the case of the lowest coverages, represented by the dotted fainter lines, the start of the desorptions is slightly shifted towards higher temperatures. This is explained by the propensity of the adsorbates to attach to the most favourable binding sites, therefore needing more thermal energy to sublimate into the gas phase. As soon as more molecules are present on the surface, they occupy less favourable binding sites until all of them are used. This moment defines the monolayer, as additional molecules would directly stick to the first layer, and not to the bare gold. It is worth noting that the calibration curve pattern matches the time estimated for the monolayer completion in the previous section.
For these conditions, it is possible to extract the desorption energy of each of the adsorbates on the gold substrate, following the method outlined in Section 3.2.3.
3.2.1.2 On amorphous solid water. In the case of the sub-monolayer depositions of CH3CH2OH, namely 0.15, 0.25 and 0.7 ML, on a slab of 10 ML of ASW, the desorption curves and behaviours are all fairly comparable, as seen in the left panels of Fig. 5 and 6.
 | ||
| Fig. 5 TPD curves for the deposition of 0.15 ML of ethanol on 10 ML of ASW (top left) and of CI (top right), and 0.13 ML of ethylamine on 10 ML of ASW (bottom left) and of CI (bottom right). The most abundant molecular ion is displayed for each molecule. A logarithmic scale is used for better data readability, and grey vertical lines indicate the start of the water desorption and its crystallization. | ||
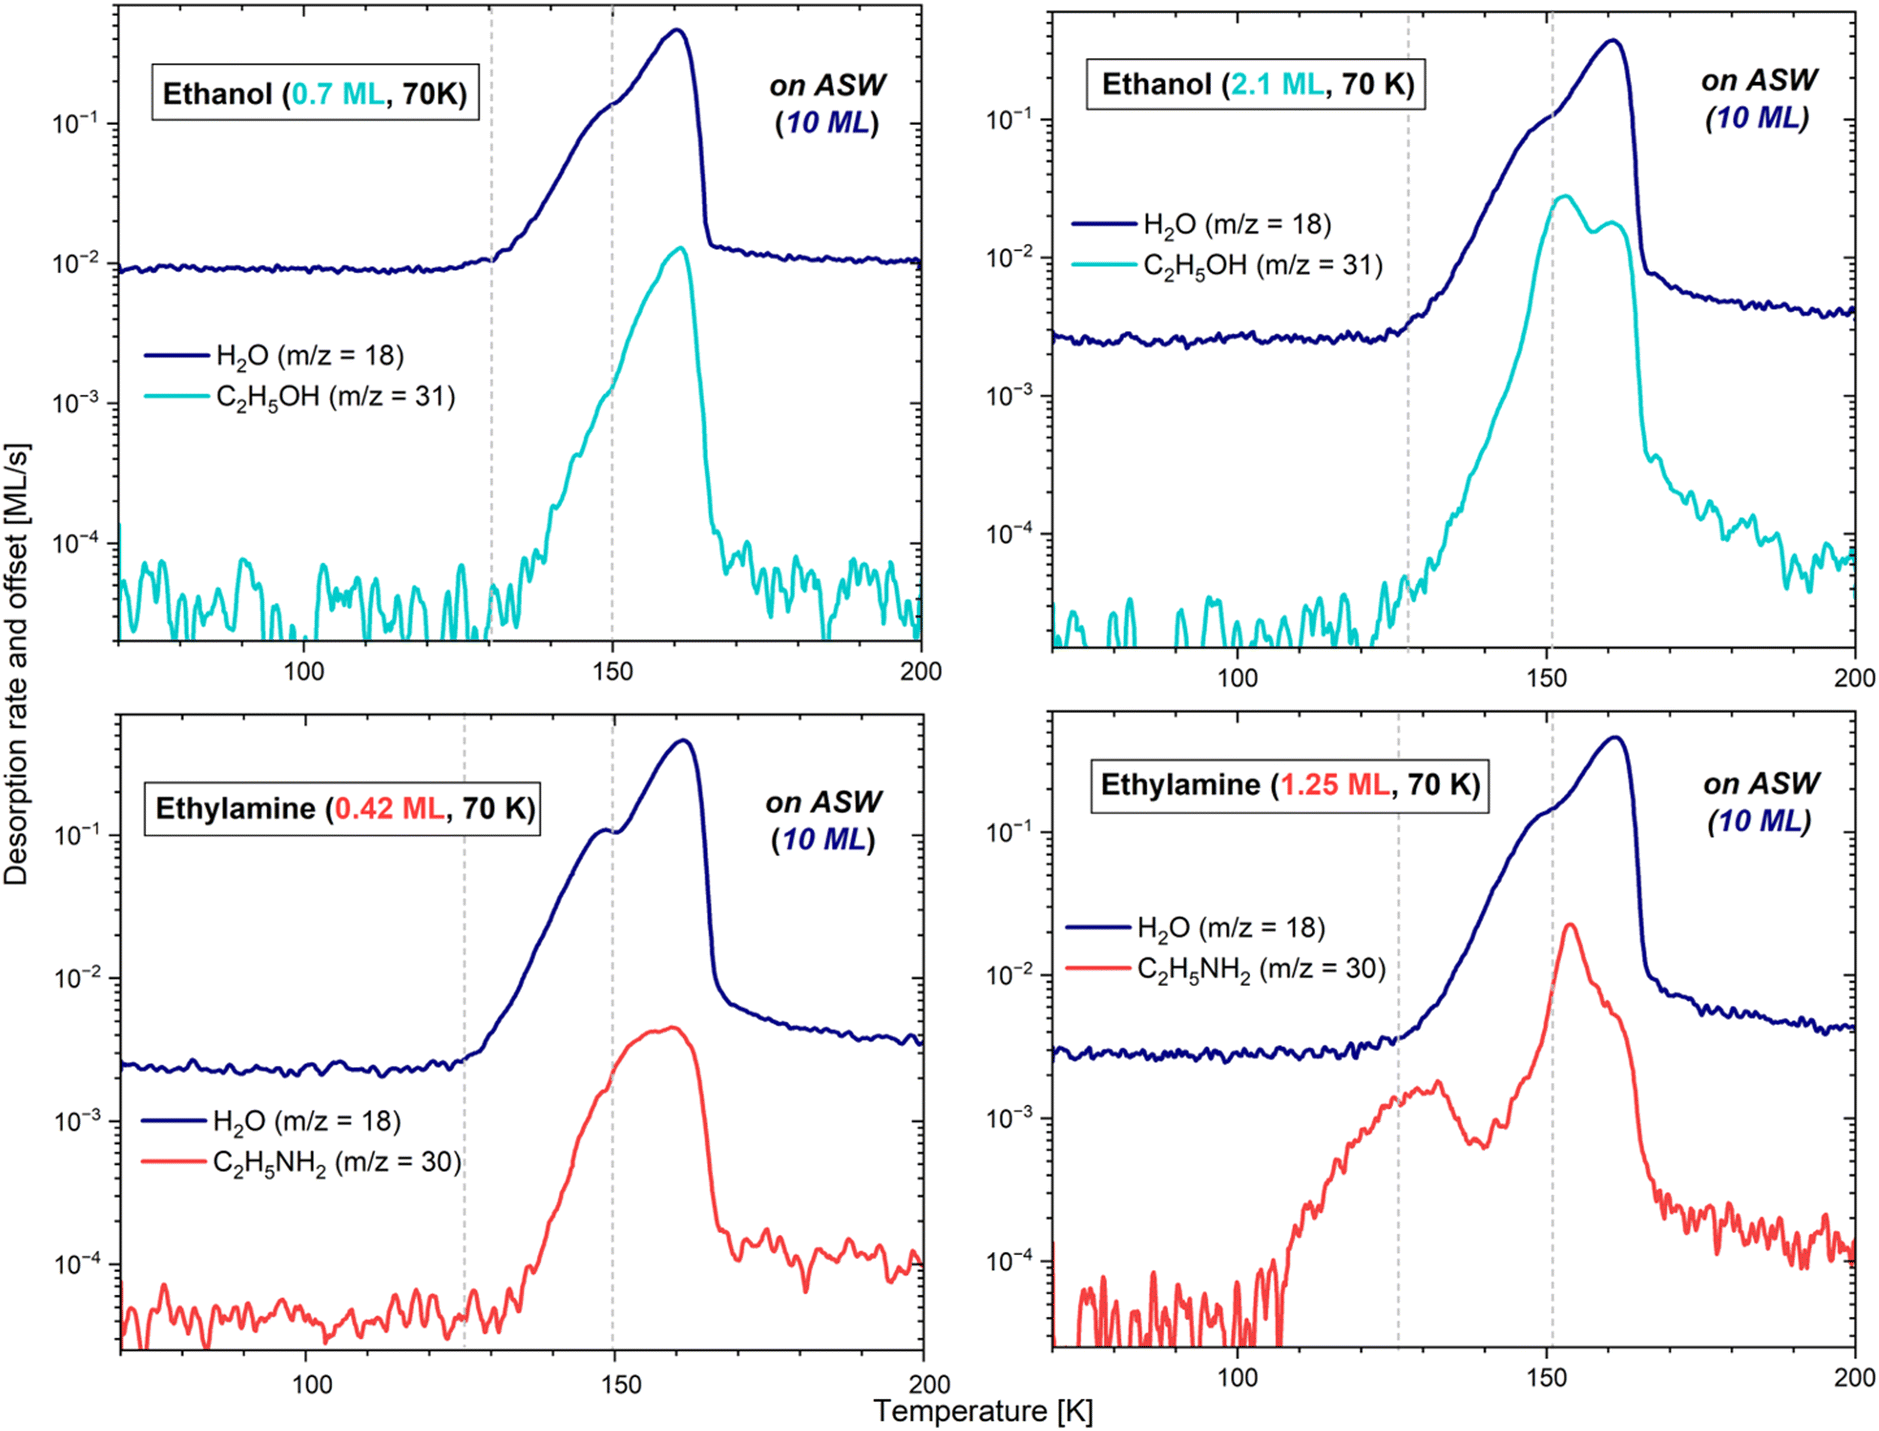 | ||
| Fig. 6 TPD curves for the deposition of 0.7 ML of ethanol (top left), 0.4 ML of ethylamine (bottom left), 2.1 ML of ethanol (top right) and 1.25 ML of ethylamine (bottom right) on 10 ML of ASW. The most abundant molecular ion is displayed for each molecule. A logarithmic scale is used for better data readability, and grey vertical lines indicate the start of the water desorption and its crystallization. | ||
The TPD profiles differ in their integrated area, the latter being proportional to the quantity of molecules deposited on the bulk of H2O. In the case of the 0.15 and 0.25 ML CH3CH2OH depositions, a common pattern is visible, with the adsorbate starting to desorb at 147 K and 144 K, respectively, along with the crystallization of water. On the other hand, with the 0.7 ML CH3CH2OH deposition, the adsorbate starts to desorb together with amorphous water already at ∼130 K. We note here that the quantity of water under the 0.25 ML deposition of ethanol was lower due to the use of a lower flux. The additional noise, visible on m/z = 18 and m/z = 31, is due to a poor following of the heating ramp after a change of the thermometer. This resulted in small recurrent surges of desorption, and in the partial crystallization of water before the expected temperature. However, this behaviour does not change the essence of the results. In all cases, the rest of the ethanol desorption follows the water pattern, with Tpeak slightly shifted by about 1–2 K after the maximum of water desorption, and the desorption of both molecules ending mutually. This suggests that CH3CH2OH stays bound to the water surface until the H2O molecules leave the surface completely. The moment ethanol starts desorbing can be explained by a stronger binding energy with ASW compared to CI in the case (see below) of the lowest coverages, leading CH3CH2OH to stay bound to water until it changes configuration by crystallizing. Please refer to Section 3.2.1.3 for further details about the crystallization processes.
The sub-monolayer depositions of CH3CH2NH2 (0.08, 0.13, and 0.4 ML) on the slab of 10 ML of ASW have common characteristics with the ethanol depositions. For instance, the ethylamine and H2O desorptions end mutually, and the integrated areas of the TPD profiles of ethylamine are also proportional to the surface coverage. However, the maximum of the desorption of CH3CH2NH2 is reached 1 K before that of water, except for the coverage of 0.08 ML, where both ethylamine and water show their maximum peak concomitantly. Additionally, in all cases, ethylamine starts desorbing before the crystallization of water at, respectively, 138, 140 and 132 K. Contrary to ethanol, it seems that CH3CH2NH2 binds with water in the same way, regardless of the configuration of the ice. The lowest temperature would here simply reflect the higher concentration of molecules, consequently desorbing earlier due to the unavailability of the most favourable binding sites.
However, the comparison of TPDs registered after short deposition times of both ethanol and ethylamine highlights that both molecules sublimate far later when adsorbed on water ice rather than when deposited on the gold surface, due to their more favourable and stronger interaction with the ASW ice.
3.2.1.3 On crystalline ice. The above interpretations of a stronger binding energy of the adsorbate with ASW than with CI, in the case of low coverage for ethanol, are demonstrated experimentally by depositing 0.15 ML of CH3CH2OH and 0.13 ML of CH3CH2NH2 on 10 ML of CI. The H2O ice was crystallized via the process described in Section 3.1.3, and the results are displayed in the right panels of Fig. 5.
In the case of ethylamine, the desorption curve is identical to that on ASW. The start, end, and maximum of the desorption occur at the same temperatures, and the integrated areas are equivalent, attesting that the deposition conditions are extremely similar, apart from the configuration of the H2O substrate. Thus, it seems that there is no influence of the ice structural state in the desorption energy of CH3CH2NH2 on water ice.
In the case of ethanol, however, the m/z = 31 signal differs fairly significantly whether deposited on ASW or on CI. On CI, although most of the sublimation into the gas phase takes place at the very end of the water desorption at Tpeak = 162 K (as expected from the results obtained on ASW), a small fraction of molecules starts desorbing before water, from ∼117 K to ∼145 K. This corresponds better to the temperature range observed in the case of a deposition exclusively on gold. The curve shape suggests that when H2O is completely crystalline, the ethanol molecules either bond slightly less (explaining their pre-desorption), or tend to agglomerate one onto each other, favouring a behaviour close to that of a multilayer regime. With any of the above solutions, the conclusion remains that in a sub-monolayer regime, ethanol has a different behaviour on ASW and on CI, further demonstrating its ejection from the surface during the phase change of water.
In both species, the shoulder monitored at higher temperature at the end of the H2O desorption, furthest to the right, is comparable to the results obtained from the sub-monolayer depositions. In other words, the molecules of ethanol and ethylamine that are directly in contact with the highest energy binding sites keep being bonded very strongly with water, even when the latter is desorbing. They are therefore sublimating together with the very last water molecules.
In the case of ethylamine, the first peak observable even before the start of the water desorption corresponds to a fraction of molecules that are not directly interacting with the bulk of H2O, but rather with the less strongly bonded multilayer. Indeed, these CH3CH2NH2 molecules start desorbing at 102 K, corresponding well to the behaviour exhibited when a multilayer regime is deposited solely on gold, with the addition of a slight water-binding contribution, explaining the signal persistence up to ∼150 K (visible if using an extrapolation). The interaction between layers of CH3CH2NH2 is thus weaker than that between the adsorbate and the ASW ice film. In the case of ethanol, in contrast, this first peak characteristic of a multilayer regime does not appear prior to the desorption of water, but is instead blended with the intermediate peak (described in the next paragraph). Indeed, on gold, multilayers of CH3CH2OH only start to desorb around 120 K. This temperature mingles with that of the start of water desorption, therefore making the multilayer contribution indistinguishable from the second peak, when the adsorbate is deposited on H2O.
Lastly, for both adsorbates, the largest contribution to the desorption peaks occurs at the moment of the H2O phase change. This would correspond to the ejection of ethanol and ethylamine from the surface when water is undergoing a morphological change. In a multilayer regime, both adsorbates consequently appear to bond more strongly with ASW than with CI.
However, obtaining Edes values is possible by using the sub-monolayer and monolayer depositions of CH3CH2OH and CH3CH2NH2 on the bare gold substrate (see above). The mathematical model, based on eqn (5) and developed by Chaabouni et al.,70 was employed to fit the experimental results. The code returns different populations (N) of molecules sublimating into the gas phase with a certain desorption energy (Edes), all together contributing to the final TPD curve. The best fit of the experimental data is obtained when the calculated curve matches well the experimental results, which is satisfied when the three parameters (ATST; Edes, N) are well constrained.
The pre-exponential factors needed to obtain the curves and the populations were calculated with an equation derived from transition state theory44 (further details can be found in the ESI†), yielding ATST = 3.31 × 10¹⁸ s−1 for ethanol, and ATST = 2.04 × 10¹⁸ s−1 for ethylamine.
The model returns Edes = 53.6 kJ mol−1 (6450 K) for CH3CH2OH and Edes = 41.6–43.2 kJ mol−1 (5000–5200 K) for CH3CH2NH2, as displayed in Fig. 7 (right panels), where the best fits of the simulated TPD (in red) match well the ones measured in the experiments (represented by the black dots). Each simulated curve is given by the combination of a number of TPDs, each corresponding to the different Edes obtained in the population graph (left panel of Fig. 7). For ethanol, we do not obtain an actual distribution, as more than 80% of the molecules are characterized by one main energy value. On the other hand, ethylamine shows a proper distribution with almost 70% of the population having Edes between 41.6–43.2 kJ mol−1 (5000–5200 K), followed by about 15% of the population with Edes between 44.9–46.6 kJ mol−1 (5400–5600 K) and the remaining population in which each Edes has a progressively smaller weight until reaching a negligible contribution.
 | ||
| Fig. 7 Comparison between the measured and reproduced TPD profiles and relative populations of 0.7 ML of CH3CH2OH adsorbed on gold (top panel, 8 TPDs) and 0.4 ML of CH3CH2NH2 adsorbed on gold (bottom panel, 10 TPDs), considering the calculated pre-exponential factor. | ||
4 Discussion
4.1 Pure CH3CH2OH and CH3CH2NH2 depositions
All the quantities computed in this work have been reported in Table 5. The desorption of CH3CH2OH and CH3CH2NH2 deposited on the bare gold surface resulted in a TPD with a Tpeak of 141 K and 113 K, respectively. From there, Edes = 53.6 kJ mol−1 for ethanol and Edes = 41.6–43.2 kJ mol−1 for ethylamine were derived, along with the respective pre-exponential factors ν. From a computational point of view, this scenario can be reproduced in two ways: (i) by modeling the bulk and the surfaces of EtOH and EtNH2 crystals; or (ii) by adsorbing CH3CH2OH and CH3CH2NH2 on the most stable EtOH and EtNH2 surfaces. The quantity that determines the strength of the interaction between the molecules forming the crystals is the cohesive energy EC of the bulk (−53.4 kJ mol−1 for EtOH and −44.0 kJ mol−1 for EtNH2) and of the most stable surfaces (−49.4 kJ mol−1 for EtOH and −40.4 kJ mol−1 for EtNH2). It should be noted that the negative values taken by EC are due to its definition, which is the opposite of that of the BE(0). Therefore, a more negative value indicates a more stable structure. We also simulated the adsorption of CH3CH2OH on the (010) EtOH surface, and CH3CH2NH2 on the (100) EtNH2 surface, to compute the relative binding energy, which resulted in a range covering similar values for the two species (20.9–41.8 kJ mol−1 for CH3CH2OH and 21.4–43.0 kJ mol−1 for CH3CH2NH2). Despite the similarity of the BE(0)s, the first calculations suggest that the interaction between organized ethanol molecules is stronger than that between ethylamine molecules. This is in agreement with the Edes of ethanol and ethylamine estimated experimentally. Remarkably, the EC of the bulk and of the most stable EtOH and EtNH2 surfaces seems to be the quantity that better describes what we observe in the experiment, supposing that small quantities of adsorbate, when deposited on the gold finger, or during the heating phase, could aggregate and order themselves into structures that resemble the order present in the crystal.| kJ mol−1 | Kelvin | |||||||
|---|---|---|---|---|---|---|---|---|
| CH3CH2OH | CH3CH2NH2 | CI | ASW | CH3CH2OH | CH3CH2NH2 | CI | ASW | |
| Bulk EC | −53.4 | −44.0 | −55.8 | −6423 | −5292 | −6711 | ||
| Surface EC | −49.4 to −40.3 | −40.4 to −30.3 | −49.5 | −44.9 | −5941 to −4847 | −4859 to −3644 | −5953 | −5400 |
| Surface EX | 58.9 to 116.6 | 36.0 to 84.3 | 7084 to 14024 | 4330 to 10139 | ||||
| BE(0) on (010) EtOH | 20.9/30.9/41.8 | 2514/3716/5027 | ||||||
| BE(0) on (100) EtNH2 | 21.4/21.6/43.0 | 2574/2598/5172 | ||||||
| BE(0) S-ADS on CI | 33.4/42.2/61.6 | 23.1/61.4 | 4017/5075/7409 | 2778/7385 | ||||
| BE(0) H-ML on CI | 66.0 | 64.5 | 7938 | 7758 | ||||
| BE(0) F-ML on CI | 50.0 | 49.5 | 6014 | 5953 | ||||
| BE(0) S-ADS on ASW | 26.0 to 59.1 | 19.1 to 71.7 | 3127 to 7108 | 2297 to 8624 | ||||
4.2 Sub-monolayer depositions
The experiments performed in this work cannot provide an experimental measurement of the Edes of CH3CH2OH and CH3CH2NH2 adsorbed on water ice. This is because the interpretation of the TPD profiles is hindered by the presence of co-desorption phenomena, and occasionally the emergence of multiple desorption peaks. This occurred as well in previous experimental studies (e.g., Lattelais et al.40) investigating the desorption of ethanol from water ice. For this reason, Burke et al.71 classified ethanol as a complex water-like molecule, in that it wets the ice surface and co-desorbs with water (which moreover affects the water crystallization process), like methanol, acetic acid, and other iCOMs. Minissale et al.34 also mentioned that the species capable of establishing several H-bonds with water are likely to be strongly bound with the ice and behave like ethanol, thereby making impracticable the determination of their Edes values from a TPD experiment. From our calculations, this phenomenon can be explained by the presence of BE(0) values of CH3CH2OH and CH3CH2NH2 that are responsible for an interaction between the adsorbate and water that is stronger than the cohesive energy of water ice (−55.8 kJ mol−1 in the case of CI bulk, and slightly inferior for ASW and CI surfaces).Moreover, the experiments show that CH3CH2NH2 binds with ASW and CI with similar strength, regardless of their different structural states. On the contrary, CH3CH2OH seems to have stronger binding energies with ASW compared to CI in the case of low coverages (0.15 and 0.25 ML). This aspect does not clearly emerge from the calculations, because the differences in the BE(0) ensembles of ASW and CI are limited. While the BE(0) values computed for ethylamine cover almost the same range for ASW (19.1–71.7 kJ mol−1) and CI (23.1/61.4 kJ mol−1), ethanol can experience lower BE(0)s on ASW (26.0–59.1 kJ mol−1) rather than on CI (33.4/42.2/61.6 kJ mol−1), thus in disagreement with the experimental data.
Additionally, an aspect that must be considered in the comparison of experimental and theoretical results is that, in a sub-monolayer deposition TPD experiment, constant thermal energy is provided to the molecules, which is used to diffuse and move toward stronger binding sites, where the system is more stable, this way neglecting the least favourable binding sites. Moreover, the experiments measure desorption energies, accounting for desorption effects that cannot be reproduced in the calculations. Therefore, the Edes values provided by the experiments do not usually cover the lower limit of the BE(0) distribution obtained with calculations.
In this sense, quantum chemical calculations offer the possibility to compute the quantities that cannot be determined experimentally. Despite their structural similarity, CH3CH2OH and CH3CH2NH2 show differences in their chemical behaviour, due to the H-bond capabilities of the OH and NH2 groups. NH2 is a stronger H-bond acceptor than OH, but it is a weaker H-bond donor. This results in CH3CH2NH2 spanning a larger BE(0) range than CH3CH2OH when adsorbed on the ASW model (19.1–71.7 kJ mol−1vs. 26.0–59.1 kJ mol−1, respectively) since the strength of the interaction depends on the atom establishing the H-bond with the binding site of the ice. Such a difference can also partially be observed with the CI model, where the lowest BE(0), due to H-bond donation from the adsorbate to the surface, is 23.1 kJ mol−1 for ethylamine and 33.4 kJ mol−1 for ethanol. The values obtained for the CI can represent in part the BE ensemble obtained on the ASW, although two or three values are not sufficient to account for the diversity of binding sites available on the amorphous model.
The BE(0) values obtained for CH3CH2OH and CH3CH2NH2 on CI and ASW mostly agree with those proposed in the literature. Garrod39 suggested BE = 65.5 kJ mol−1 for CH3CH2NH2 and BE = 52.0 kJ mol−1 for CH3CH2OH, highlighting the stronger interaction of ethylamine, compared to ethanol, with the ice. To the best of our knowledge, no other BEs have been documented for CH3CH2NH2 on water ice. At variance, ethanol has been the object of a number of investigations. Lattelais et al.40 computed the adsorption of ethanol onto the same crystalline proton-ordered ice model of this work, using the PW91 functional in combination with plane waves, with the VASP code, obtaining BE = 56.5 kJ mol−1, close to the value of Garrod.39 Due to the use of plane waves, the BE computed by Lattelais et al.40 does not suffer from the BSSE. However, at variance with our calculations, both the ZPE and the dispersion corrections are lacking, probably explaining the discrepancy with the value computed in this work for the same adsorption complex (BE(0) = 61.6 kJ mol−1). On the contrary, the values provided by Etim et al.,41 in which ethanol is interacting with only one water molecule, range from 37.4 to 40.7 kJ mol−1, which lie within the intermediate range of our BE(0) ensemble. Clearly, the latter estimate cannot reproduce the largest BE(0)s, due to the impossibility of capturing the essence of the interaction between CH3CH2OH and water ice when approximating its structure with only one water molecule. The choice of the ice model appears to be crucial, especially when the adsorbate is large enough to interact with more than one water molecule. Thus, the values proposed in this work represent an extension of those already available in the literature, additionally describing a tail of weaker BE(0) values that can only be simulated when using extended amorphous ice models characterized by a rich structural variability.
The simulation of the H-ML and F-ML scenarios by adsorbing a larger number of molecules on the surface yields slightly larger and lower BE(0)s compared to the S-ADS case, respectively. In the calculations, we directly modeled the adsorption of a layer of molecules, which results in the determination of a single BE(0) value for all the species adsorbed. This does not faithfully represent what happens in the experiment, where the species approach the surface in different moments and start occupying binding sites starting from the strongest and then to the weakest, resulting in a distribution of BEs. However, the BE(0)s obtained from the simulation of different surface coverages represents a useful alternative to understand the variation in the BE(0) values resulting from the occupation of an increasing number of surface binding sites.
4.3 Multilayer depositions
The deposition of 1.25 ML of CH3CH2NH2 on ASW results in multiple desorption peaks, in which the desorption of the adsorbate alone can be discerned from its co-desorption with water. The first desorption peak (starting at 102 K, before water desorption) corresponds to ethylamine molecules that are not in direct contact with the water surface. The interaction between layers of CH3CH2NH2 is thus weaker than that between CH3CH2NH2 and the ASW film. However, in the TPD of 2.1 ML of CH3CH2OH on ASW, the peak corresponding to the multilayer desorption is blended with that caused by the desorption of the ethanol in direct contact with water ice due to crystallization of the latter. This causes the two types of desorption to be indistinguishable. Such a discrepancy between CH3CH2NH2 and CH3CH2OH can be justified by comparing, once again, the EC of the species under investigation. The computed cohesive energies of ASW and CI surfaces (−49.5 and −44.9 kJ mol−1, respectively) are comparable with those of ethanol surfaces (between −49.4 and −40.3 kJ mol−1), but larger than those of ethylamine surfaces (between −40.4 and −30.3 kJ mol−1). Based on these numbers, we can assume that even in the presence of larger quantities of ethanol on the water ice surface, both ethanol and water likely desorb in the same temperature range: the multilayer desorption is regulated by the cohesive energy, while the desorption of those ethanol molecules in direct contact with water is determined by the BE(0) of CH3CH2OH on ASW.4.4 Astrophysical implications
The experiments performed in this work reveal that ethanol and, in part, ethylamine co-desorb with water ice. Computational data confirm and complement the experimental results, providing an ensemble of BE(0)s accounting for the upper and lower limits. Usually, the weakest interactions between the adsorbate and the surface cannot be measured by TPD experiments, but need to be considered when determining the regions of the ISM in which a species is available in the gas phase, rather than segregated on the ice grains. Despite this, the presence of ethanol, as well as other iCOMs in general, in the cold (<20 K) outskirts of prestellar cores requires non-thermal desorption processes to be explained.In contrast, ethylamine has only been tentatively detected towards the Galactic center cloud G+0.693-0.027,9 raising doubts regarding its absence elsewhere. This work suggests that both CH3CH2OH and CH3CH2NH2 should be found in warm regions, like hot cores and hot corinos, where the ice mantles sublimate due to the presence of a warm central object.
The Edes of the species on water ice mantles have a profound impact on the chemical composition of the regions where planetary systems eventually form. A very important case is represented by the gaseous-versus-solid chemical composition of protoplanetary disks. If a species is in the solid form, it will likely be incorporated in rocky planets, asteroids and comets, whereas, if it resides in the gas phase, it will only enrich the giant gaseous planets. The transition of a species from the gas phase to the solid phase (when moving away from the central object) is identified by its snow-line.72
If we compare the BE(0) ranges spanned by ethanol (26.0–59.1 kJ mol−1), ethylamine (19.1–71.7 kJ mol−1) and water (14.2–61.6 kJ mol−1, peaking at 35.2 kJ mol−1),73 we can have clues on the composition of the icy mantles on the protoplanetary disks, dictating whether a species is incorporated in water-rich planetesimals or not. By looking at the maximum BE(0) values of CH3CH2OH and CH3CH2NH2, we can infer that at least a fraction of these species will remain on the grains in regions where up to 96% of water has completely sublimated (corresponding to BE(0) ≃ 54.0 kJ mol−1). Ethanol and ethylamine could therefore be incorporated in the planetesimals that will form rocky bodies.
Theoretical calculations indicate that the BE(0) ensembles of CH3CH2OH and CH3CH2NH2 on water ice span similar ranges. Accordingly, if ethanol is detected in the ice,19 ethylamine should also be detected. However, this is not the case. Thus, the reason behind the presence of ethanol and the absence of ethylamine in ISM regions points towards their synthetic pathways. As mentioned in Section 1, ethanol synthesis on water ices has been proposed via reactivity between CCH and H2O followed by hydrogenation.31 The analogue reaction for ethylamine would be thus initiated by CCH + NH3. However, ammonia is much less abundant than water, causing a meager production of CH3CH2NH2. Hydrogenation of icy acetaldehyde (CH3 CHO), which can form by the HCO + CH3 radical–radical coupling on water ice,74 is an alternative route towards ethanol formation. The analogue pathway for ethylamine is the hydrogenation of acetonitrile (CH3CN), which can form previously through HCN + CH3 or CN + CH3 reactions. However, HCN is chemically inert in cold environments,75 while the likelihood of CH3 CN undergoing hydrogenation is doubtful, due to the intrinsic stability (and consequent inertness) of nitriles.76 Moreover, detection of CH3 CN in ices still remains elusive.19 Additionally, at variance with ethanol, ethylamine could form salts due to the basicity of the amino moiety. In general, O-bearing species are more abundant than N-bearing species, a fact directly linked to the cosmic abundances of oxygen and nitrogen,77–79 although such a discrepancy cannot fully account for the differences in the detection of these two iCOMs, especially considering the extremely articulated network of chemical reactions taking place in the ISM.
5 Conclusions
In this work, the interaction of CH3CH2OH and CH3CH2NH2 on water ice has been studied by means of a computational (periodic DFT simulations) and an experimental (TPD measurements) approach.First, Edes values for pure CH3CH2OH and CH3CH2NH2 deposited on a gold surface were determined experimentally, which closely align with the cohesive energies of crystalline bulks of EtOH and EtNH2, along with their most stable surfaces.
The Edes values for submonolayer coverages of CH3CH2OH and CH3CH2NH2 deposited on crystalline and amorphous water ice surfaces cannot be determined experimentally due to the complexity of their desorption profiles, where multiple desorption peaks are occasionally present, in addition to the co-desorption of the adsorbate with water. Theoretical calculations fill this gap by providing a comprehensive set of BE(0) values for CH3CH2OH and CH3CH2NH2 on both crystalline and amorphous surface ice models. Notably, these calculations reveal weak binding sites that are elusive in traditional TPD experiments. Nevertheless, the TPD of a submonolayer deposition of ethanol on crystalline ice reveals a very small fraction of molecules desorbing from the surface prior to its crystallization, indicating a weaker interaction of ethanol with crystalline ice compared to the amorphous one. The deposition of a multilayer of adsorbate can provide additional information, due to the occupation of all the binding sites available on the water surface and the formation of multiple layers of adsorbate, avoiding a direct interaction with the water ice. The temperature at which the first ethylamine molecules of the multilayer desorb is higher than that of pure ethylamine, owing to the presence of the water ice surface. After desorption of the multilayer, the TPD profile resembles that of a submonolayer deposition. Conversely, for ethanol, it is not possible to distinguish the two behaviours as the corresponding peaks are overlapping. The theoretical results corroborate these findings, in that the cohesive energy of the bulk and surfaces of crystalline EtNH2 is smaller compared to that of EtOH, which in turn is comparable with that of crystalline and amorphous water ice. This disparity explains why ethylamine multilayers desorb before water, while ethanol multilayers do not.
The desorption energies of CH3CH2OH and CH3CH2NH2 play a critical role in determining their presence in the gas or in the solid phase of the ISM, thus influencing the chemical composition of celestial bodies formed from protoplanetary disks, as delineated by snow-lines. The high BE(0) values of ethanol rationalize its presence in interstellar ices. However, the non-detection of ethylamine cannot be explained by its BE(0) values, and likely stems from the lack of favourable reaction pathways responsible for its formation. Nevertheless, the scarcity of gas-phase CH3CH2NH2 in the ISM and the presence of CH3CH2OH in the gas phase of cold objects, the latter usually elucidated by invoking non-thermal desorption mechanisms, need further investigation.
This work exemplifies the way in which computational chemistry can not only support laboratory experiments, but the two disciplines can complement each other in order to provide reference data as the input for astrochemical models.80
Data availability
Computational models available at https://zenodo.org/records/11103454.Author contributions
Conceptualization: J. P., J. V., A. R., and F. D.; experiments: J. P., J. V., and E. C.; data curation: J. P., J. V., A. R., and F. D.; formal analysis: J. P., J. V., A. R., P. U., and F. D.; funding acquisition: F. D.; investigation: J. P., J. V., A. R., P. U., and F. D.; methodology: J. P., J. V., A. R., and F. D.; validation: A. R., P. U., E. C. and F. D.; writing – original draft: J. P., and J. V.Conflicts of interest
There are no conflicts to declare.Acknowledgements
This project has received funding within the European Union's Horizon 2020 research and innovation programme from the European Research Council (ERC) for the project “Quantum Chemistry on Interstellar Grains” (QUANTUMGRAIN), grant agreement No. 865657. This research is also funded by the Spanish MICINN (projects PID2021-126427NB-I00 and CNS2023-144902). The Italian Space Agency for co-funding the Life in Space Project (ASI N. 2019-3-U.O), the Italian MUR (PRIN 2020, Astrochemistry beyond the second period elements, Prot. 2020AFB3FX) are also acknowledged for financial support. Authors (J. P. and P. U.) acknowledge support from the Project CH4.0 under the MUR program “Dipartimenti di Eccellenza 2023–2027” (CUP: D13C22003520001). This work was also funded by CY Initiative of Excellence (grant “Investissements d'Avenir” ANR-16-IDEX-0008), Agence Nationale de la recherche (ANR) SIRC project (Grant ANR-SPV202448 2020–2024), by the Programme National “Planétologie” and “Physique et Chimie du Milieu Interstellaire” (PCMI) of CNRS/INSU with INC/INP co-funded by CEA and CNES. The RES resources provided by BSC in MareNostrum to activities QHS-2022-3-0007 and QHS-2023-2-0011, and the supercomputational facilities provided by CSUC and CINECA (ISCRAB projects) are also acknowledged. The EuroHPC Joint Undertaking through the Regular Access call project no. 2023R01-112, hosted by the Ministry of Education, Youth and Sports of the Czech Republic through the e-INFRA CZ (ID: 90254) is also acknowledged. J. P. and J. V. wish to thank Michel Lorin and Emilie Schmitter for their significant contribution in performing the experiments.Notes and references
- E. Herbst and E. F. van Dishoeck, Annu. Rev. Astron. Astrophys., 2009, 47, 427–480 CrossRef CAS.
- E. Herbst, Int. Rev. Phys. Chem., 2017, 36, 287–331 Search PubMed.
- C. Ceccarelli, P. Caselli, F. Fontani, R. Neri, A. López-Sepulcre, C. Codella, S. Feng, I. Jiménez-Serra, B. Lefloch, J. E. Pineda, C. Vastel, F. Alves, R. Bachiller, N. Balucani, E. Bianchi, L. Bizzocchi, S. Bottinelli, E. Caux, A. Chacón-Tanarro, R. Choudhury, A. Coutens, F. Dulieu, C. Favre, P. Hily-Blant, J. Holdship, C. Kahane, A. J. Al-Edhari, J. Laas, J. Ospina, Y. Oya, L. Podio, A. Pon, A. Punanova, D. Quenard, A. Rimola, N. Sakai, I. R. Sims, S. Spezzano, V. Taquet, L. Testi, P. Theulé, P. Ugliengo, A. I. Vasyunin, S. Viti, L. Wiesenfeld and S. Yamamoto, Astrophys. J., 2017, 850, 176 CrossRef.
- P. Caselli and C. Ceccarelli, Astron. Astrophys. Rev., 2012, 20, 56 CrossRef.
- M. Förstel, A. Bergantini, P. Maksyutenko, S. Góbi and R. I. Kaiser, Astrophys. J., 2017, 845, 83 CrossRef.
- R. L. Hudson, Y. Y. Yarnall and P. A. Gerakines, Astrobiology, 2022, 22, 452–461 CrossRef CAS PubMed.
- F. Goesmann, H. Rosenbauer, J. H. Bredehöft, M. Cabane, P. Ehrenfreund, T. Gautier, C. Giri, H. Krüger, L. L. Roy, A. J. MacDermott, S. McKenna-Lawlor, U. J. Meierhenrich, G. M. M. Caro, F. Raulin, R. Roll, A. Steele, H. Steininger, R. Sternberg, C. Szopa, W. Thiemann and S. Ulamec, Science, 2015, 349, aab0689 CrossRef PubMed.
- D. P. Glavin, J. P. Dworkin and S. A. Sandford, Meteorit. Planet. Sci., 2008, 43, 399–413 CrossRef CAS.
- S. Zeng, I. Jiménez-Serra, V. M. Rivilla, J. Martn-Pintado, L. F. Rodrguez-Almeida, B. Tercero, P. de Vicente, F. Rico-Villas, L. Colzi, S. Martn and M. A. Requena-Torres, Astrophys. J., Lett., 2021, 920, L27 CrossRef CAS.
- K. Altwegg, H. Balsiger and S. A. Fuselier, Annu. Rev. Astron. Astrophys., 2019, 57, 113–155 CrossRef CAS.
- N. Biver, D. Bockelée-Morvan, R. Moreno, J. Crovisier, P. Colom, D. C. Lis, A. Sandqvist, J. Boissier, D. Despois and S. N. Milam, Sci. Adv., 2015, 1, e1500863 CrossRef PubMed.
- J. Crovisier, D. Bockelée-Morvan, P. Colom, N. Biver, D. Despois, D. C. Lis and the Team for target-of-opportunity radio observations of comets, Astron. Astrophys., 2004, 418, 1141–1157 CrossRef CAS.
- B. Zuckerman, B. E. Turner, D. R. Johnson, F. O. Clark, F. J. Lovas, N. Fourikis, P. Palmer, M. Morris, A. E. Lilley, J. A. Ball, C. A. Gottlieb, M. M. Litvak and H. Penfield, Astrophys. J., Lett., 1975, 196, L99–L102 CrossRef CAS.
- M. Ohishi, S. Yamamoto, S. Saito, K. Kawaguchi, H. Suzuki, N. Kaifu, S.-I. Ishikawa, S. Takano, T. Tsuji and W. Unno, Astrophys. J., 1988, 329, 511 CrossRef CAS.
- J. C. Pearson, K. V. L. N. Sastry, E. Herbst and F. C. D. Lucia, Astrophys. J., 1997, 480, 420 CrossRef CAS.
- E. Bianchi, C. Codella, C. Ceccarelli, F. Vazart, R. Bachiller, N. Balucani, M. Bouvier, M. De Simone, J. Enrique-Romero, C. Kahane, B. Lefloch, A. López-Sepulcre, J. Ospina-Zamudio, L. Podio and V. Taquet, Mon. Not. R. Astron. Soc., 2019, 483, 1850–1861 CrossRef CAS.
- M. Agúndez, N. Marcelino, J. Cernicharo, E. Roueff and M. Tafalla, Astron. Astrophys., 2019, 625, A147 CrossRef PubMed.
- M. Agúndez, J. C. Loison, K. M. Hickson, V. Wakelam, R. Fuentetaja, C. Cabezas, N. Marcelino, B. Tercero, P. de Vicente and J. Cernicharo, Astron. Astrophys., 2023, 673, A34 CrossRef.
- M. K. McClure, W. Rocha, K. Pontoppidan, N. Crouzet, L. E. Chu, E. Dartois, T. Lamberts, J. Noble, Y. Pendleton and G. Perotti, et al. , Nat. Astron., 2023, 7, 431–443 CrossRef.
- W. R. M. Rocha, E. F. van Dishoeck, M. E. Ressler, M. L. van Gelder, K. Slavicinska, N. G. C. Brunken, H. Linnartz, T. P. Ray, H. Beuther, A. Caratti o Garatti, V. Geers, P. J. Kavanagh, P. D. Klaassen, K. Justtanont, Y. Chen, L. Francis, C. Gieser, G. Perotti,. Tychoniec, M. Barsony, L. Majumdar, V. J. M. le Gouellec, L. E. U. Chu, B. W. P. Lew, T. Henning and G. Wright, Astron. Astrophys., 2024, 683, A124 CrossRef CAS.
- B. Lefloch, C. Ceccarelli, C. Codella, C. Favre, L. Podio, C. Vastel, S. Viti and R. Bachiller, Mon. Not. R. Astron. Soc.: Lett., 2017, 469, L73–L77 CrossRef CAS.
- D. Skouteris, N. Balucani, C. Ceccarelli, F. Vazart, C. Puzzarini, V. Barone, C. Codella and B. Lefloch, Astrophys. J., 2018, 854, 135 CrossRef.
- H. Carrascosa, C. González Daz, G. M. Muñoz Caro, P. C. Gómez and M. L. Sanz, European Planetary Science Congress, 2021, pp. EPSC2021-51.
- T. C. Keane, Origins Life Evol. Biospheres, 2017, 47, 223–248 CrossRef CAS PubMed.
- R. L. Hudson and M. J. Loeffler, Astrophys. J., 2013, 773, 109 CrossRef.
- C. Robert Wu, D. Judge, B.-M. Cheng, W.-H. Shih, T.-S. Yih and W. Ip, Icarus, 2002, 156, 456–473 CrossRef.
- K.-J. Chuang, G. Fedoseev, C. Scirè, G. A. Baratta, C. Jäger, T. Henning, H. Linnartz and M. E. Palumbo, Astron. Astrophys., 2021, 650, A85 CrossRef CAS.
- J. B. Bergner, K. I. Öberg and M. Rajappan, Astrophys. J., 2019, 874, 115 CrossRef CAS.
- K.-J. Chuang, G. Fedoseev, D. Qasim, S. Ioppolo, C. Jäger, T. Henning, M. E. Palumbo, E. F. van Dishoeck and H. Linnartz, Astron. Astrophys., 2020, 635, A199 CrossRef CAS.
- J. Enrique-Romero, A. Rimola, C. Ceccarelli, P. Ugliengo, N. Balucani and D. Skouteris, Astrophys. J., Suppl. Ser., 2022, 259, 39 CrossRef CAS.
- J. Perrero, J. Enrique-Romero, B. Martnez-Bachs, C. Ceccarelli, N. Balucani, P. Ugliengo and A. Rimola, ACS Earth Space Chem., 2022, 6, 496–511 CrossRef CAS PubMed.
- S. Ferrero, C. Ceccarelli, P. Ugliengo, M. Sodupe and A. Rimola, Astrophys. J., 2023, 951, 150 CrossRef.
- S. Ferrero, C. Ceccarelli, P. Ugliengo, M. Sodupe and A. Rimola, Astrophys. J., 2024, 960, 22 CrossRef.
- M. Minissale, Y. Aikawa, E. Bergin, M. Bertin, W. A. Brown, S. Cazaux, S. B. Charnley, A. Coutens, H. M. Cuppen, V. Guzman, H. Linnartz, M. R. S. McCoustra, A. Rimola, J. G. Schrauwen, C. Toubin, P. Ugliengo, N. Watanabe, V. Wakelam and F. Dulieu, ACS Earth Space Chem., 2022, 6, 597–630 CrossRef CAS.
- L. J. Karssemeijer and H. M. Cuppen, Astron. Astrophys., 2014, 569, A107 CrossRef.
- H. M. Cuppen, C. Walsh, T. Lamberts, D. Semenov, R. T. Garrod, E. M. Penteado and S. Ioppolo, Space Sci. Rev., 2017, 212, 1–58 CrossRef.
- A. Kouchi, K. Furuya, T. Hama, T. Chigai, T. Kozasa and N. Watanabe, Astrophys. J., Lett., 2020, 891, L22 CrossRef CAS.
- B. Maté, S. Cazaux, M. Á. Satorre, G. Molpeceres, J. Ortigoso, C. Millán and C. Santonja, Astron. Astrophys., 2020, 643, A163 CrossRef.
- R. T. Garrod, Astrophys. J., 2013, 765, 60 CrossRef.
- M. Lattelais, M. Bertin, H. Mokrane, C. Romanzin, X. Michaut, P. Jeseck, J.-H. Fillion, H. Chaabouni, E. Congiu, F. Dulieu, S. Baouche, J.-L. Lemaire, F. Pauzat, J. Pilmé, C. Minot and Y. Ellinger, Astron. Astrophys., 2011, 532, A12 CrossRef.
- E. E. Etim, P. Gorai, A. Das, S. K. Chakrabarti and E. Arunan, Adv. Space Res., 2018, 61, 2870–2880 CrossRef CAS.
- V. Wakelam, J.-C. Loison, R. Mereau and M. Ruaud, Mol. Astrophys., 2017, 6, 22–35 CrossRef.
- T. I. Hasegawa and E. Herbst, Mon. Not. R. Astron. Soc., 1993, 263, 589–606 CrossRef CAS.
- S. L. Tait, Z. Dohnálek, C. T. Campbell and B. D. Kay, J. Chem. Phys., 2005, 122, 164708 CrossRef PubMed.
- R. Dovesi, A. Erba, R. Orlando, C. M. Zicovich-Wilson, B. Civalleri, L. Maschio, M. Rérat, S. Casassa, J. Baima, S. Salustro and B. Kirtman, Wiley Interdiscip. Rev.: Comput. Mol. Sci., 2018, 8, e1360 Search PubMed.
- H. Tatewaki and S. Huzinaga, J. Comput. Chem., 1980, 1, 205–228 CrossRef CAS.
- R. Sure and S. Grimme, J. Comput. Chem., 2013, 34, 1672–1685 CrossRef CAS PubMed.
- S. Grimme, J. Antony, S. Ehrlich and H. Krieg, J. Chem. Phys., 2010, 132, 154104 CrossRef PubMed.
- S. Grimme, S. Ehrlich and L. Goerigk, J. Comput. Chem., 2011, 32, 1456–1465 CrossRef CAS PubMed.
- J. G. Brandenburg, M. Alessio, B. Civalleri, M. F. Peintinger, T. Bredow and S. Grimme, J. Phys. Chem. A, 2013, 117, 9282–9292 CrossRef CAS PubMed.
- H. Kruse and S. Grimme, J. Chem. Phys., 2012, 136, 154101 CrossRef PubMed.
- A. D. Becke, Phys. Rev. A: At., Mol., Opt. Phys., 1988, 38, 3098–3100 CrossRef CAS PubMed.
- A. D. Becke, J. Chem. Phys., 1993, 98, 5648–5652 CrossRef CAS.
- C. Lee, W. Yang and R. G. Parr, Phys. Rev. B: Condens. Matter Mater. Phys., 1988, 37, 785–789 CrossRef CAS PubMed.
- S. Ferrero, L. Zamirri, C. Ceccarelli, A. Witzel, A. Rimola and P. Ugliengo, Astrophys. J., 2020, 904, 11 CrossRef CAS.
- J. Perrero, J. Enrique-Romero, S. Ferrero, C. Ceccarelli, L. Podio, C. Codella, A. Rimola and P. Ugliengo, Astrophys. J., 2022, 938, 158 CrossRef.
- A. Schäfer, H. Horn and R. Ahlrichs, J. Chem. Phys., 1992, 97, 2571–2577 CrossRef.
- S. Casassa, P. Ugliengo and C. Pisani, J. Chem. Phys., 1997, 106, 8030–8040 CrossRef CAS.
- A. C. A. Boogert, P. A. Gerakines and D. C. B. Whittet, Annu. Rev. Astron. Astrophys., 2015, 53, 541–581 CrossRef CAS.
- P. G. Jönsson, Acta Crystallogr., Sect. B: Struct. Crystallogr. Cryst. Chem., 1976, 32, 232–235 CrossRef.
- A. G. P. Maloney, P. A. Wood and S. Parsons, CrystEngComm, 2014, 16, 3867–3882 RSC.
- M. Corno and P. Ugliengo, in Surface Modeling of Ceramic Biomaterials, ed. B. Bhushan, Springer, Netherlands, Dordrecht, 2014, pp. 1–13 Search PubMed.
- E. Congiu, A. Sow, T. Nguyen, S. Baouche and F. Dulieu, Rev. Sci. Instrum., 2020, 91, 124504 CrossRef CAS PubMed.
- R. L. Hudson, Spectrochim. Acta, Part A, 2017, 187, 82–86 CrossRef CAS PubMed.
- G. Danger, J.-B. Bossa, P. De Marcellus, F. Borget, F. Duvernay, P. Theulé, T. Chiavassa and L. d’Hendecourt, Astron. Astrophys., 2011, 525, A30 CrossRef.
- P. D. Holtom, C. J. Bennett, Y. Osamura, N. J. Mason and R. I. Kaiser, Astrophys. J., 2005, 626, 940 CrossRef CAS.
- J. A. Noble, F. Dulieu, E. Congiu and H. J. Fraser, Astrophys. J., 2011, 735, 121 CrossRef.
- K. Altwegg, H. Balsiger, A. Bar-Nun, J.-J. Berthelier, A. Bieler, P. Bochsler, C. Briois, U. Calmonte, M. R. Combi and H. Cottin, et al. , Sci. Adv., 2016, 2, e1600285 CrossRef PubMed.
- R. Singh, M. Kumar and S. Pal, J. Electron Spectrosc. Relat. Phenom., 2018, 226, 22–25 CrossRef CAS.
- H. Chaabouni, S. Diana, T. Nguyen and F. Dulieu, Astron. Astrophys., 2018, 612, A47 CrossRef.
- D. J. Burke, F. Puletti, P. M. Woods, S. Viti, B. Slater and W. A. Brown, J. Chem. Phys., 2015, 143, 164704 CrossRef PubMed.
- K. I. Öberg and E. A. Bergin, Phys. Rep., 2021, 893, 1–48 CrossRef.
- L. Tinacci, A. Germain, S. Pantaleone, C. Ceccarelli, N. Balucani and P. Ugliengo, Astrophys. J., 2023, 951, 32 CrossRef.
- J. Enrique-Romero, C. Ceccarelli, A. Rimola, D. Skouteris, N. Balucani and P. Ugliengo, Astron. Astrophys., 2021, 655, A9 CrossRef CAS.
- I. W. M. Smith, D. Talbi and E. Herbst, Astron. Astrophys., 2001, 369, 611–615 CrossRef CAS.
- T. Nguyen, I. Fourré, C. Favre, C. Barois, E. Congiu, S. Baouche, J.-C. Guillemin, Y. Ellinger and F. Dulieu, Astron. Astrophys., 2019, 628, A15 CrossRef CAS.
- J. A. Cardelli, J. S. Mathis, D. C. Ebbets and B. D. Savage, Astrophys. J., Lett., 1993, 402, L17 CrossRef CAS.
- D. M. Meyer, M. Jura and J. A. Cardelli, Astrophys. J., 1998, 493, 222 CrossRef CAS.
- E. Jenkins, Astrophys. J., 2009, 700, 1299–1348 CrossRef CAS.
- R. C. Fortenberry, J. Phys. Chem. A, 2024, 128, 1555–1565 CrossRef CAS PubMed.
Footnotes |
| † Electronic supplementary information (ESI) available. See DOI: https://doi.org/10.1039/d4cp01934b |
| ‡ Ethylamine; SDS No. 295442 [Print]; Merck Life Science S.A.S.: Saint-Quentin-Fallavier, France, Feb 16, 2023. https://www.sigmaaldrich.com/FR/fr/product/aldrich/471208 (accessed Nov 9, 2023). |
| This journal is © the Owner Societies 2024 |