 Open Access Article
Creative Commons Attribution 3.0 Unported Licence
Effects of the chain length of nonaromatic epoxy resins on thermomechanical and optical properties: experiments, and ab initio and molecular dynamics simulations
Yoshiaki
Kawagoe†
 *a,
Yuuki
Kinugawa†
a,
Keigo
Matsumoto
b,
Masashi
Ohno
b,
Naoki
Kishimoto
 c,
Takahiko
Kawai
d and
Tomonaga
Okabe
aef
aDepartment of Aerospace Engineering, Tohoku University, 6-6-01, Aoba, Aramaki, Aoba-ku, Sendai, Miyagi 980-8579, Japan. E-mail: kawagoe@tohoku.ac.jp
bChemical Research Laboratories, Nissan Chemical Corporation, 10-1, Tsuboi-Nishi 2-chome, Funabashi, Chiba 274-8507, Japan
cDepartment of Chemistry, Tohoku University, 6-3, Aoba, Aramaki, Aoba-ku, Sendai, Miyagi 980-8578, Japan
dResearch Center for Green X-Tech, Tohoku University, 468-1, Aoba, Aramaki, Aoba-ku, Sendai, Miyagi 980-8572, Japan
eDepartment of Materials Science and Engineering, University of Washington, BOX 352120, Seattle, WA 98195-1750, USA
fResearch Center for Structural Materials, Polymer Matrix Hybrid Composite Materials Group, National Institute for Materials Science, 1-2-1 Sengen, Tsukuba, Ibaraki 305-0047, Japan
First published on 6th August 2024
Abstract
Epoxy resin has been extensively used in the field of advanced electronic materials as an adhesive and encapsulant owing to its excellent material properties. However, recently, there has been a demand for further improvement in heat resistance, high transparency, environmental resistance, and enhanced handling properties for high-brightness light-emitting diodes. Conventional aromatic epoxy resins lack light resistance; therefore, a colorless and transparent epoxy resin without aromatic rings is desirable. In this study, tris(2,3-epoxypropyl) isocyanurate (TEPIC) was used as a nonaromatic epoxy resin, and three types of TEPIC with different side-chain lengths were prepared. The ultraviolet (UV)-visible absorption properties of TEPIC were evaluated using time-dependent density functional theory, and the practicality of the numerical prediction of light resistance was verified. TEPIC yields a UV absorbance spectrum with a lower intensity than those of conventional aromatic epoxy resins, suggesting that TEPIC is expected to have high light resistance. In addition, their thermomechanical properties and the influence of molecular structure were evaluated using both molecular dynamics (MD) simulations and experiments. The MD simulation and experimental results were in good agreement, indicating that the long side chains of TEPIC suppress triaxial deformation-induced failure and improve ductility instead of decreasing strength and stiffness. In addition, the longer side chains form a dense molecular structure with less free volume. These results indicate that numerical approaches can be used to predict various properties of epoxy resins and interpret them from the molecular structure. Accordingly, these approaches can be used to aid the material development process.
1 Introduction
Thermoset resins, such as epoxy resins, have been extensively used in the field of advanced electronic materials as adhesives and encapsulants owing to their excellent material properties, such as high adhesion, high electrical insulation, high heat resistance, low volume shrinkage, high water resistance, and high solvent resistance. However, the recently used high-brightness light-emitting diodes require further improvements in heat resistance, transparency, and environmental resistance while achieving high handling performance. Although conventional bisphenol epoxy resins are extensively used owing to their low cost and good handling properties, these aromatic epoxy resins lack light resistance, and yellowing occurs. This yellowing effect has been reported to be due to the aromatic rings which transform to quinone methide upon exposure to ultraviolet (UV) light.1 Therefore, studies have been conducted to develop cured resins without aromatic rings.2,3In contrast, epoxy resins containing aromatic rings, such as benzene and polycyclic aromatic rings, exhibit high-heat resistance and a low coefficient of thermal expansion (CTE) owing to π–π stacking of the aromatic rings.4,5 Therefore, a tradeoff exists between light and heat resistance. Multifunctional epoxy resins containing triazine rings have been developed to solve this problem. The triazine ring is known to have a structure with high heat resistance,6,7 and it is expected to have a molecular structure with light and heat resistance. In this study, tris(2,3-epoxypropyl) isocyanurate (TEPIC) was used as a nonaromatic epoxy resin containing a triazine ring. TEPIC is often used as an additive to improve thermomechanical properties. Xie et al. used TEPIC as a reactive compatibilizer in a poly(butylene adipate-co-terephthalate) (PBAT)/poly(propylene carbonate) (PPC) blend.8 The addition of TEPIC has been reported to improve the compatibility of PBAT and PPC, and improve thermal stability, strength, and ductility. Di et al. introduced TEPIC into a collagen matrix and reported that the hydrothermal, thermal, and enzyme degradation properties were stabilized by the three-dimensional crosslinked structure formed by reacting with TEPIC.9 In addition, several modified TEPIC monomers have been developed to improve the handling properties. However, there is room for discussion regarding the thermal and mechanical properties of the cured resins (in which TEPIC is mainly used as a base resin) as well as their mechanisms. A thorough understanding of their properties is necessary to predict accurately and interpret their effects as an additive.
In addition to conventional macroscopic mechanical experiments, interpreting material properties from a microscopic perspective, that is, at the molecular scale, is very powerful. One such method is based on molecular dynamics (MD) simulations. MD simulations have successfully revealed the influence of the molecular structure and functional groups on the polymeric material properties, such as the elastic modulus,10–12 strength,13 thermal conductivity,14–17 thermal stability,18 rheology,19 and polymer/solid adhesion.20,21 Because cured TEPIC resins involve chemical reactions, evaluating both the formation of crosslinks and the mechanical properties of the resin is necessary. Okabe et al.22,23 proposed a reaction model based on quantum chemical calculations for curing MD simulations, which has been extensively used in various resin systems.24–28 In this study, we explored the cross-linking reaction paths using ab initio calculations, simulated the curing reaction, evaluated the mechanical properties of the cured TEPIC resin using MD simulations, and clarified the relationship between the molecular structure and mechanical properties.
The light resistance of transparent resins is strongly related to their optical properties. Aromatic epoxies exhibit high light-absorption properties in the UV-to-visible light range, thus resulting in yellowing effects. Absorption properties are often experimentally determined by ultraviolet visible (UV-vis) spectrophotometry29 and analytically by UV-vis spectral analysis using quantum chemical calculations.30 In this study, we performed an ab initio UV-vis spectral analysis of TEPIC and conventional aromatic epoxy monomers to identify their absorbance properties.
2 Experiments
2.1 Material preparation
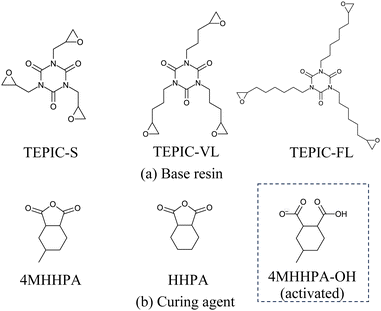
In this study, three types of TEPIC (Nissan Chemical Corporation) were used as the base resins, as shown in Fig. 1(a). TEPIC-S had a basic structure, whereas TEPIC-VL and TEPIC-FL had longer chains in the epoxy group. The curing agent was MH-700 (New Japan Chemical Co., Ltd), which is a mixture of 4-methyl hexahydrophthalic anhydride (4MHHPA) and hexahydrophthalic anhydride (HHPA) at a 7![[thin space (1/6-em)]](https://www.rsc.org/images/entities/char_2009.gif) :
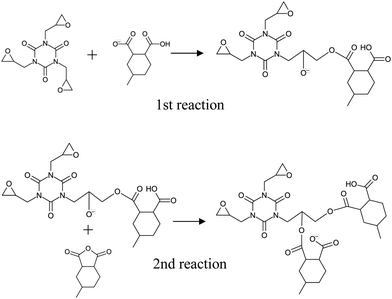
:![[thin space (1/6-em)]](https://www.rsc.org/images/entities/char_2009.gif) 3 ratio. HHPA was added to improve the handling properties of the curing agents. In experiments, tetrabutylphosphonium o,o-diethylphosphorodithioate (PX-4ET, Nippon Chemical Industrial Co., Ltd) was added as a reaction initiator. Ionized PX-4ET initiated the ring opening of 4MHHPA or HHPA, which in turn initiated the reaction with the epoxy group. PX-4ET was incorporated at the end of the crosslinked structure and did not contribute to the primary structure. The reaction pathways are discussed in detail in a subsequent section.
3 ratio. HHPA was added to improve the handling properties of the curing agents. In experiments, tetrabutylphosphonium o,o-diethylphosphorodithioate (PX-4ET, Nippon Chemical Industrial Co., Ltd) was added as a reaction initiator. Ionized PX-4ET initiated the ring opening of 4MHHPA or HHPA, which in turn initiated the reaction with the epoxy group. PX-4ET was incorporated at the end of the crosslinked structure and did not contribute to the primary structure. The reaction pathways are discussed in detail in a subsequent section.
TEPIC, MH-700, and PX-4ET were weighed at a molar ratio of 1![[thin space (1/6-em)]](https://www.rsc.org/images/entities/char_2009.gif) :
:![[thin space (1/6-em)]](https://www.rsc.org/images/entities/char_2009.gif) 3
3![[thin space (1/6-em)]](https://www.rsc.org/images/entities/char_2009.gif) :
:![[thin space (1/6-em)]](https://www.rsc.org/images/entities/char_2009.gif) 0.006. TEPIC was heated to 130 °C and stirred for 60 min in an oil bath. TEPIC was cooled to 80 °C and MH-700 was added and stirred. PX-4ET was added to the mixture and was then mixed and degassed (70 °C for 15 min) using a planetary centrifugal vacuum mixer (ARV-310P, AR-100; Thinky, Japan). The mixture was poured into a glass mold with a release film and cured in an electric oven. The temperature profile during curing was as follows: heating to 100 °C (1.7 °C min−1), holding at 100 °C (2 h), heating to 150 °C (1.7 °C min−1), holding at 150 °C (6 h), and cooling in an oven.
0.006. TEPIC was heated to 130 °C and stirred for 60 min in an oil bath. TEPIC was cooled to 80 °C and MH-700 was added and stirred. PX-4ET was added to the mixture and was then mixed and degassed (70 °C for 15 min) using a planetary centrifugal vacuum mixer (ARV-310P, AR-100; Thinky, Japan). The mixture was poured into a glass mold with a release film and cured in an electric oven. The temperature profile during curing was as follows: heating to 100 °C (1.7 °C min−1), holding at 100 °C (2 h), heating to 150 °C (1.7 °C min−1), holding at 150 °C (6 h), and cooling in an oven.
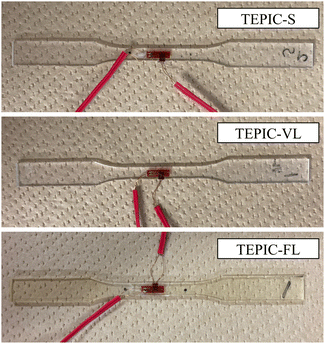
Fig. 2 illustrates the specimens used for the tensile tests described below. TEPIC-S and TEPIC-VL were clear, colorless cured resins, whereas TEPIC-FL was slightly yellowish.
2.2 Characterization
 | (1) |
 | (2) |
Uniaxial compressive tests were performed according to previous studies.13,31 The sample size was 2 mm × 5 mm × 5 mm, and the load was applied along the 2 mm thickness direction at a rate of 2 mm min−1. The compressive tests were conducted three times for each resin. An Instron 5982 (100 kN) instrument was used as the testing apparatus. To relieve the friction between the specimen and the platens, polyethylene films were applied on both the front and back surfaces of the specimens.
2.3 WAXS measurement
Wide-angle X-ray scattering (WAXS) was used to quantitatively estimate the interior molecular structure. The WAXS measurements were performed at BL08W in NanoTerasu (Miyagi, Japan). 2D-WAXS patterns were recorded using the 2D HPC detector Eiger2 R (Bruker K.K.). WAXS measurement was performed at the camera length of 70 mm, where the calibration was carried out with cerium dioxide.2.4 Free volume evaluation
Positron annihilation lifetime spectroscopy (PALS) is extensively used for probing the free volume of polymeric materials. Positron lifetime histograms were measured using a positron surface analyzer (TOYO SEIKO Co., Ltd),32 and the mean void diameters were obtained using the Tao–Eldrup model.33 The sample size is approximately 2 mm × 15 mm × 15 mm.3 Numerical methods
3.1 Ab initio calculation
The reaction routes for determining the activation energy and heat of formation were calculated using global reaction route mapping (GRRM),34–39 an accurate reaction path search package aided by ab initio quantum calculations using a Gaussian program. The detailed procedure for the reaction path search using GRRM is summarized in ref. 40. In this study, we assumed a benzene solvent environment using a polarizable continuum model (PCM) in the GRRM calculations,41 enabling the exploration of reaction routes involving ions, which was performed at the B3LYP/6-31G(d) theory level.
3.2 MD simulations
![[thin space (1/6-em)]](https://www.rsc.org/images/entities/char_2009.gif) :
:![[thin space (1/6-em)]](https://www.rsc.org/images/entities/char_2009.gif) 3. In the case of TEPIC-S, the numbers of molecules of TEPIC-S and the curing agent were 400 and 1200, respectively, and consisted of 680 molecules of 4MHHPA, 160 molecules of activated 4MHHPA-OH, and 360 molecules of HHPA. The same number of Na+ ions was introduced as counter ions as that in the activated 4MHHPA-OH to maintain the neutrality of the system. The counter ions did not react with other molecules. Periodic boundary conditions were applied in all the directions. A uniform artificial compression of the simulation box was applied until the density reached 0.8 g cm−3 at a constant temperature. Subsequently, an NPT simulation was conducted for 200 ps at 423.15 K and 1 atm to obtain an uncured initial state.
3. In the case of TEPIC-S, the numbers of molecules of TEPIC-S and the curing agent were 400 and 1200, respectively, and consisted of 680 molecules of 4MHHPA, 160 molecules of activated 4MHHPA-OH, and 360 molecules of HHPA. The same number of Na+ ions was introduced as counter ions as that in the activated 4MHHPA-OH to maintain the neutrality of the system. The counter ions did not react with other molecules. Periodic boundary conditions were applied in all the directions. A uniform artificial compression of the simulation box was applied until the density reached 0.8 g cm−3 at a constant temperature. Subsequently, an NPT simulation was conducted for 200 ps at 423.15 K and 1 atm to obtain an uncured initial state.
The reaction model proposed by Okabe et al.22 was used to perform the curing MD simulation. Two reaction criteria exist: the distance between reaction sites and the reaction probability. When the distance was within the reaction cutoff, this site became a reaction candidate, and 7.3 Å was used as the cutoff based on the minimum distance between the epoxy groups in TEPIC-S. The Arrhenius-type reaction probability p was determined using the activation energy Ea and local temperature Tlocal as follows:
 | (3) |
For a < p, where a is a generated uniform random number ranging from 0 to 1, a crosslink was formed that justified the occurrence of the reaction. For structural relaxation, minimization by a conjugate gradient algorithm, and NPT (15 ps, 423.15 K, 1 atm), and NVT simulations (1 ps, 423.15 K) were performed. Finally, the atomic velocities among the reacted sites were scaled to remain at Kafter = Kbefore + Hf, where Ki is the sum of the kinetic energies before and after the reaction. The curing process was terminated when the curing reaction reached saturation.
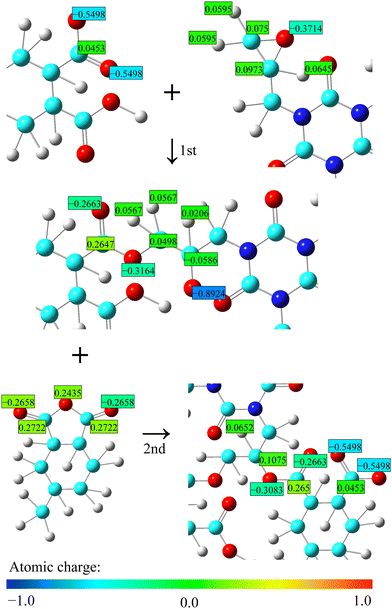
In this study, all MD simulations were performed using LAMMPS,46 and cross-link formation was performed using an in-house Python code. A DREIDING force field47 was used with Gasteiger atomic charges.48 Therefore, it is necessary to update the atomic charge during crosslinking. Based on the new bonding structure, only the atomic charges of the atoms around the reaction site were updated, leaving the other charges intact, as shown in Fig. 4. Any excess or deficient charge from the original charge was partially distributed on the carbon atoms of cyclohexane. The van der Waals (vdW) interaction was expressed by the Lennard-Jones potential with a cutoff of 12 Å, and the electrostatic interactions were calculated using the particle–particle particle–mesh method.49 The reversible reference system propagator algorithm was used for the time integrator50 using time steps of 0.2 fs (bond and angle) and 1.0 fs (dihedral, improper, vdW, and electrostatic interactions). The NVT and NPT simulations were performed using a Nosé–Hoover chain thermostat and barostat, respectively.51 For each resin type, five cured systems with different initial arrangements were simulated, and the predicted properties described below are averages of the five systems. The molecular visualizations were produced by the OVITO,52 and Marvin53 was used for drawing the chemical structures.
In general, the strain rate in the MD simulations is quite large compared to the experimental strain rate. Therefore, the strength is overestimated by the rheological behavior of the resin in the MD simulations at high strain rates. Therefore, in this study, the uniaxial tensile/compressive strength was evaluated using the approach proposed by Watanabe et al.13 In this approach, the strengths were estimated by combining uniaxial compressive, triaxial tensile, and quasistatic uniaxial tensile simulations, Argon theory,55–57 and Christensen's failure criterion.58,59
The brittle/ductile failure behavior of the resins can be described using Christensen's criterion as follows,
 | (4) |
![[small sigma, Greek, circumflex]](https://www.rsc.org/images/entities/i_char_e111.gif) m = σm/C and
m = σm/C and  are the hydrostatic and von Mises stresses, respectively, which are nondimensionalized by C. Materials with a larger T/C exhibit a more ductile behavior. When hydrostatic loading leads to resin failure, σm = σym,
  , and eqn (4) is transformed as follows:
 | (5) |
The compressive strength C, excluding the strain rate dependence at arbitrary temperatures, is expressed by the following equation:
| C(T) = aTsystem + C0K | (6) |
 | (7) |
 | (8) |
The coherent scattering intensity, Icoh, can be calculated by using the Fourier transformation of the partial radial distribution functions as follows:60,61
 | (9) |
![[thin space (1/6-em)]](https://www.rsc.org/images/entities/char_2009.gif) sin
sin![[thin space (1/6-em)]](https://www.rsc.org/images/entities/char_2009.gif) θ/λ is the length of the scattering vector q, where λ is the wavelength of the incident radiation and 2θ is the diffracted radiation.
θ/λ is the length of the scattering vector q, where λ is the wavelength of the incident radiation and 2θ is the diffracted radiation.
In addition, the free volume of a thermoset resin is an important factor that determines its microscopic structural and mechanical properties.63–65 In the MD simulations, the free volume was calculated using the algorithm proposed by Li and Strachan.65 The simulation box was divided into cubic grids with a cell size of 0.5 Å. If the αth grid point satisfies the following equation for all atoms, then this grid is included in the free volume.
| |rα − ri| > (Dp − DvdWi)/2 | (10) |
4 Results and discussion
4.1 Optical properties
Fig. 5(a) shows the calculated UV-vis spectrum and the highest oscillator strength for the conventional aromatic epoxy resin (DGEBA) and the three types of TEPIC. The most intense electronic transitions for DGEBA, TEPIC-S, TEPIC-VL, and TEPIC-FL occur at 185.58 nm, 169.09 nm, 168.16 nm, and 168.82 nm, respectively. No peaks were observed in the visible-light region (380–780 nm) in any of the resin types. The aromatic epoxy, DGEBA, exhibited broad and intense peaks in the UV region. In contrast, all three TEPIC resins exhibited low absorbances in the UV region, and the maximum oscillator strengths were smaller than that of DGEBA.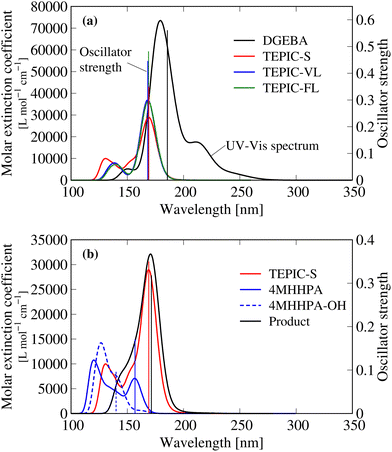 | ||
| Fig. 5 Calculated ultraviolet-visible spectrum. (a) Conventional aromatic epoxy (DGEBA) and three types of TEPIC resins. (b) Reactants and product. | ||
Fig. 6 visualizes the molecular orbital (MO) of the main conformation in the excited state at the maximum oscillator strength for DGEBA and TEPIC-S. In DGEBA, the benzene ring is excited at a wavelength of 185.58 nm and the number of nodal planes in MO at the benzene rings increases upon electron excitation. In TEPIC-S, the triazine ring is excited at a wavelength of 169.09 nm. These results suggest that the triazine ring of TEPIC is less easily excited by UV light than the benzene ring of aromatic epoxy and has high light resistance.
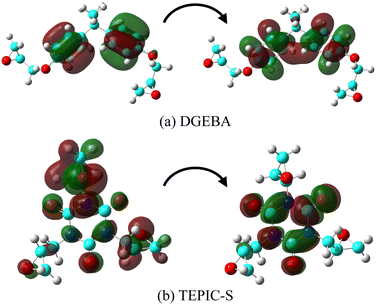 | ||
| Fig. 6 Main configuration MO of the excited state at maximum oscillator strength for (a) DGEBA and (b) TEPIC-S. | ||
Fig. 5(b) shows the results of the reactants and product. All the base resins, curing agents, and product molecules have low light absorption properties; thus, the spectral analysis suggests that the HHPA-cured TEPIC resin considered here has high transparency and light resistance.
4.2 Curing reaction properties
Fig. 7 shows the pathways for the first and second reactions as shown in Fig. 3. For the first reaction between the epoxy group and COO−, the activation energy was 22.26 kcal mol−1 (with zero-point energy correction at 0 K) and the heat of formation was −12.59 kcal mol−1, which indicates an endothermic reaction. For the second reaction between O− and 4MHHPA, the reaction barrier barely appears and the heat of formation is 19.54 kcal mol−1, indicating an exothermic reaction. Therefore, it is an exothermic reaction when considered as a three-molecule system with a two-step reaction pathway. These reaction properties were incorporated into the curing MD simulations using eqn (3).4.3 Thermomechanical properties
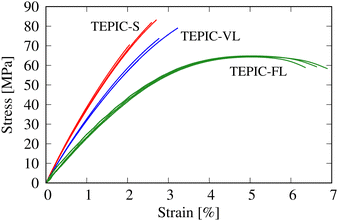
The thermomechanical properties of the cured resins were discussed from both experimental and simulation perspectives. Fig. 8 shows the stress–strain curves obtained in the unitensile experiment. For TEPIC-S and VL, the strain was obtained from strain gauges, and for TEPIC-FL, the strain was obtained from a video extensometer. In particular, brittle–ductile properties differed significantly depending on the length of the side chains. TEPIC-FL had approximately 80% of the strength of TEPIC-S, whereas the failure strain increased to almost three times that of TEPIC-S, making it a ductile material.Table 1 summarizes the thermomechanical properties obtained from experiments and MD simulations. Failure strain values were not available for the MD simulations because the uniaxial tensile strength was not determined directly. The cure conversion and crosslink densities are listed in Table 1. Only the values obtained from the MD simulations are shown for the crosslink density. The characteristics predicted from the MD simulations were in qualitative agreement with the experiments, and quantitative agreement was also confirmed for many items, thus confirming the validity of the simulations.
| TEPIC-S | Exp. | TEPIC-VL | Exp. | TEPIC-FL | Exp. | |
|---|---|---|---|---|---|---|
| MD | MD | MD | ||||
| E [GPa] | 3.40 | 4.09 | 3.33 | 3.50 | 3.12 | 2.75 |
| ν [—] | 0.31 | 0.34 | 0.31 | 0.35 | 0.33 | 0.37 |
| T [MPa] | 112.8 | 76.5 | 98.3 | 76.4 | 82.9 | 64.4 |
| Failure strain [%] | — | 2.45 | — | 3.00 | — | 6.64 |
| C [MPa] | 185.6 | 164.4 | 154.0 | 138.6 | 129.4 | 90.0 |
| T/C | 0.60 | 0.47 | 0.63 | 0.55 | 0.64 | 0.72 |
| T g [°C] | 193.6 | 194.9 | 152.7 | 146.7 | 120.3 | 92.4 |
| CTE [10−6 °C−1] | 73.0 | 62.4 | 80.3 | 64.9 | 85.0 | 82.2 |
| Cure conversion [%] | 90.1 | 95.9 | 88.8 | 89.3 | 89.4 | 93.4 |
| Crosslink density [×10−3 Å−3] | 2.28 | — | 1.94 | — | 1.61 | — |
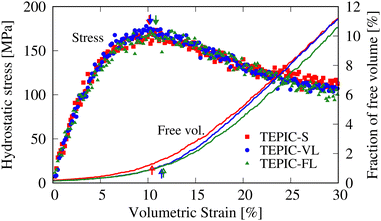
The stiffness and strength decreased at increasing side-chain lengths. This is because the crosslink density decreases as the side chains become longer, which is consistent with the trend observed in a previous study conducted with different resin types.45 Conversely, predicted and experimental T/C show that ductility increases with increasing side-chain length. This corresponds to the experimental results for the failure strain. Fig. 9 shows the hydrostatic stress–volumetric strain curve and the change in the free volume fraction in the triaxial tensile simulation averaged over the five cases for each resin. The downward arrows indicate the strain values at yielding, that is, peak stress; additionally, the upward arrows indicate the strain values at the inflection point of the free volume fraction changes, which were determined as the intersection of two linear fittings in the strain ranges of 0–3% and 15–18%. The stress–strain curve peaks when the free volume rapidly increases and at the time of coalescence. Fig. 10 shows snapshots of the free volume distributions of the three resin types at the same strain level (10.5%). The white areas in the snapshots represent the free volume. In addition, the fraction of free volume and the maximum diameters of the volume-equivalent spheres of each free-volume cluster are shown. In TEPIC-S with shorter side chains, the free volume was relatively connected, and both the free volume fraction and maximum diameter were large. In contrast, for TEPIC-FL with longer side chains at the same deformation, the free volume was dispersed, and the free volume fraction and maximum diameter were small. Longer side chains suppress the free volume growth under triaxial deformation conditions. In many thermoset resins, tensile fracture is initiated by void growth owing to localized triaxial stress. The suppression of free volume growth by long side chains, confirmed by simulations, supports the brittle–ductile properties of the mechanical experiments.
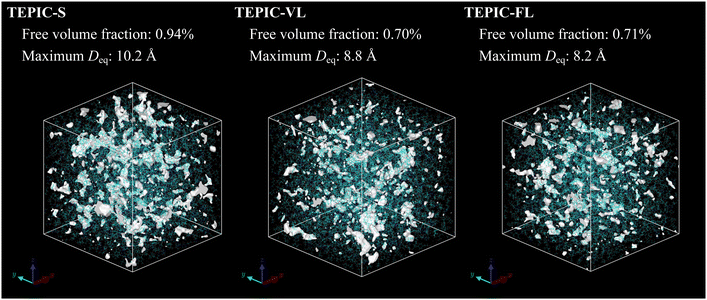 | ||
| Fig. 10 Snapshots of free volume distributions of three resin types at the same strain level in triaxial tensile simulations. | ||
The longer the side chain, the lower the Tg, and the higher the CTE. Because Tg and CTE are also highly dependent on the crosslink density, the side-chain elongation results in a decrease in the thermal properties of TEPIC.
4.4 Structural properties
In this section, the structural properties (in the absence of deformation) are discussed. Fig. 11 shows the comparison of scattering intensities obtained from the MD simulations and WAXS measurements. The intensity patterns of TEPIC-S exhibits three peaks at approximately q = 5, 10, and 30 nm−1; this trend is the same as that of conventional amine-cured aromatic epoxy resins such as DGEBA/DETA.25,66 In the amine-cured epoxy resin, the first peak represents the locally ordered structure in the resin, which is attributed to two-dimensional growth, in which resins start to form linear structures and then branched structures at the amine groups. Although TEPIC-S has a branched structure, it also has a rigid two-dimensional molecular structure based on triazine rings with short side chains. This two-dimensional structure was crosslinked by a curing agent; this resulted in the appearance of the same peak, which originated from the growth process, as that of conventional epoxy resins. Conversely, the first peak became smaller for TEPIC-VL, which has a moderately long side chain and almost disappeared for TEPIC-FL, which has the longest side chain. This may be because the TEPIC monomer with longer side chains can easily form an appropriate three-dimensional structure and does not undergo two-dimensional cross-link growth. The peaks around q = 10–15 nm−1 are typical amorphous halos attributed to intermolecular correlations. The peak positions and peak decreasing trends of the scattering intensities are consistent between the MD simulations and WAXS, which indicates that the structures of the cured resin models for the three types of resin modeled in the MD simulations are reasonable.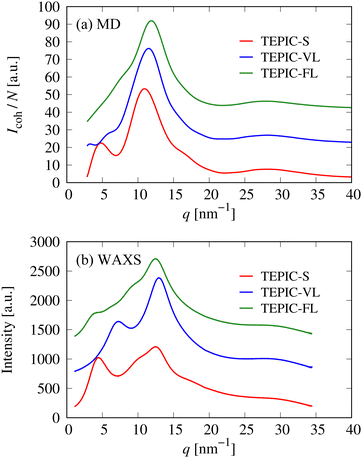 | ||
| Fig. 11 Comparison of X-ray scattering intensities of three types of resins obtained from (a) MD simulations and (b) WAXS. | ||
Fig. 12 shows the size distributions of the free volumes of the three types of resins. The abscissa represents the diameter of the volume-equivalent sphere of the free-volume cluster. Table 2 shows the fraction of the free volume and volume average equivalent diameter obtained from the MD simulations and the void diameter measured by PALS. Note that the free volume values obtained from the MD simulations are strongly dependent on the probe diameter used; therefore, a qualitative comparison was made. The PALS and MD simulations are in agreement, with the free volume decreasing as the side chains become longer, and their average sizes decreasing. As the monomer size increases, the free volume during curing has been reported to increase.44,63 This is because larger monomer molecules have greater steric hindrance. However, as mentioned earlier, in the case of TEPIC, the soft side chains reduce the effect of steric hindrance, resulting in the opposite trend. This could be a new guideline for molecular design to reduce the free volume.
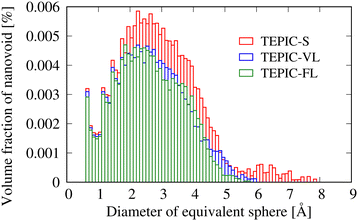 | ||
| Fig. 12 Size distributions of the free volumes of three types of resins in terms of the diameters of the volume-equivalent spheres. | ||
| Type | Fraction (MD) [%] | Diameter (MD) [Å] | Diameter (PALS) [Å] |
|---|---|---|---|
| TEPIC-S | 0.176 | 2.89 | 5.44 ± 0.07 |
| TEPIC-VL | 0.135 | 2.64 | 5.28 ± 0.06 |
| TEPIC-FL | 0.130 | 2.59 | 5.27 ± 0.06 |
5 Conclusions
In this study, the optical, thermomechanical, and structural properties of the triazine ring-based nonaromatic epoxy resin TEPIC were experimentally and numerically evaluated. Three resins with different side-chain lengths were used: TEPIC-S, TEPIC-VL, and TEPIC-FL. UV-vis spectral analysis using TD-DFT demonstrated that TEPIC had a lower UV absorbance and higher light resistance than conventional aromatic epoxy resins. Evaluation of the thermomechanical properties using both experiments and MD simulations revealed that shorter side chains resulted in higher stiffness, strength, and heat resistance, indicating the brittle nature of the resin. The MD simulations showed that longer side chains suppressed void growth under triaxial deformation that constitutes the starting point of failure and improved the ductility of the resin. In addition, structural properties were evaluated using MD simulations, WAXS, and PALS. Longer side chains (i.e., larger molecular sizes) had denser molecular structures and lower free volumes; this contrasts with the conventional trend. These findings are expected to aid in the understanding of the features of nonaromatic epoxy resins at the molecular scale and promote the development of high-performance resins for advanced electronic components.Data availability
The code for LAMMPS and curing python code can be found at https://www.lammps.org/#gsc.tab=0 and https://www.cosmic.plum.mech.tohoku.ac.jp/, respectively.Conflicts of interest
The authors declare no conflicts of interest.Acknowledgements
This research was supported by the Japan Society for the Promotion of Science KAKENHI grant (Grant Number 21K14415 and 23H01291). Numerical simulations were performed using the “AFI-NITY” supercomputer system at the Advanced Fluid Information Research Center, Institute of Fluid Science, Tohoku University and supercomputing resources at Cyberscience Center, Tohoku University. We would like to express our gratitude to all the members of QST NanoTerasu Center and PhoSIC for their support in utilizing NanoTerasu.References
- B. Mailhot, S. Morlat-Thérias, M. Ouahioune and J. L. Gardette, Macromol. Chem. Phys., 2005, 206, 575–584 CrossRef.
- N. Arsu, R. Stephen Davidson and R. Holman, J. Photochem. Photobiol., A, 1995, 87, 169–175 CrossRef.
- D. J. Krug, M. Z. Asuncion, V. Popova and R. M. Laine, Compos. Sci. Technol., 2013, 77, 95–100 CrossRef CAS.
- J. Y. Lee and J. Jang, Polymer, 2006, 47, 3036–3042 CrossRef CAS.
- G. Pan, Z. Du, C. Zhang, C. Li, X. Yang and H. Li, Polymer, 2007, 48, 3686–3693 CrossRef CAS.
- W. Wang, P. Wen, J. Zhan, N. Hong, W. Cai, Z. Gui and Y. Hu, Polym. Degrad. Stab., 2017, 144, 454–463 CrossRef CAS.
- Y. Qi, Z. Hou, S. Xu, Q. Xu, X. Huan, D. Bao, D. Zhang, G. Zhou, Y. Zhang and F. Tan, Polym. Degrad. Stab., 2023, 216, 110482 CrossRef CAS.
- D. Xie, Q. Pang, Y. Zhao, Y. Li, F. Li and H. He, J. Appl. Polym. Sci., 2022, 139, e52940 CrossRef CAS.
- Y. Di and R. J. Heath, Polym. Degrad. Stab., 2009, 94, 1684–1692 CrossRef CAS.
- G. M. Odegard, B. D. Jensen, S. Gowtham, J. Wu, J. He and Z. Zhang, Chem. Phys. Lett., 2014, 591, 175–178 CrossRef CAS.
- J. Cui, J. Zhao, S. Wang, Y. Wang and Y. Li, Comput. Mater. Sci., 2021, 196, 110556 CrossRef CAS.
- C. Li, H. Jiang, F. Hong and K. Bi, Chem. Phys. Lett., 2022, 802, 139769 CrossRef CAS.
- T. Watanabe, Y. Kawagoe, K. Shirasu and T. Okabe, Int. J. Solids Struct., 2023, 283, 112489 CrossRef CAS.
- Y. Kawagoe, D. Surblys, G. Kikugawa and T. Ohara, AIP Adv., 2019, 9, 025302 CrossRef.
- Y. Kawagoe, D. Surblys, H. Matsubara, G. Kikugawa and T. Ohara, Polymer, 2019, 180, 121721 CrossRef.
- Y. Kawagoe, D. Surblys, H. Matsubara, G. Kikugawa and T. Ohara, Langmuir, 2020, 36, 6482–6493 CrossRef CAS PubMed.
- Y. Zhao, G. Kikugawa, Y. Kawagoe, K. Shirasu and T. Okabe, Int. J. Heat Mass Transfer, 2022, 198, 123429 CrossRef CAS.
- L. A. Ribeiro, M. L. Pereira, W. F. Giozza, R. M. Tromer and D. S. Galvão, Chem. Phys. Lett., 2022, 807, 140075 CrossRef CAS.
- B. S. Chava, E. K. Thorn and S. Das, Phys. Chem. Chem. Phys., 2021, 23, 24634–24645 RSC.
- G. Kacar, E. A. Peters, L. G. Van Der Ven and G. De With, Phys. Chem. Chem. Phys., 2015, 17, 8935–8944 RSC.
- T. Miyata, Y. K. Sato, Y. Kawagoe, K. Shirasu, H. F. Wang, A. Kumagai, S. Kinoshita, M. Mizukami, K. Yoshida, H. H. Huang, T. Okabe, K. Hagita, T. Mizoguchi and H. Jinnai, Nat. Commun., 2024, 15, 1898 CrossRef CAS.
- T. Okabe, T. Takehara, K. Inose, N. Hirano, M. Nishikawa and T. Uehara, Polymer, 2013, 54, 4660–4668 CrossRef CAS.
- T. Okabe, Y. Oya, K. Tanabe, G. Kikugawa and K. Yoshioka, Eur. Polym. J., 2016, 80, 78–88 CrossRef CAS.
- S. Yamamoto, R. Kuwahara, M. Aoki, A. Shundo and K. Tanaka, ACS Appl. Polym. Mater., 2020, 2, 1474–1481 CrossRef CAS.
- Y. Kawagoe, G. Kikugawa, K. Shirasu and T. Okabe, Soft Matter, 2021, 17, 6707–6717 RSC.
- Y. Kawagoe and T. Okabe, Comput. Mater. Sci., 2023, 228, 112333 CrossRef.
- Y. Kawagoe, G. Kikugawa, K. Shirasu, Y. Kinugawa and T. Okabe, J. Phys. Chem. B, 2024, 128, 2018–2027 CrossRef CAS.
- Y. Zhao, G. Kikugawa, K. Shirasu, Y. Kawagoe and T. Okabe, Polymer, 2024, 297, 126817 CrossRef CAS.
- H. Jdidi, N. Fourati, C. Zerrouki, L. Ibos, M. Fois, A. Guinault, W. Jilani, S. Guermazi and H. Guermazi, Polymer, 2021, 228, 123882 CrossRef CAS.
- G. Barcaro, L. Sementa, A. Fortunelli and M. Stener, Phys. Chem. Chem. Phys., 2015, 17, 27952–27967 RSC.
- B. Fiedler, M. Hojo, S. Ochiai, K. Schulte and M. Ando, Compos. Sci. Technol., 2001, 61, 1615–1624 CrossRef CAS.
- M. Yamawaki, Y. Kobayashi, K. Hattori and Y. Watanabe, Jpn. J. Appl. Phys., 2011, 50, 086301 CrossRef.
- M. Eldrup, D. Lightbody and J. N. Sherwood, Chem. Phys., 1981, 63, 51–58 CrossRef CAS.
- K. Ohno and S. Maeda, Chem. Phys. Lett., 2004, 384, 277–282 CrossRef CAS.
- S. Maeda and K. Ohno, J. Phys. Chem. A, 2005, 109, 5742–5753 CrossRef CAS.
- K. Ohno and S. Maeda, Phys. Scr., 2008, 78, 058122 CrossRef.
- S. Maeda, K. Ohno and K. Morokuma, Phys. Chem. Chem. Phys., 2013, 15, 3683–3701 RSC.
- J. Li, S. Jumpei, H. Waizumi, Y. Oya, Y. Huang, N. Kishimoto and T. Okabe, Chem. Phys. Lett., 2019, 720, 64–69 CrossRef CAS.
- Y. Xi, H. Fukuzawa, S. Fukunaga, G. Kikugawa, Y. Zhao, Y. Kawagoe, T. Okabe and N. Kishimoto, Mol. Catal., 2024, 552, 113680 CrossRef CAS.
- Y. Oya, M. Nakazawa, K. Shirasu, Y. Hino, K. Inuyama, G. Kikugawa, J. Li, R. Kuwahara, N. Kishimoto, H. Waizumi, M. Nishikawa, A. Waas, N. Odagiri, A. Koyanagi, M. Salviato and T. Okabe, Chem. Phys. Lett., 2021, 762, 138104 CrossRef CAS.
- N. Kishimoto, Chem. Phys. Lett., 2017, 667, 172–179 CrossRef CAS.
- M. J. Frisch, G. W. Trucks, H. B. Schlegel, G. E. Scuseria, M. A. Robb, J. R. Cheeseman, G. Scalmani, V. Barone, G. A. Petersson, H. Nakatsuji, X. Li, M. Caricato, A. V. Marenich, J. Bloino, B. G. Janesko, R. Gomperts, B. Mennucci, H. P. Hratchian, J. V. Ortiz, A. F. Izmaylov, J. L. Sonnenberg, D. Williams-Young, F. Ding, F. Lipparini, F. Egidi, J. Goings, B. Peng, A. Petrone, T. Henderson, D. Ranasinghe, V. G. Zakrzewski, J. Gao, N. Rega, G. Zheng, W. Liang, M. Hada, M. Ehara, K. Toyota, R. Fukuda, J. Hasegawa, M. Ishida, T. Nakajima, Y. Honda, O. Kitao, H. Nakai, T. Vreven, K. Throssell, J. A. Montgomery, Jr., J. E. Peralta, F. Ogliaro, M. J. Bearpark, J. J. Heyd, E. N. Brothers, K. N. Kudin, V. N. Staroverov, T. A. Keith, R. Kobayashi, J. Normand, K. Raghavachari, A. P. Rendell, J. C. Burant, S. S. Iyengar, J. Tomasi, M. Cossi, J. M. Millam, M. Klene, C. Adamo, R. Cammi, J. W. Ochterski, R. L. Martin, K. Morokuma, O. Farkas, J. B. Foresman and D. J. Fox, Gaussian 16, Gaussian, Inc., Wallingford CT, 2016 Search PubMed.
- R. Dennington, T. A. Keith and J. M. Millam, GaussView, Version 6.1, Semichem Inc., Shawnee Mission, KS, 2016.
- Y. Kawagoe, K. Kawai, Y. Kumagai, K. Shirasu, G. Kikugawa and T. Okabe, Mech. Mater., 2022, 170, 104332 CrossRef.
- Y. Zhao, G. Kikugawa, Y. Kawagoe, K. Shirasu, N. Kishimoto, Y. Xi and T. Okabe, J. Phys. Chem. B, 2022, 126, 2593–2607 CrossRef CAS PubMed.
- S. Plimpton, J. Comput. Phys., 1995, 117, 1–19 CrossRef CAS.
- S. L. Mayo, B. D. Olafson and W. A. Goddard III, J. Phys. Chem., 1990, 101, 8897–8909 CrossRef.
- J. Gasteiger and M. Marsili, Tetrahedron, 1980, 36, 3219–3228 CrossRef CAS.
- R. W. Hockney and J. W. Eastwood, Computer Simulation Using Particles, CRC Press, 1988, p. 540 Search PubMed.
- M. Tuckermar, B. J. Berne and G. J. Martyna, J, Chem. Phys., 1992, 97, 1990–2001 CrossRef.
- W. Shinoda, M. Shiga and M. Mikami, Phys. Rev. B: Condens. Matter Mater. Phys., 2004, 69, 134103 CrossRef.
- A. Stukowski, Modell. Simul. Mater. Sci. Eng., 2010, 18(1), 015012 CrossRef.
- MarvinSketch 20.20.0, ChemAxon, http://www.chemaxon.com.
- N. Odagiri, K. Shirasu, Y. Kawagoe, G. Kikugawa, Y. Oya, N. Kishimoto, F. S. Ohuchi and T. Okabe, J. Appl. Polym. Sci., 2021, 138, 50542 CrossRef CAS.
- A. S. Argon, Philos. Mag., 1973, 28, 839–865 CrossRef CAS.
- V. Sundararaghavan and A. Kumar, Int. J. Plast., 2013, 47, 111–125 CrossRef CAS.
- N. Vu-Bac, M. A. Bessa, T. Rabczuk and W. K. Liu, Macromolecules, 2015, 48, 6713–6723 CrossRef CAS.
- R. Christensen, The Theory of Materials Failure, OUPOxford, 2013 Search PubMed.
- R. M. Christensen, J. Appl. Mech., 2020, 87, 051001 CrossRef CAS.
- D. A. Keen, J. Appl. Crystallogr., 2001, 34, 172–177 CrossRef CAS.
- S. V. Kallivokas, A. P. Sgouros and D. N. Theodorou, Soft Matter, 2019, 15, 721–733 RSC.
- P. J. Brown, A. G. Fox, E. N. Maslen, M. A. O'Keefe and B. T. M. Willis, International Tables for Crystallography, 2006, vol. C, pp. 554–595 Search PubMed.
- Y. C. Jean, Q. Deng and T. T. Nguyen, Macromolecules, 1995, 28, 8840–8844 CrossRef CAS.
- G. Dlubek, J. Stejny and M. A. Alam, Macromolecules, 1998, 31, 4574–4580 CrossRef CAS.
- C. Li and A. Strachan, Polymer, 2016, 97, 456–464 CrossRef CAS.
- K.-f Lin, W.-y Shu and T.-l Wey, Polymer, 1993, 34, 277–288 CrossRef CAS.
Footnote |
| † These authors have contributed equally. |
| This journal is © the Owner Societies 2024 |

