 Open Access Article
Creative Commons Attribution 3.0 Unported Licence
Study of promoted Cu/ZnO and Cu/ZrO2 catalysts for dimethyl adipate hydrogenolysis†
Jaroslav
Aubrecht
 *a,
Violetta
Pospelova
 a,
Sharmistha
Saha
a,
Miloslav
Lhotka
b,
Iva
Paterová
c and
David
Kubička
a,
Sharmistha
Saha
a,
Miloslav
Lhotka
b,
Iva
Paterová
c and
David
Kubička
 a
a
aDepartment of Sustainable Fuels and Green Chemistry, University of Chemistry and Technology Prague, Technická 5, 166 28 Prague, Czech Republic. E-mail: aubrechj@vscht.cz
bDepartment of Inorganic Technology, University of Chemistry and Technology Prague, Technická 5, 166 28 Prague, Czech Republic
cDepartment of Organic Technology, University of Chemistry and Technology Prague, Technická 5, 166 28 Prague, Czech Republic
First published on 24th July 2024
Abstract
Two supports (ZnO, ZrO2) and four promoters (Al2O3, ZnO, CoOx, NiO) were investigated to design environmentally-friendly Cu-based hydrogenolysis catalysts. Both catalyst characterization and activity in dimethyl adipate hydrogenolysis were described. While ZrO2 improved the reducibility of CuO nanoparticles, these particles were less stable under reaction conditions. ZnO provided better stabilization and reduced coke formation. CoOx, used as a promoter, increased the surface availability of dissociated H2 and stabilized Cu nanoparticles with a high surface area. Conversely, Al2O3 or NiO promoters improved neither catalyst performance nor selectivity due to the higher number of acid–base sites. The essential role of ZnO, whether used as support or a single promoter, was attributed to Cu–ZnO synergy that enhanced the activity in dimethyl adipate hydrogenolysis and improved desired selectivity to hexane-1,6-diol. Overall, the hydrogenolysis activity (TOFH) was 5 times higher for ZnO-supported catalysts.
Introduction
Catalysts play a major role in green chemistry and bring many environmental and economic benefits not only by enhancing the reaction rate but also by achieving higher selectivity towards a desired product under milder reaction conditions compared to a non-catalyzed reaction.1 However, the environmental impact of catalyst manufacturing itself represents a drawback of many traditional industrial chemical processes.2 One such example is the conventional process of alcohol production by hydrogenolysis of esters that is carried out over so-called Adkins catalysts which consist of CuO and Cr2O3. The catalytic activity of Adkins catalysts is attributed to metallic copper, Cu0; however, pure metallic copper is not stable at high temperatures.3–5 To increase the stability of copper particles and prevent them from sintering, Cr2O3 is added as a structural promoter.6,7 Nevertheless, from the green chemistry point of view, Adkins catalysts are not appropriate because of the toxicity of chromium, which leads to difficult handling of the catalyst, including costly ecological disposal of the liquid and solid waste.8 Therefore, there is a demand to replace conventional Adkins catalysts with other environmentally-friendly copper-based catalysts meeting the following requirements: (i) high hydrogenolysis activity, (ii) high selectivity towards alcohols, and (iii) long-term stability of catalytic performance that is ensured by minimum sintering of the highly dispersed copper particles.The industrial significance of ester hydrogenolysis is exemplified by the hydrogenolysis of dimethyl adipate (DMA) towards hexane-1,6-diol (HDOL).9 HDOL serves as a valuable monomer in the production of polyesters and polyurethanes, and finds applications in the cosmetic and pharmaceutical industries.10
Recent studies have explored alternative catalysts for DMA hydrogenolysis. The first group of hydrogenolysis catalysts is based on noble metals.11–13 However, the limited availability of noble metals increases their environmental impact. The second group comprises co-precipitated Cu-based catalysts.14–16 These studies have reported CuO particle sizes ranging from 14 to 20 nm, as detected by XRD. Despite their effectiveness, these catalysts typically have high Cu loading. Therefore, a greener approach involves developing supported catalysts with lower, yet highly-dispersed Cu.
It was previously suggested that the mutual interaction of Cu and ZrO2 and ZnO might also be beneficial from the structural (stabilizing Cu nanoparticles) as well as activity (enhanced ester adsorption) point of view.17,18 This is due to the presence of Zr4+ and O2− ions in monoclinic ZrO2 acting as Lewis acid–base sites that enhance the adsorption of the reacting ester and, in turn, facilitate ester hydrogenolysis over Cu/ZrO2.19 For Cu/ZnO we found that ZnO improved the stability of the Cu particles and prevented their sintering.18,20 Also, it was reported that Cu and ZnO might form a stable Cu–Zn surface alloy having an increased number of oxygen vacancies21 contributing to the enhanced adsorption of oxygenates. Therefore, the size, dispersion, and stability of Cu particles as well as other structural effects are directly affected by the chosen support.
Besides that, the structural properties of a catalyst can be modified by the addition of a promoter.22 Its introduction directly influences the surface structure and/or the formation of active sites.23 For example, Al2O3 and ZnO can act as structural promoters because they increase Cu dispersion by the reduction of the Cu crystallite size, and promote ester adsorption through the carbonyl group, resulting in higher catalyst hydrogenolysis activity.10,24,25 In a CuZn/ZrO2 catalyst for methanol synthesis, ZnO stabilized the partially charged Cuδ+ sites at the metal-oxide interface being Lewis sites.26 E. Lam et al. reported highly increased reactive surface sites in Cu/Al2O3 catalysts due to the several interfacial sites of Al2O3.27 Nishimura et al. found that the formation of boehmite in Cu/Al2O3 inhibits the agglomeration of Cu particles.28 Therefore, the addition of Al2O3 improves the durability of Cu catalysts.
As published recently, the Cu–Ni interaction increased the catalyst resistance to carbon deposition due to the synergetic effect of Ni with Cu in a Ni–Cu alloy.29 When an appropriate amount of Ni was introduced to Cu/SiO2, both high dispersion of Cu crystallites and enhanced catalyst stability were achieved, whereas an excess of Ni led to Ni crystallite aggregation and Cu crystallite growth.30 Moreover, during the hydrogenolysis reaction, Ni can improve the reducibility of copper and the catalytic performance due to the presence of activated hydrogen on the catalyst surface.31 Another potential promoter to influence the cleavage of the C–O bond during the hydrogenolysis reaction is CoOx. The addition of CoOx to Cu/Al2O3 resulted in a strong interaction of CoOx with Cu, increasing Cu dispersion and enhancing the hydrogen activation ability.32 This contributed to the higher catalytic performance in hydrogenolysis of ethyl levulinate compared to unpromoted Cu/Al2O3.23
Thus, it can be assumed that the use of Al2O3, ZnO, NiO and CoOx can promote the activity of Cu-based hydrogenolysis catalysts through some changes in surface properties and influence on the Cu active site. However, the relationship of those structural changes with subsequent consequences on the hydrogenolysis activity of Cu/ZnO and Cu/ZrO2 catalysts modified by these promoters has not yet been described in detail. Therefore, this work aims to assess how the selected promoters can improve the catalytic activity of Cu/ZnO and Cu/ZrO2 in the hydrogenolysis of DMA towards HDOL. This is facilitated by considering the individual effect of each of these promoters on Cu metal sites with respect to the final catalysts and their performance.
Experimental
Catalyst synthesis
In this work, a total of eight catalysts targeted for Cu-loading of 8 wt% were prepared by the deposition–precipitation (DP) method using ZnO (>98% ZnO, Albemarle Corporation, USA) or ZrO2 (SZ31164, Saint-Gobain NorPro, USA) as a support. The promoted Cu catalysts contained NiO, CoOx, ZnO or Al2O3 with a molar ratio of Cu-to-metal promoter equal to 4-to-1. The promoters were introduced from an aqueous solution of Ni(NO3)2·6H2O (>98%, Carl Roth GmbH, Germany), Co(NO3)2·6H2O (>98%, Sigma Aldrich), Zn(NO3)2·6H2O (99.6%, Lach:Ner s.r.o., Czech Republic), or Al(NO3)3·9H2O (98.1%, Lach:Ner s.r.o., Czech Republic), respectively. Table 1 summarizes the list of the prepared catalysts including the used amount of each precursor and the catalyst names. In the DP method, Cu(NO3)2·3H2O was dissolved in 500 mL of distilled water, then mixed with urea (99.5%, penta, s.r.o., Czech Republic) (molar ratio of 1-to-5) and placed in an ultrasonic bath to dissolve homogeneously. The solution was then transferred in a 1-liter round bottom flask, where the support was added under constant stirring at 300 RPM and slowly heated to 90 °C at a heating rate of 60 °C h−1. The suspension was stirred for 24 hours at 90 °C and then cooled down before filtering it. The final pH of the suspension was equal to 7. The obtained sample was dried at 90 °C for 16 h (heating rate of 60 °C h−1) and calcined at 350 °C for 3 h (heating rate of 120 °C h−1). In the case of the promoted catalysts, the second metal precursor was added to the copper nitrate solution during the first step, while the rest of the procedure was the same.| Catalyst name | Cu(NO3)2·3H2O mass (g) | Promoter precursor | Promoter precursor mass (g) | Support | Support mass (g) |
|---|---|---|---|---|---|
| Cu/ZnO_DP | 1.52 | — | — | ZnO | 4.60 |
| CuAl/ZnO_DP | 1.52 | Al(NO3)3·9H2O | 0.59 | ZnO | 4.53 |
| CuNi/ZnO_DP | 1.52 | Ni(NO3)2·6H2O | 0.46 | ZnO | 4.48 |
| CuCo/ZnO_DP | 1.52 | Co(NO3)2·6H2O | 0.46 | ZnO | 4.48 |
| Cu/ZrO2_DP | 1.52 | — | — | ZrO2 | 4.60 |
| CuZn/ZrO2_DP | 1.52 | Zn(NO3)2·6H2O | 0.47 | ZrO2 | 4.47 |
| CuNi/ZrO2_DP | 1.52 | Ni(NO3)2·6H2O | 0.46 | ZrO2 | 4.48 |
| CuCo/ZrO2_DP | 1.52 | Co(NO3)2·6H2O | 0.46 | ZrO2 | 4.48 |
Catalyst characterization
XRF was used for the determination of the metal content in the calcined catalysts using an ARL 9400 XP spectrometer equipped with a rhodium lamp. XRD was used for the determination of the phase composition of the calcined catalysts before and after the reaction using a PANalytical X'Pert3 Powder diffractometer and Cu Kα radiation. The XRD patterns were recorded in the range of 2θ = 5–90°. The crystallite size of the Cu species was estimated using Scherrer's equation using the reflections at 2θ = 38.6° and 43.3° for CuO and Cu, respectively.33 Nitrogen physisorption was measured at 77 K using a static volumetric adsorption system (TriFlex analyzer, Micromeritics, USA). The samples were degassed at 473 K (12 hours) prior to N2 adsorption analysis, to obtain a clean surface. The adsorption isotherms were fitted using the Brunauer–Emmett–Teller (BET) method for the specific surface area34 and the BJH method for the pore size distribution.35 The reducibility of the calcined catalysts was determined using a ChemStar TPx instrument (Quantachrome Instruments, USA) with a TCD detector. The samples were exposed to a reducing gas mixture containing 10 vol% of hydrogen in argon with a flow of 50 mL min−1. A U-shaped reactor with a sample (typically 0.15 g) was placed in a furnace and treated with the reducing gas at a heating rate of 5 °C min−1 from room temperature up to 600 °C. The hydrogen consumption was calculated using a calibration curve. To evaluate the active copper specific surface area, the reactive frontal chromatography (RFC) method using N2O was used. An Autochem II 2920 (Micromeritics, USA) connected on-line to a quadrupole mass spectrometer RGA 200 (Prevac, Poland) was used. The detailed procedure was described previously.3Raman spectra were measured with a dispersion Raman spectrometer DXR Raman Microscope (Thermo Scientific) equipped with an Olympus confocal microscope. A diode-excited Nd:YAG laser with a wavelength of 532 nm and an input power of 10 mW served as the excitation source. A grid of 900 scratches per mm was used. A multi-channel thermoelectrically cooled CCD camera served as the detector. The samples were measured with a 100× objective with a measurement track of approx. 1 μm2 through a 50 μm alloy aperture. The measurement took place with a power of 0.3 mW, a measuring time of 60 s and with 10 spectrum accumulations. Fourier transform infrared spectra (FTIR) were recorded on a Bruker Alpha II FTIR spectrometer equipped with an attenuated total reflection (ATR) platinum diamond in the region of 450 to 4000 cm−1. The temperature-programmed desorption (Micromeritics Instrument – AutoChem II 2920) of pyridine and CO2 (pyr-TPD; CO2-TPD) was employed to determine the number of acid and base sites, respectively. Prior to the pyridine or CO2 adsorption, the calcined samples were in situ reduced in a flow of 10% H2/Ar at 250 °C (temperature rate of 4 °C min−1) for 60 min. After the reduction, the H2 desorption in a He flow at 250 °C was carried out. Then after cooling to 150 ° C or 40 °C, pyridine and CO2 were adsorbed, respectively, and the samples were heated up to 600 °C in He. The desorbed gas was analysed using a TCD and mass spectrometer (MKS Cirrus 2 Analyzer). The detailed procedure is described in ref. 17. The elemental organic analysis (CHNS) was carried out on an Elementar Vario EL Cube for spent catalysts.
Catalyst testing
Hydrogenolysis of dimethyl adipate (DMA) was performed in a fixed-bed reactor between two layers of glass spheres (0.3–0.4 mm size). For every test, 4 g of calcined catalyst (granulated to particles with a diameter of 0.1–0.4 mm) was loaded into the reactor. Then, the catalyst was reduced in situ at 220 °C in a 10 vol% H2/N2 atmosphere. After reduction, DMA (>99%, Sigma Aldrich, USA) and hydrogen (99.9%, SIAD Czech, s.r.o., Czech Republic) as feedstocks were fed into the reactor. The following reaction conditions were used during the catalytic tests: a H2 pressure of 100 bar, a WHSV of 4 gDMA h−1 gcat−1, a H2/DMA molar ratio of 8, and temperatures of 205, 220 and 250 °C. After 2 hours since the reaction conditions were stabilized, the collection of reaction product samples commenced. The collected samples were diluted in methanol and analyzed using a GC-FID (ULTRA-1 capillary column, 15 m length, 0.32 mm i.d.).The DMA conversion and selectivity to products were calculated using eqn (1) and (2), respectively. Due to the absence of cracking reactions (confirmed by the GC analysis of the gaseous products), the C6 backbone of DMA as well as of the reaction products was used as the basis for the selectivity calculation (eqn (2)). Methanol was excluded because it was present both in the liquid and gaseous product streams, which prevented its accurate quantification.
 | (1) |
 | (2) |
The intrinsic hydrogenolysis activity of a catalyst expressed as the turnover frequency (TOFH) was calculated using eqn (3).
 | (3) |
 | (4) |
 | (5) |
Results and discussion
Catalyst characterization
The elemental composition of all the prepared calcined catalyst precursors was analyzed by XRF (Table 2). The Cu content ranged from 8.4 to 10.2 wt% deviating from the targeted 8 wt%. This deviation was partly due to support interference during XRF measurements (for more details see the ESI†). Consequently, all samples exhibited higher Cu content than was targeted, with the deviation being more pronounced in the case of ZrO2. The efficiency of the deposition–precipitation method was further confirmed by the analysis of the filtrate, which showed negligible traces of metals (<1 mgCu l−1). The content of promoters ranged from 1.2 to 2.7 wt%. However, while evaluating the molar Cu/promoter ratio (targeted to 4), all the values fell within the range of 2.8 to 5.9, except for CuNi/ZrO2_DP. The influence of the support used might have contributed to this deviation, but this effect was not studied for promoters.| Catalyst name | w Cu (wt%) | w ZnO (wt%) | w ZrO2 (wt%) | w Al2O3 (wt%) | w NiO (wt%) | w CoO (wt%) | Molar Cu/promoter | d CuO (nm) | S BET (m2 gcat−1) | PV (cm3 g−1) | H2-uptake (mmol g−1) |
|---|---|---|---|---|---|---|---|---|---|---|---|
| a The commercial ZnO support contained 0.5 wt% of Al2O3. b Apparently lowered valued due to the initial Al2O3 content. c Calculated for the reflection at 38.8°. | |||||||||||
| ZnO | — | 99 | — | 0.5a | — | — | — | — | 37 | 0.18 | — |
| Cu/ZnO_DP | 8.4 | 91 | — | 0.5a | — | — | — | 9 | 43 | 0.17 | 1.5 |
| CuAl/ZnO_DP | 8.8 | 88 | — | 2.5a | — | — | 2.8b | 14 | 33 | 0.17 | 1.4 |
| CuNi/ZnO_DP | 8.6 | 87 | — | 0.5a | 2.6 | — | 3.9 | 13 | 54 | 0.22 | 1.9 |
| CuCo/ZnO_DP | 9.1 | 87 | — | 0.5a | — | 2.7 | 4.0 | 13 | 47 | 0.19 | 1.9 |
| ZrO2 | — | — | 100 | — | — | — | — | — | 93 | 0.27 | — |
| Cu/ZrO2_DP | 10.2 | — | 86 | — | — | — | — | 13 | 87 | 0.21 | 1.7 |
| CuZn/ZrO2_DP | 9.4 | 2.4 | 86 | — | — | — | 4.9 | 15 | 82 | 0.22 | 1.7 |
| CuNi/ZrO2_DP | 9.0 | — | 88 | — | 1.2 | — | 8.2 | 13 | 85 | 0.23 | 1.6 |
| CuCo/ZrO2_DP | 9.5 | — | 87 | — | — | 1.9 | 5.9 | 12 | 85 | 0.22 | 1.7 |
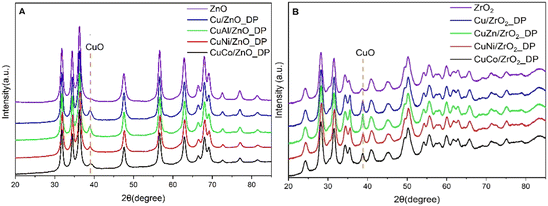
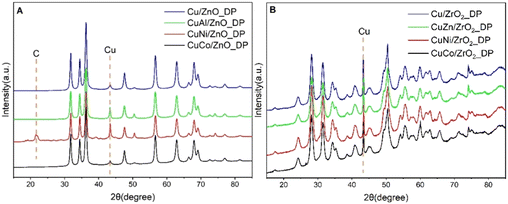
The phase composition of the calcined catalysts was determined by X-ray diffraction (Fig. 1) and the calculated size of the CuO crystallites using Scherrer's equation is reported in Table 2. The characteristic reflection of CuO was determined at the 2θ = 38.8° position for both promoted and unpromoted catalysts. On the other hand, there were not any reflections found originating from the promoters due to their low concentration in the promoted catalysts. It was reported that smaller CuO crystallites led to a larger active Cu surface area and a better dispersion, and, thus, to a higher catalytic activity in DMA hydrogenolysis.20 As can be seen from Table 2, the average CuO crystallite size in all ZnO-supported catalysts was comparable to that in ZrO2-supported catalysts, with Cu/ZnO_DP showing the smallest crystallite size (9 nm). Interestingly, the addition of promoters did not minimize the CuO crystallite size as was expected. Compared to the impregnated Cu/ZnO, the CuO particle size was decreased (from 15 to 9 nm).18
The pure supports and calcined catalyst precursors were characterized by N2 physisorption to assess the catalyst specific surface area (SBET) and porosity (Table 2). In the case of the ZnO-supported catalysts, the SBET mostly increased after promoter addition from 37 up to 54 m2 gcat−1, while in the case of ZrO2-supported catalysts, the SBET dropped about 5–10% from 93 to 87–82 m2 gcat−1. Nonetheless, the changes were not significant being within the experimental error. Only one significant increase was observed when unpromoted Cu/ZnO_DP was compared to CuNi/ZnO_DP and CuCo/ZnO_DP, where the SBET increased from 43 m2 gcat−1 to 54 and 47 m2 gcat−1, respectively. A similar positive effect on the BET surface area after the addition of NiO to Cu/SiO2 was already observed.36 The pore size distribution curves are present in Fig. SI2.† The ZrO2-supported catalysts showed a narrow pore size distribution with mesopores of 7 nm. When adding a promoter, the average mesopore size was reduced by 0.2 nm. On the other hand, the ZnO-supported catalysts did not show a higher level of porosity.
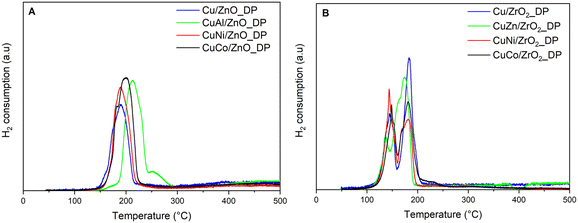
The effect of the support and promoters on the CuO reducibility was monitored by H2-TPR (Fig. 2). Compared to the reduction of bulky CuO occurring at about 300 °C,17 all supported catalysts showed easier reducibility.
The ZrO2-supported catalysts in Fig. 2B showed two types of Cu species with reduction peaks in the range of 100–220 °C. Some authors suggested that sequential reduction, i.e. CuII → CuI → Cu0,37 took place. However, due to the different H2 uptake in both deconvoluted peaks (Table SI1†) and the immediate reduction of CuI to Cu0, we concluded that there were rather two types of CuO species – isolated highly dispersed CuO species (lower temperature peak) and bulky CuO species (higher temperature peak).38 All ZrO2-based calcined precursors showed a higher amount of the second type of CuO, except for CuNi/ZrO2_DP, which indicated that the introduction of NiO improved the dispersion of Cu species or influenced the interaction of CuO with ZrO2, and all were completely reduced up to 210 °C. In the case of ZnO-based catalysts (Fig. 2A), it was difficult to distinguish between both CuO types, revealing their uniform distribution despite the reduction pattern being shifted to higher temperatures by about 20–40 °C as Cu and ZnO have mutual strong metal–support interaction.39 The measured H2 consumption confirmed that all samples were completely reduced (Table 2 and Fig. SI1†). Only two samples, CuCo/ZnO_DP and CuNi/ZnO_DP, showed a higher H2 consumption of about 1.9 mmol g−1. For CuNi/ZnO_DP, this corresponded to the synergic effect of CuO–NiO, where the reduction of NiO occurs also at lower temperatures such as those we used.40 Similarly, when CuO is doped with CoOx, then CuO contributes to the easier reducibility of CoOx species.41 Therefore, the presence of the reduced Co species could be beneficial as it would increase the surface availability of dissociated H2 which might help in hydrogenolysis.23 Interestingly, this effect was not observed when using ZrO2, indicating that ZnO promotes the reducibility of CuOCoOx rather than ZrO2.
For the catalytic activity, the size of the final copper active surface area (SCu) is essential. As seen from Table 3, the addition of Al2O3 to ZnO-supported and ZnO to ZrO2-supported catalysts led to a decrease in the SCu while NiO- and CoOx-promoted catalysts reached similar or even higher SCu compared to unpromoted Cu/ZnO_DP and Cu/ZrO2_DP. An increase in the SCu and Cu dispersion due to a decrease in the Cu crystallite size was observed by Xi et al. when co-precipitated Cu/ZnO was promoted by 1 mol% of Ni42 and highly dispersed Cu nanoparticles were formed by the synergic effect of CuO–Co3O4.43 It can be further estimated how the particle size changed during the reduction. Compared to the original CuO particle size in Table 2, the size of Cu particles increased due to the hydrogen treatment more (increase by 30–70%) in the case of ZrO2-supported Cu nanoparticles than in the case of most of the ZnO-supported catalysts (increase by 0–55%). The least stabilizing promoter was Al2O3 used in CuAl/ZnO_DP, where Cu particles showed an increase of 143%.
| Name | S Cu (m2 gcat−1) | D Cu (%) | d Cu (nm) | n pyr (μmol g−1) | n CO2 (μmol.g−1) |
|---|---|---|---|---|---|
| a Calculated from N2O chemisorption using eqn (5). b Calculated from N2O chemisorption using eqn (4). | |||||
| ZnO | — | — | — | 0 | 7 |
| Cu/ZnO_DP | 4.0 | 5.1 | 14 | 2 | 18 |
| CuAl/ZnO_DP | 1.7 | 2.1 | 34 | 4 | 42 |
| CuNi/ZnO_DP | 4.1 | 3.6 | 13 | 4 | 33 |
| CuCo/ZnO_DP | 4.3 | 3.4 | 15 | 2 | 46 |
| ZrO2 | — | — | — | 74 | 127 |
| Cu/ZrO2_DP | 3.3 | 3.2 | 22 | 2 | 181 |
| CuZn/ZrO2_DP | 2.3 | 2.5 | 24 | 9 | 200 |
| CuNi/ZrO2_DP | 4.3 | 3.2 | 17 | 4 | 185 |
| CuCo/ZrO2_DP | 3.7 | 2.9 | 17 | 4 | 221 |
The acid–base sites play an important role in the hydrogenolysis of esters as they affect the adsorption of reactants,44 contribute to side reactions22 and ultimately modify the intrinsic activity and selectivity of the catalysts.45 Thus, CO2-TPD (Table 3, Fig. SI3†) and pyr-TPD (Table 3, Fig. SI4†) were used to quantify the base and acid sites in the reduced catalyst precursors, respectively. All samples, but the neat ZrO2 support, contained only a negligible number of acid sites (<10 μmol g−1). In contrast, the number of basic sites (18–221 μmol g−1) varied greatly. In terms of basicity, ZrO2-based catalysts showed an order of magnitude higher number of basic sites (181–221 μmol g−1) compared to ZnO-based catalysts (18–46 μmol g−1).
Also, the strength of those sites differed, where ZrO2-based catalysts had weak basic sites desorbing CO2 in the range of 50–250 °C. These sites were inherent to the ZrO2 support as proven by a blank experiment of CO2 adsorption on the original ZrO2 support having virtually no medium and strong basic sites (i.e. those retaining CO2 to temperatures >300 °C). The second CO2 desorption peak at 250–450 °C corresponded to the sites formed due to the Cu incorporation to the ZrO2 support. In ZnO-supported catalysts, weak and medium basic sites were present (i.e. those retaining CO2 to temperatures at 300 to 500 °C). In contrast to ZrO2-supported catalysts, the weak basic sites in ZnO-based catalysts resulted from the introduction of Cu and its promoters, whereas the medium basic sites originated from the ZnO support itself.
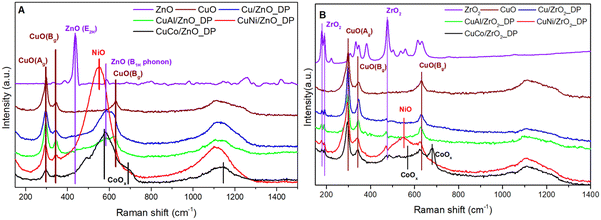
To understand the phases and lattice vibrational properties of the samples, Raman spectroscopy was performed (Fig. 3). Fig. 3A depicts the spectra of ZnO-supported catalyst precursors. CuO particles show three characteristic peaks at 298, 344 and 632 cm−1 assigned to Ag, Bg and Bg, respectively, being three Raman active optical modes.46 A broad peak at 1100 cm−1 was suggested to be the second harmonic mode of CuO at 632 cm−1.47 The original ZnO Raman spectra showing an intensive band at 438 cm−1 assigned to the E2(high) mode of ZnO (wurtzite)48 was subtracted from the Raman spectra of ZnO-supported catalysts. Although XRD did not confirm the presence of promoters due to their low concentration, the Raman spectroscopy was more sensitive showing some specific bands. The presence of NiO was shown at 552 cm−1 (additionally supported at 1110 cm−1),49 corresponding to the NiO-like particles strongly bonded to the support. The characteristic bands of CoOx appeared at 470, 515 and 680 cm−1 (ref. 50) in the Raman spectra which indicated the presence of CoOx. The mutual Co–Zn interaction and Co incorporation into the ZnO lattice typically result in the broadening of the 580 cm−1 band.51
The Raman spectra of ZrO2-supported catalyst precursors are shown in Fig. 3B. In Cu/ZrO2, three bands corresponding to bulk CuO were visible at 290, 340 and 630 cm−1. Compared to ZnO-supported catalysts, there is a little shift coming from i) larger particle size and ii) different CuO–support interactions. Despite the background of the neat support being subtracted, the residual intensity of the support was still intense and the peak at 470 cm−1 confirmed the presence of monoclinic zirconia.52 Compared to ZnO-supported catalysts, there is no intense contribution of promoters to the spectra, except for the peak at 680 cm−1 in the case of CuCo/ZrO2_DP due to Co–Zr interaction.50
In summary, the characterization data showed that the ZnO support stabilized better Cu nanoparticles for ester hydrogenolysis, while ZrO2 facilitated their reducibility. ZrO2-supported catalysts had a more pronounced basic character compared to ZnO-supported catalysts which might influence the catalyst selectivity. On the other hand, among the promoters NiO and CoOx showed promising influence on crucial parameters such as SBET, SCu and Cu dispersion due to their reducible properties which might have a positive impact on the reaction, while ZnO and Al2O3 had no such positive effect.
Catalytic results
Unpromoted and promoted calcined catalyst precursors were reduced at 220 °C in situ in a flow reactor and tested at T = 205–250 °C and pH2 = 100 bar in the hydrogenolysis of dimethyl adipate (DMA), where the desired product was hexane-1,6-diol (HDOL). The DMA conversion and HDOL selectivity were calculated as key parameters to evaluate the performance of the catalysts. Fig. 4 presents the conversion of DMA over the promoted and unpromoted ZnO- and ZrO2-supported Cu catalysts as a function of the reaction temperature.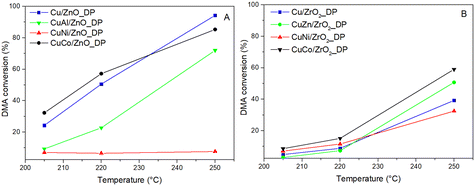 | ||
| Fig. 4 Dependence of DMA conversion on reaction temperature over Cu-based catalysts supported on ZnO (A) and ZrO2 (B) (pH2 = 100 bar, WHSV = 4 h−1). | ||
In general, ZnO-supported catalysts achieved higher DMA conversions than the ZrO2-supported ones which is a result of better Cu dispersion. The highest DMA conversion of 94% was over Cu/ZnO_DP having the highest Cu dispersion, while Cu/ZrO2_DP reached a DMA conversion of only 40%. In the context of our systematic studies, Cu/ZnO_DP increased the DMA conversion four times compared to the previously reported Cu/ZnO catalyst prepared by the wet impregnation method (tested under the same conditions with the same Cu loading).18 This was due to the use of the DP method, during which the Cu precursor is transformed into a Cu(NH3)42+ cation that is better attracted by the support surface.53 This resulted in twice smaller CuO particles (8 vs. 15 nm) and larger SCu (4.0 vs. 1.0 m2.g−1) in Cu/ZnO_DP compared to the previously reported wet-impregnated Cu/ZnO_WI.20 In the case of Cu/ZrO2_DP, the structural properties and catalytic performance were similar to those of the wet-impregnated catalyst.18 Thus, the choice of the preparation method is not as essential when ZrO2 is used as a support compared to the use of ZnO.
Besides the influence of the synthesis method and support choice, the promoter effect was elucidated. Both CoOx-containing catalysts as well as CuZn/ZrO2_DP reached comparable or higher conversion compared to their unpromoted benchmarks. Therefore, ZnO is not only a very good support, but also an efficient promoter of hydrogenolysis catalysts. The improved performance of Co-containing catalysts could be due to the increased availability of adsorbed hydrogen on the catalyst surface proved by H2-TPR (Table 3) or the increased Cu surface area due to the presence of CoOx when the Cu particles were well-stabilized. On the other hand, NiO and Al2O3 promoters did not exhibit any positive effect on DMA hydrogenolysis. This is particularly surprising in the case of CuNi/ZnO_DP that exhibited a high Cu surface area (Table 3) but showed the lowest DMA conversion among the tested catalysts. To understand the influence of supports and promoters on the selectivity, the HDOL selectivity as a function of the DMA conversion was discussed (Fig. 5). The stability of the studied catalysts was investigated over periods of 8 h for all but one catalyst (Table SI3†) and 28 h for Cu/ZrO2_DP (Fig. SI6†). All catalysts showed negligible fluctuations in DMA conversion, remaining within the range of an experimental error, which indicates stable behaviour.
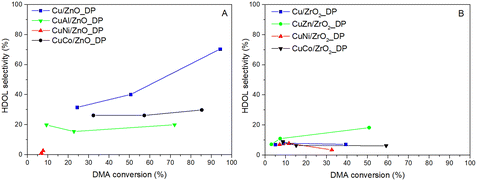 | ||
| Fig. 5 Dependence of selectivity to HDOL on DMA conversion for catalysts supported on ZnO (A) and ZrO2 (B) (pH2 = 100 bar, WHSV = 4 h−1, T = 205–250 °C). | ||
As seen in Fig. 5, the selectivity to HDOL did not follow the same trend for all catalysts. Generally, a higher HDOL selectivity was achieved over ZnO-based catalysts rather than over the ZrO2-based ones as the former afforded higher conversion. When comparing the HDOL selectivity at the DMA conversion of 35%, the following selectivity order was observed: Cu/ZnO_DP > CuCo/ZnO_DP > CuAl/ZnO_DP > CuZn/ZrO2_DP >> other ZrO2-supported Cu catalysts. This again evidences that ZnO is essential for reaching high HDOL selectivity that could be due to i) a significantly lower number of acid–base sites supporting the formation of transesterification by-products17 and/or ii) the synergic effect of Cu–Zn better adsorbing DMA and favouring HDOL formation.3 Taking this into account, the increased HDOL selectivity over CuZn/ZrO2_DP compared to the other ZrO2-based catalysts (HDOL selectivity was doubled) and the relatively high number of basic sites in the ZrO2-supported catalysts in comparison with the ZnO-supported catalysts (Table 3) indicate a direct intrinsic effect of ZnO on the selectivity. Therefore, there might be specific sites on ZnO or at the Cu–ZnO interface responsible for the high HDOL selectivity.
To produce the desired HDOL, both ester groups in DMA have to be hydrogenolyzed. When only one group undergoes the hydrogenolysis, methyl 6-hydroxyhexanoate (1HMEol) is produced. Its selectivity was found to be decreasing with increasing DMA conversion for all catalysts (Fig. 6A and B) as it is the primary product in the reaction scheme. Besides, and more importantly, the hydrogenolysis of DMA is accompanied by transesterification reactions. As DMA, HDOL, and 1HMEol have either ester or hydroxyl groups, they can react with each other via these groups to form molecules having two hexane fragments connected by an ester group (i.e. transesterification products).54 These products can undergo further transesterification to afford even heavier products (typically with 3 and to a lesser extent 4 hexane fragments). For the sake of clarity, we grouped them all under the name transesterification (TR) products. The TR product selectivity has an opposite tendency (Fig. 6C and D). Compared to our previous results and different Cu-supported catalysts,17,18 the TR formation over these catalysts prepared by deposition–precipitation was lower and the Cu/ZnO_DP catalyst reached the lowest TR selectivity due to the presence of ZnO having the lowest number of acid–base sites (Table 3). The use of other promoters, except for ZnO, increased the formation of TR products due to the increased acid–base sites. Therefore, finding a promotor not increasing the acid–base character is challenging. The high initial formation of TR products in the case of CuNi/ZnO_DP signified that the catalyst surface might be soon coked which partially contributes to the explanation for its low hydrogenolysis activity. To complete the list of detected products, it was found that ZrO2-based catalysts supported the formation of cyclopentanol (CPOL) (Fig. 6E and F) with selectivity from 3 to 9%. CPOL was formed by intramolecular cyclization affording cyclopentanone that underwent consecutive hydrogenation of the carbonyl group.
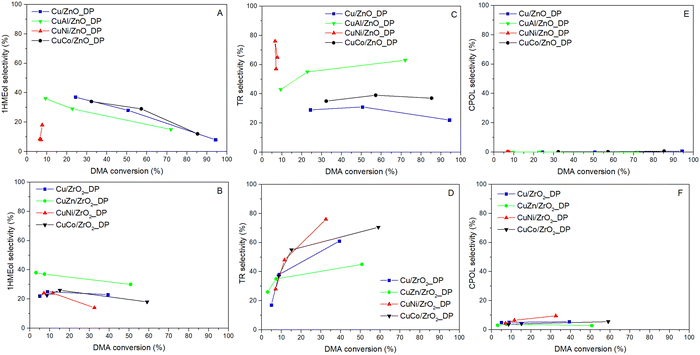 | ||
| Fig. 6 Dependence of selectivity to by-products on DMA conversion for catalysts supported on ZnO (upper row – A, C and E) and ZrO2 (lower row – B, D and F) (pH2 = 100 bar, WHSV = 4 h−1). | ||
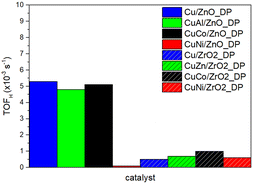
Although all catalysts have a similar Cu loading, the metal–promoter–support interaction affected the values of SCu. To compare the catalyst activity, TOFH related to hydrogenolysis products only was calculated. As shown in Fig. 7, the use of ZnO resulted in increased catalyst activity more than five times compared to the use of ZrO2 (except for CuNi/ZnO_DP reaching low DMA conversion). Since TOFH already included a factor describing better properties of the Cu active site in the case of ZnO-based catalysts, this indicated that there is an additional effect of ZnO facilitating ester adsorption. Additionally, the investigated promoters did not significantly enhance either catalyst activity or selectivity. In contrast, the choice of the support, in particular ZnO, is more important to ensure higher HDOL selectivity.
Spent catalyst
As the catalysts were reduced and used in DMA hydrogenolysis, their structural properties might have changed. To describe that, XRD, FTIR, and ELOA were performed. The XRD patterns of the spent catalysts (Fig. 8) showed metallic Cu0 as the only Cu phase. This allowed us to evaluate the Cu crystallite size which increased 2–4 times compared to that of CuO in the calcined catalysts (Table 4). Cu nanoparticles deposited on ZnO showed higher stability (14–34 nm) and were of the same size for both reduced (determined by N2O-RFC, Table 3) and spent catalysts signifying that no change occurred during the hydrogenolysis. On the other hand, particles deposited on ZrO2 were more liable to sintering (34–59 nm) and increased 2–3 times during hydrogenolysis compared to the reduced catalysts. Using the deposition–precipitation method, the stability of Cu particles in the case of Cu/ZrO2_DP (34 nm) was improved compared to the impregnated catalyst Cu/ZrO2_IWI (60 nm).17 Among the used promoters, CoOx stabilized better the Cu particles. As shown above, both Cu/ZnO_DP and CuCo/ZnO_DP reached the highest DMA conversion which also corresponds to their smallest Cu crystallites of 14 nm found in the spent samples. Moreover, there was an extra peak at 21.9° in the case of CuNi/ZnO_DP which can be attributed to carbon55 that was deposited on the catalyst surface during the reaction.| Sample name | d Cu (nm) | w C (wt%) | w H (wt%) | H/C (mol mol−1) |
|---|---|---|---|---|
| a Calculated for the reflection at 43.2°. | ||||
| Cu/ZnO_DP | 14 | 1.8 | 0.41 | 3.6 |
| CuAl/ZnO_DP | 34 | 1.7 | 0.42 | 4.0 |
| CuNi/ZnO_DP | 27 | 12 | 1.49 | 2.0 |
| CuCo/ZnO_DP | 14 | 2.3 | 0.51 | 3.5 |
| Cu/ZrO2_DP | 34 | 3.6 | 0.64 | 2.8 |
| CuZn/ZrO2_DP | 59 | 3.8 | 0.65 | 2.7 |
| CuNi/ZrO2_DP | 54 | 3.9 | 0.71 | 2.9 |
| CuCo/ZrO2_DP | 57 | 3.8 | 0.64 | 2.7 |
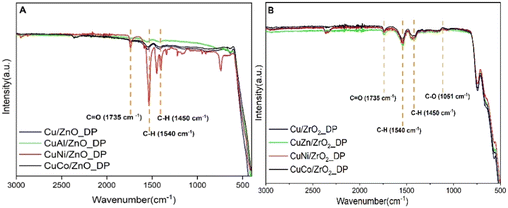
To probe more the coke formation in the spent catalysts, FTIR spectroscopy was used (Fig. 9). In both types of spent samples, three typical regions were observed at 1735, 1540, and 1450 cm−1. The band at 1735 cm−1 was ascribed to C![[double bond, length as m-dash]](https://www.rsc.org/images/entities/char_e001.gif) O bending vibrations56 which might be due to adsorbed ester species overlapping with the FTIR spectrum of DMA (Fig. SI5†). Simultaneously, the bands below 1440 cm−1 were attributed to C–H vibrations matching both in DMA and HDOL. There was also a band at 1051 cm−1 assigned to C–O stretching vibrations.57 Nonetheless, the band at 1540 cm−1, the most intense in CuNi/ZnO_DP, was not assigned to any specific functional group. The absorption band at 2380 cm−1 indicates the presence of CO2 from the environment.58
O bending vibrations56 which might be due to adsorbed ester species overlapping with the FTIR spectrum of DMA (Fig. SI5†). Simultaneously, the bands below 1440 cm−1 were attributed to C–H vibrations matching both in DMA and HDOL. There was also a band at 1051 cm−1 assigned to C–O stretching vibrations.57 Nonetheless, the band at 1540 cm−1, the most intense in CuNi/ZnO_DP, was not assigned to any specific functional group. The absorption band at 2380 cm−1 indicates the presence of CO2 from the environment.58
To quantify the amount of coke formed, elemental analysis of the spent catalysts was performed (Table 4). Comparing both groups, ZnO-supported catalysts showed lower C content compared to ZrO2-supported catalysts highlighting that ZnO-based catalysts were less prone to coking plausibly due to their less pronounced acid–base properties that were responsible for higher formation of TR products. The molar H-to-C ratio was >3 in ZnO-supported catalysts (except for CuNi/ZnO_DP) while it was <3 in ZrO2-supported catalysts indicating probably different types of deposited coke. As expected from its low hydrogenolysis activity and indications by XRD and FTIR catalyst characterization, CuNi/ZnO_DP showed the highest carbon content.
Conclusions
Cu nanoparticles were deposited on ZrO2 and ZnO supports using a deposition–precipitation method and further promoted by Al2O3, ZnO, CoOx or NiO for dimethyl adipate hydrogenolysis. Despite all calcined catalysts showing similar CuO crystallites <15 nm, the strong metal–support interaction of Cu with ZnO resulted in better stabilization of Cu particles during reduction and ester hydrogenolysis. These particles were 2–4 times smaller compared to those supported on ZrO2, leading to the superior catalytic performance of ZnO-supported catalysts (except CuNi/ZnO), as reflected in the DMA conversion and catalyst activity monitored by TOF. The use of ZnO as a support increased selectivity to the desired hexane-1,6-diol due to the fewer acid–base sites. Also, the resistance to coke formation was higher when using ZnO as a support. Among the studied promoters, only CoOx enhanced the Cu surface area and better stabilized Cu nanoparticles, resulting in a larger Cu surface area. However, the presence of selected promoters increased the number of acid–base sites resulting in the higher formation of transesterification by-products. Notably, ZnO as a promoter in the Cu/ZrO2 catalyst also increased the desired hexane-1,6-diol selectivity compared to the other promoters. This underscores the essential role of ZnO, both as a support and a promoter, enhancing the performance of hydrogenolysis catalysts. Interestingly, the formation of cyclopentanol over ZrO2-supported catalysts was observed, suggesting a potential alternative production pathway that warrants further investigation.Data availability
The data supporting this article have been included as part of the ESI.† All the original data are available at internal repository and the access might be obtained via the corresponding author.Author contributions
Aubrecht J.: investigation, data curation, visualization, writing – original draft. Pospelova V.: investigation, data curation, visualization, writing – original draft. Saha S.: investigation, visualization, writing – original draft. Lhotka M.: investigation. Paterová I.: investigation. Kubička D.: writing – review & editing, supervision, conceptualization, methodology, funding acquisition.Conflicts of interest
There are no conflicts to declare.Acknowledgements
Financial support from the Czech Science Foundation (project no. GA20-28093S) is greatly acknowledged. N2O-RFC characterization results were obtained by using the Large Research Infrastructure ENREGAT supported by the Ministry of Education, Youth and Sports of the Czech Republic (project no. LM2018098). The authors are grateful to Simona Randáková (UCT Prague, Czech Republic) for XRF analyses, Jana Cibulková (UCT Prague, Czech Republic) for XRD analyses, Ladislav Lapčák (UCT Prague, Czech Republic) for Raman analyses, and Dagmar Fridrichová and Kateřina Pacultová for N2O chemisorption measurements (VSB-TUO, Czech Republic).Notes and references
- P. T. Anastas, M. M. Kirchhoff and T. C. Williamson, Appl. Catal., A, 2001, 221, 3–13 CrossRef CAS.
- I. Delidovich and R. Palkovits, Green Chem., 2016, 18, 590–593 RSC.
- V. Pospelova, J. Aubrecht, O. Kikhtyanin, K. Pacultová and D. Kubička, ChemCatChem, 2019, 11, 2169–2178 CrossRef CAS.
- R.-P. Ye, L. Lin, Q. Li, Z. Zhou, T. Wang, C. K. Russell, H. Adidharma, Z. Xu, Y.-G. Yao and M. Fan, Catal. Sci. Technol., 2018, 8, 3428–3449 RSC.
- D. Ren, X. Wan, F. Jin, Z. Song, Y. Liu and Z. Huo, Green Chem., 2016, 18, 5999–6003 RSC.
- L. Ma, D. Trimm and M. Wainwright, Top. Catal., 1999, 8, 271–277 CrossRef CAS.
- S. Gonzalez-Cortes and F. E. Imbert, Advanced Solid Catalysts for Renewable Energy Production, IGI Global, 2018 Search PubMed.
- T. Turek, D. L. Trimm and N. W. Cant, Catalysis Reviews, 1994, 36, 645–683 CrossRef CAS.
- A. A. Strekalova, A. A. Shesterkina and L. M. Kustov, Catal. Sci. Technol., 2021, 11, 7229–7238 RSC.
- P. Yuan, Z. Liu, T. Hu, H. Sun and S. Liu, React. Kinet., Mech. Catal., 2010, 100, 427–439 CAS.
- D. R. Vardon, A. E. Settle, V. Vorotnikov, M. J. Menart, T. R. Eaton, K. A. Unocic, K. X. Steirer, K. N. Wood, N. S. Cleveland, K. E. Moyer, W. E. Michener and G. T. Beckham, ACS Catal., 2017, 7, 6207–6219 CrossRef CAS.
- X. Li, J. Luo and C. Liang, Mol. Catal., 2020, 490, 110976 CrossRef CAS.
- W. Tolek, N. Nanthasanti, B. Pongthawornsakun, P. Praserthdam and J. Panpranot, Sci. Rep., 2021, 11, 9786 CrossRef CAS PubMed.
- X. Gao, G. Zhao, L. Miao, L. Li, J. Li and Z. Zhu, ACS Appl. Nano Mater., 2023, 6, 17637–17646 CrossRef CAS.
- X. Gao, G. Zhao, L. Miao, L. Li and Z. Zhu, Catal. Sci. Technol., 2023, 13, 5938–5944 RSC.
- X. Gao, G. Zhao, L. Miao, L. Li, J. Li and Z. Zhu, Ind. Eng. Chem. Res., 2024, 63, 1261–1270 CrossRef CAS.
- J. Aubrecht, V. Pospelova, O. Kikhtyanin, M. Veselý and D. Kubička, Catal. Today, 2022, 387, 61–71 CrossRef CAS.
- J. Aubrecht, V. Pospelova, O. Kikhtyanin, M. Lhotka and D. Kubička, Catal. Today, 2022, 397–399, 173–181 CrossRef CAS.
- J. Aubrecht, O. Kikhtyanin, V. Pospelova, I. Paterová, D. Kubička, F. Zaccheria, N. Scotti and N. Ravasio, Catal. Today, 2023, 424, 113843 CrossRef CAS.
- V. Pospelova, J. Aubrecht, O. Kikhtyanin and D. Kubička, Appl. Catal., A, 2021, 624, 118320 CrossRef CAS.
- F. Arena, G. Mezzatesta, G. Zafarana, G. Trunfio, F. Frusteri and L. Spadaro, Catal. Today, 2013, 210, 39–46 CrossRef CAS.
- J. Aubrecht, V. Pospelova, O. Kikhtyanin, L. Dubnová and D. Kubička, Appl. Catal., A, 2020, 608, 117889 CrossRef CAS.
- J. Wu, G. Gao, P. Sun, X. Long and F. Li, ACS Catal., 2017, 7, 7890–7901 CrossRef CAS.
- Y. J. Zhao, Z. Y. Guo, H. J. Zhang, Y. X. Xu, Y. Wang, J. Zhang, Y. Xu, S. P. Wang and X. B. Ma, Chem. Lett., 2017, 46, 1079–1082 CrossRef.
- C. Zhang, Z. Huo, D. Ren, Z. Song, Y. Liu, F. Jin and W. Zhou, J. Energy Chem., 2019, 32, 189–197 CrossRef.
- F. Arena, G. Italiano, K. Barbera, G. Bonura, L. Spadaro and F. Frusteri, Catal. Today, 2009, 143, 80–85 CrossRef CAS.
- E. Lam, J. J. Corral-Pérez, K. Larmier, G. Noh, P. Wolf, A. Comas-Vives, A. Urakawa and C. Copéret, Angew. Chem., Int. Ed., 2019, 58, 13989–13996 CrossRef CAS PubMed.
- S. Nishimura, T. Shishido, K. Ebitani, K. Teramura and T. Tanaka, Appl. Catal., A, 2010, 387, 185–194 CrossRef CAS.
- M. A. Hefnawy, S. A. Fadlallah, R. M. El-Sherif and S. S. Medany, J. Alloys Compd., 2022, 896, 162857 CrossRef CAS.
- J. Zhu, Y. Ye, Y. Tang, L. Chen and K. Tang, RSC Adv., 2016, 6, 111415–111420 RSC.
- Y. S. Yun, D. S. Park and J. Yi, Catal. Sci. Technol., 2014, 4, 3191–3202 RSC.
- C. Sepúlveda, K. Cruces, J. Gajardo, J. Seguel, R. García, D. Salinas, J. Fierro, I. Ghampson, R. Serpell and N. Escalona, New J. Chem., 2019, 43, 15636–15645 RSC.
- Y. Okamoto, K. Fukino, T. Imanaka and S. Teranishi, J. Phys. Chem., 1983, 87, 3747–3754 CrossRef CAS.
- S. Brunauer, P. H. Emmett and E. Teller, J. Am. Chem. Soc., 1938, 60, 309–319 CrossRef CAS.
- E. P. Barrett, L. G. Joyner and P. P. Halenda, J. Am. Chem. Soc., 1951, 73, 373–380 CrossRef CAS.
- P. P. Upare, M.-G. Jeong, Y. K. Hwang, D. H. Kim, Y. D. Kim, D. W. Hwang, U. H. Lee and J.-S. Chang, Appl. Catal., A, 2015, 491, 127–135 CrossRef CAS.
- B. Wang, X. Zhang, Q. Xu and G. Xu, Chin. J. Catal., 2008, 29, 275–280 CrossRef CAS.
- Q. Hu, G. Fan, S. Zhang, L. Yang and F. Li, J. Mol. Catal. A: Chem., 2015, 397, 134–141 CrossRef CAS.
- A. O. Elnabawy, R. Schimmenti, A. Cao and J. K. Nørskov, ACS Sustainable Chem. Eng., 2022, 10, 1722–1730 CrossRef CAS.
- A. V. Fedorov, R. G. Kukushkin, P. M. Yeletsky, O. A. Bulavchenko, Y. A. Chesalov and V. A. Yakovlev, J. Alloys Compd., 2020, 844, 156135 CrossRef CAS.
- X. Mo, Y.-T. Tsai, J. Gao, D. Mao and J. G. Goodwin, J. Catal., 2012, 285, 208–215 CrossRef CAS.
- J. Xi, Z. Wang and G. Lu, Appl. Catal., A, 2002, 225, 77–86 CrossRef CAS.
- Y. Z. Fang, Y. Liu and L. H. Zhang, Appl. Catal., A, 2011, 397, 183–191 CrossRef CAS.
- G. Cui, X. Meng, X. Zhang, W. Wang, S. Xu, Y. Ye, K. Tang, W. Wang, J. Zhu, M. Wei, D. G. Evans and X. Duan, Appl. Catal., B, 2019, 248, 394–404 CrossRef CAS.
- P. Yuan, Z. Liu, W. Zhang, H. Sun and S. Liu, Chin. J. Catal., 2010, 31, 769–775 CrossRef CAS.
- A. Al Baroot, M. Alheshibri, Q. Drmosh, S. Akhtar, E. Kotb and K. A. Elsayed, Arabian J. Chem., 2022, 15, 103606 CrossRef CAS.
- A. Sarfraz, R. Posner, M. M. Lange, K. Lill and A. Erbe, J. Electrochem. Soc., 2014, 161, C509 CrossRef.
- F. C. Romeiro, J. Z. Marinho, S. C. Lemos, A. P. de Moura, P. G. Freire, L. F. da Silva, E. Longo, R. A. Munoz and R. C. Lima, J. Solid State Chem., 2015, 230, 343–349 CrossRef CAS.
- P. N. Anantharamaiah, S. Mondal, K. S. Manasa, S. Saha and M. Pai M, Ceram. Int., 2020, 46, 1220–1226 CrossRef CAS.
- O. Bøckman, T. Østvold, G. A. Voyiatzis and G. N. Papatheodorou, Hydrometallurgy, 2000, 55, 93–105 CrossRef.
- A. Chanda, S. Gupta, M. Vasundhara, S. R. Joshi, G. R. Mutta and J. Singh, RSC Adv., 2017, 7, 50527–50536 RSC.
- G. Águila, F. Gracia and P. Araya, Appl. Catal., A, 2008, 343, 16–24 CrossRef.
- Y. Zhao, Z. Guo, H. Zhang, B. Peng, Y. Xu, Y. Wang, J. Zhang, Y. Xu, S. Wang and X. Ma, J. Catal., 2018, 357, 223–237 CrossRef.
- D. Kubička, J. Aubrecht, V. Pospelova, J. Tomášek, P. Šimáček and O. Kikhtyanin, Catal. Commun., 2018, 111, 16–20 CrossRef.
- H. Purwaningsih, N. M. I. P. Suari, W. Widiyastuti and H. Setyawan, ACS Omega, 2022, 7, 6760–6767 CrossRef CAS PubMed.
- P. Intarapong, A. Luengnaruemitchai and J.-I. Samai, Int. J. Renew. Energy Res., 2011, 1, 271–280 Search PubMed.
- M. L. da Silva-Neto, M. C. de Oliveira, C. T. Dominguez, R. E. Lins, N. Rakov, C. B. de Araújo, L. d. S. Menezes, H. P. de Oliveira and A. S. Gomes, Sci. Rep., 2019, 9, 11765 CrossRef PubMed.
- A. Filopoulou, S. Vlachou and S. C. Boyatzis, Molecules, 2021, 26, 6005 CrossRef CAS PubMed.
Footnote |
| † Electronic supplementary information (ESI) available. See DOI: https://doi.org/10.1039/d4cy00686k |
| This journal is © The Royal Society of Chemistry 2024 |

