 Open Access Article
Creative Commons Attribution 3.0 Unported Licence
Expanding the chemical space using a chemical reaction knowledge graph†
Emma
Rydholm
 *ab,
Tomas
Bastys
 a,
Emma
Svensson
 ac,
Christos
Kannas
 a,
Ola
Engkvist
 ab and
Thierry
Kogej
a
aMolecular AI, Discovery Sciences, R&D, AstraZeneca, Gothenburg, SE-431 83, Sweden. E-mail: emma.rydholm@astrazeneca.com
bDepartment of Computer Science and Engineering, Chalmers University of Technology, Gothenburg, SE-412 96, Sweden
cELLIS Unit Linz & Institute for Machine Learning, Johannes Kepler University Linz, AT-4040, Austria
First published on 11th June 2024
Abstract
In this work, we present a new molecular de novo design approach which utilizes a knowledge graph encoding chemical reactions, extracted from the publicly available USPTO (United States Patent and Trademark Office) dataset. Our proposed method can be used to expand the chemical space by performing forward synthesis prediction by finding new combinations of reactants in the knowledge graph and can in this way generate libraries of de novo compounds along with a valid synthetic route. The forward synthesis prediction of novel compounds involves two steps. In the first step, a graph neural network-based link prediction model is used to suggest pairs of existing reactant nodes in the graph that are likely to react. In the second step, product prediction is performed using a molecular transformer model to obtain the potential products for the suggested reactant pairs. We achieve a ROC–AUC score of 0.861 for link prediction in the knowledge graph and for the product prediction, a top-1 accuracy of 0.924. The method's utility is demonstrated by generating a set of de novo compounds by predicting high probability reactions in the USPTO. The generated compounds are diverse in nature and many exhibit drug-like properties. A brief comparison with a template-based library design is provided. Furthermore, evaluation of the potential activity using a quantitative structure–activity relationship (QSAR) model suggested the presence of potential dopamine receptor D2 (DRD2) modulators among the proposed compounds. In summary, our results suggest that the proposed method can expand the easily accessible chemical space, by combining known compounds, and identify novel drug-like compounds for a specific target.
1 Introduction
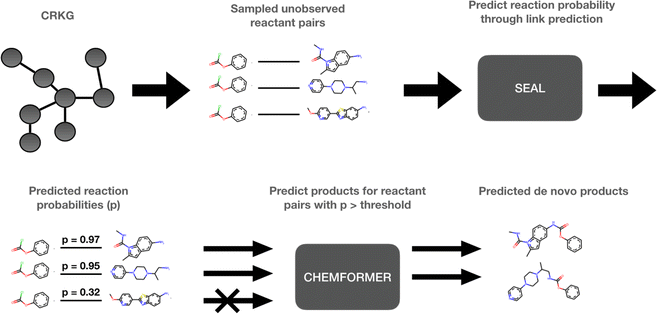
The use of computational methods that utilize Artificial Intelligence (AI) and Machine Learning (ML) throughout the different stages of the drug discovery process has become increasingly important during the last decade as a greater amount of pharmaceutical data and computational resources become more readily available.1 By leveraging the vast amounts of data and computational power now available, AI and ML methods have the potential to rapidly process complex biological, chemical, and pharmacological information, enabling automation of various decision-making processes in a fraction of the time. Through innovative approaches like deep learning, reinforcement learning, and generative models, AI-frameworks can be used to explore vast chemical spaces and identify promising compounds with drug-like properties and desired pharmaceutical activity. These innovations have, and will continue to, accelerate the early stages of drug discovery by reducing the time and resources required to identify and validate potential drug candidates. More specifically, molecular de novo design promises to impact the drug discovery process by generating novel pharmaceutically active compounds with desirable properties in a time and cost-efficient manner.1,2 Several de novo design methods have recently been developed.3–5 Among those, the REINVENT platform uses reinforcement learning to explore the chemical space in an efficient way by using a scoring function to guide the optimization of the biological profile of the generated de novo compound.6 In a drug discovery program, the question: “Which molecule to design next?” is inevitably followed by “How to make it?”. Some components of the chemical accessibility and feasibility can be partially learned during the set-up of these generative models or can be implemented in their scoring functions. However, a reasonable synthesis route of the suggested de novo compound is typically not provided and needs to be solved with the help of additional Computer-Assisted Synthesis Prediction (CASP) tools, such as AiZynthFinder.7In this study, a method which intimately integrates both aspects, “Which” and “How”, namely, the de novo generation and the chemical synthesis of a given compound, is suggested. The proposed method can be used to rapidly expand the chemistry space in an organization through taking advantage of the internally available compounds and building blocks as well as the internal reaction data. However, to make this study reproducible we have used publicly available data. The method is based on a knowledge graph, encoding reactions from the USPTO (United States Patent and Trademark Office),8 and is outlined in Fig. 1. In the first step, SEAL (learning from Subgraphs, Embeddings and Attributes for Link prediction), a graph neural network-based link prediction method, is applied on the chemical reaction graph to infer novel possible reactions by predicting the reactivity between novel combinations of pairs of known reactant molecules.9 In the second step, pairs of reactants presenting a predicted reactivity above a given threshold are channeled to Chemformer, a molecular transformer model, which is used to generate the potential reaction products.10 Thus, the de novo compounds are generated simultaneously for the identification of the required reactants which are selected for high probability to lead to a productive synthesis. In this way, our method can be used to expand the current chemical space by including the predicted synthesizable reactions. Thus, we can efficiently create a new virtual chemical space containing novel synthesizable chemistry, from novel combinations of known compounds.
In Section 2, the details of the Chemical Reaction Knowledge Graph (CRKG) used in this work are introduced. The applied link prediction algorithm as well as the molecular transformer model used to predict the reaction products is also explained. Thereafter, in Section 3, we show the results from the respective models on our data and in Section 4, we compare our link prediction method to a template based approach, which is commonly used in library design. Finally, in Section 5, the use of the developed method for a hit finding campaign targeting the discovery of novel dopamine receptor D2 (DRD2) modulators is showcased.
2 Materials and methodology
2.1 Dataset and the reaction knowledge graph
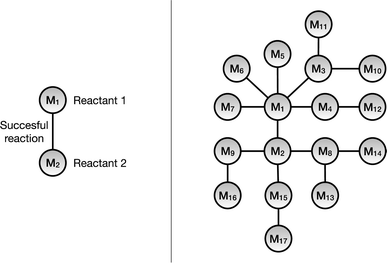
A knowledge graph represents a network of entities and describes the relationships between the entities, and consists of three main components: nodes, links, and labels. The nodes represent the unique entities; the links denote that there exists a relationship between the entities and the directionality. Hence, a link that connects node x to node y can be written as (x, y). Finally, the label specifies the type of relationship between the nodes. A link that connects x with y and has a label, l, would then be described as (x, l, y).In this work we have used a monopartite graph representation of the chemical reaction space for the link prediction task. In this, the reactant molecules are represented as nodes and the observed reactions are signified by the undirected links connecting them, as shown in Fig. 2. As one link can connect exactly two nodes (reactants), only chemical reactions with exactly two reactants are included in the monopartite graph. Although the majority of reactions in the dataset consist of reactions with two reactants and one product and this is the dominating reaction type in medicinal chemistry,11 this remains a limitation of the method. For the same reason, this also excludes additional context such as chemical reagents from consideration. Furthermore, we are restricting this work to only include reactions which have exactly one product. The CRKG employed in this work encodes a subset of 673![[thin space (1/6-em)]](https://www.rsc.org/images/entities/char_2009.gif) 390 patented chemical reactions that were extracted from the USPTO dataset. These reactions use 402
390 patented chemical reactions that were extracted from the USPTO dataset. These reactions use 402![[thin space (1/6-em)]](https://www.rsc.org/images/entities/char_2009.gif) 435 unique reactants to synthesizes a total of 662
435 unique reactants to synthesizes a total of 662![[thin space (1/6-em)]](https://www.rsc.org/images/entities/char_2009.gif) 228 unique products. This results in a graph with 402
228 unique products. This results in a graph with 402![[thin space (1/6-em)]](https://www.rsc.org/images/entities/char_2009.gif) 435 nodes (reactant molecules) and 669
435 nodes (reactant molecules) and 669![[thin space (1/6-em)]](https://www.rsc.org/images/entities/char_2009.gif) 237 links (reactions).
237 links (reactions).
Molecular information is provided to the link prediction model by adding molecular fingerprints as the node features. The fingerprints used are the 1024-bit Morgan-like fingerprint,12 generated using the RDKit toolkit.13 Also note that the CRKG only contains the reactant molecules but neglects information about the reaction product.
In addition to the CRKG, a tabular dataset which contains the string representations, e.g., SMILES, of the reactants and product has been constructed for the product prediction task. This dataset contains the equivalent reactions that are represented by the positive links in the CRKG.
2.2 Predicting novel reactions via link prediction
To infer novel reactions in the monopartite CRKG, i.e., adding links that are currently not present in the graph, can potentially lead to the generation of de novo compounds. This task can be performed with link prediction, i.e., predicting a link between two, currently unconnected, nodes in a graph.14 There are several link prediction algorithms available, and these can roughly be divided into heuristic and non-heuristic methods.15 The heuristic link prediction methods typically use a scoring function to determine the probability of a link. These scoring functions introduce assumptions of when a link is likely to occur based on the nodes' similarities. The common neighbor's method measures the likelihood of two nodes being connected based on the number of common neighbors they have.16 Social networks are typical examples of when the common neighbor's heuristic is applicable, as two people with many common connections are also more likely to be connected themselves. In other contexts, such assumptions might not hold, and other link prediction algorithms are then preferable. In addition, methods that are only based on graph topology and consequently ignore the node information, i.e., the structure of the molecule, might not be suitable for creating meaningful new reactions and consequently could generate many false positives. Here, we use the SEAL algorithm for link prediction, which has been shown to outperform heuristic and other non-heuristic methods on several benchmark graphs.9,17 This work is an expansion of previous work in the group.18 SEAL is a binary classification model which can be trained to discriminate between a positive and a negative link. In short, the algorithm first extracts an h-hop enclosing subgraph around a link (x, y). Thus, this subgraph contains x and y and all the neighbors, at a maximum distance of h. A node labeling scheme is thereafter applied on the subgraph and finally the subgraph, together with optional node features, is passed through a graph neural network to obtain the probability of the link. For details of the algorithm, see ref. 9. The positive class is composed of the observed links in the graph while the negative class can be constructed from the unobserved links. Hereafter observed links are referred to as links or positive links and the unobserved links as negative links. The training process and evaluation of the link prediction algorithm on the CRKG are discussed in Section 3.1.2.3 Product prediction using a molecular transformer
By applying link prediction in the CRKG we can infer new links between non connected reactants. The natural next step is to predict the resulting de novo products. For this purpose, a molecular transformer model is used. This sequence-to-sequence method has been developed in the field of natural language processing.19 To use a transformer for this task, the reactions need to be encoded using a string format such as SMILES.20 In the present case, the input sequence represents the reactant pair, and the output sequence corresponds to the product. To this end, Chemformer,10 has been used and fine-tuned on the reaction SMILES from the CRKG. Chemformer is a molecular transformer model which uses an encoder-decoder architecture and has been developed and applied for varied chemistry tasks, including discriminative tasks such as molecular property prediction and translation tasks such as retro- and forward synthesis. The pre-trained models were made available with the publication and can be used for fine-tuning other datasets. The training and performance of Chemformer on the tabular version of the CRKG is presented in Section 3.2.3 Results
3.1 Link prediction with SEAL in the chemical reaction knowledge graph
To train SEAL, a dataset consisting of a positive and negative class was used. The positive class consists of the positive links (observed reactions) in the CRKG while the negative class was constructed from the negative links (unobserved reactions). However, as the number of negative links scales exponentially with the number of nodes in the graph, using all negative links as the negative class would both make a highly unbalanced dataset and be unfeasible to train on. Instead, one negative link was sampled for each positive link. For this task, we use two different negative sampling strategies: random sampling and node degree-preserving sampling (NDP), where we sampled an equal number of negative links with each strategy. Random sampling means that the source and target nodes were uniformly sampled with replacement from the set of nodes in the graph, while NDP sampling results in a preservation of the nodes' occurrence count in the positive link set by sampling the source and target nodes without replacement, i.e., all nodes have the exact same degree of distribution when comparing positive and negative links separately.The hold-out test set was created by randomly sampling 10% of the positive and negative links. The remaining links were split into 5 folds where one such fold made up the validation set, and the rest the training set. The positive links in the training set were included in both directions because the SEAL model considers the directionality of the edges. This resulted in twice as many positive links as negative links in the training set. The number of links in each set is displayed in Table 1.
| Training set | Validation set | Test set | |
|---|---|---|---|
| # Positive links | 963![[thin space (1/6-em)]](https://www.rsc.org/images/entities/char_2009.gif) 704 704 |
120![[thin space (1/6-em)]](https://www.rsc.org/images/entities/char_2009.gif) 463 463 |
66![[thin space (1/6-em)]](https://www.rsc.org/images/entities/char_2009.gif) 922 922 |
| # Negative links | 481![[thin space (1/6-em)]](https://www.rsc.org/images/entities/char_2009.gif) 852 852 |
120![[thin space (1/6-em)]](https://www.rsc.org/images/entities/char_2009.gif) 463 463 |
66![[thin space (1/6-em)]](https://www.rsc.org/images/entities/char_2009.gif) 922 922 |
| Total number of links | 1![[thin space (1/6-em)]](https://www.rsc.org/images/entities/char_2009.gif) 445 445![[thin space (1/6-em)]](https://www.rsc.org/images/entities/char_2009.gif) 556 556 |
240![[thin space (1/6-em)]](https://www.rsc.org/images/entities/char_2009.gif) 926 926 |
133![[thin space (1/6-em)]](https://www.rsc.org/images/entities/char_2009.gif) 844 844 |
Hyperparameter optimization was performed using Optuna.21 Here, 50% of the training edges were included in the training during the hyperparameter optimization and 50% of the validation set was used to evaluate the parameters as the hyperparameter process so as to speed up this time-consuming process. Optuna was initialized with the Tree-structured Parzen Estimator (TPE) sampling22 option, with 40 random startup trials; in total, 100 trials were completed. The hyperparameter search-space and the result of the optimization are reported in the ESI.† For further explanations of the hyperparameters we refer to the original publication.9
The performance of the optimized SEAL model is presented in Table 2. Here, we have also included a comparison with three heuristic baselines: common neighbors, Adamic–Adar similarity and Jaccard similarity. Based on these results, the SEAL model outperforms all heuristic methods. For this reason, the SEAL model has been used for the link prediction task going forward.
| CV-5 validation AUC | Validation AUC | Test AUC | |
|---|---|---|---|
| SEAL | 0.857 ± 0.007 | 0.859 | 0.861 |
| Common neighbors | 0.457 ± 0.001 | 0.457 | 0.456 |
| Adamic–Adar similarity | 0.457 ± 0.001 | 0.457 | 0.456 |
| Jaccard similarity | 0.457 ± 0.001 | 0.457 | 0.457 |
After the cross-validation, one of the five SEAL models was randomly selected to be employed in the subsequent steps. This model achieved a ROC–AUC score of 0.859 on the validation set and a ROC–AUC score of 0.861 on the test set.
3.2 Chemformer
For the product prediction, we use the pretrained Chemformer which was fine-tuned on our USPTO reactions. Specifically, we used the pretrained combined model, which is freely available. The combined model was then fine-tuned to learn the sequence-to-sequence task of predicting the product SMILES given the reactant SMILES. Chemformer was fine-tuned for 80 epochs using the default settings provided in the Chemformer github.23 The fine-tuning was performed on the tabular version of the same reaction data, used for training SEAL and was then evaluated on the same hold-out test set. The result of the trained Chemformer model can be seen in Table 3.| USPTO reactions | |
|---|---|
| Molecular top 1 accuracy | 0.924 |
| Molecular top 2 accuracy | 0.959 |
| Molecular top 3 accuracy | 0.964 |
| Molecular top 5 accuracy | 0.978 |
| Molecular top 10 accuracy | 0.979 |
This result is comparable with and slightly higher than the results reported in the original publication10 of 0.918 top-1 accuracy, where the Chemformer is evaluated for forward synthesis prediction. In the original publication Chemformer is also trained on the USPTO for this task but the preprocessing of the datasets differ as our data originate from the CRKG.
4 Comparison with the “state of the art” template-based approach
A common and efficient approach to combine two reactants to form a product is to use a template-based method, where SMARTS patterns are used to match reactive functions with potential reactants and subsequently map to the product. Segler et al. pointed out that the number of rules in template-based approaches for retrosynthesis elucidation can be very high.24 As a corollary, it could be laborious to encode all the SMARTS corresponding to chemical functions that, given a wished reaction, should be avoided to reduce the risk of generating side products. For instance, encoding the “acetylation of alcohols” in a forward template fashion should not only contain the SMARTS detecting the reacting carboxylic acid and alcohol moieties but also match the presence of any potential reactive amines on the remaining reactant structures that would interfere with the desired reaction via an amide coupling mechanism.Here, we were interested in comparing the utility of our link prediction method with a brute force template-based approach in generating valid reactions between pairs of reactants. For doing this, reaction templates from PaRoutes, that occurred at least 25 times (for increasing the chance of consistency in template quality) have been used.25 These templates have been extracted from the USPTO and cover a large range of reactions. Two set of reactant pairs, one with the top 100![[thin space (1/6-em)]](https://www.rsc.org/images/entities/char_2009.gif) 000 SEAL probabilities, and one with the 100
000 SEAL probabilities, and one with the 100![[thin space (1/6-em)]](https://www.rsc.org/images/entities/char_2009.gif) 000 lowest scores have been matched against each of the 12
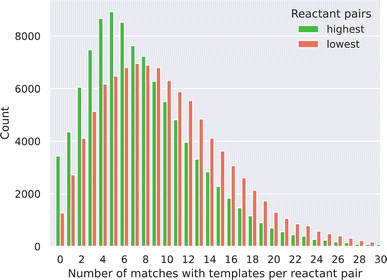
000 lowest scores have been matched against each of the 12![[thin space (1/6-em)]](https://www.rsc.org/images/entities/char_2009.gif) 611 templates. First, we noticed that most of the reactant pairs (97% for the highest and 99% for the lowest scored pairs) matched with at least one of the templates. This observation also implies that a purely template-based method could not be used to filter the reactant pairs based on probability or to rank the reactant pairs as our link prediction approach can, through probability predictions. Fig. 3 shows the distribution of the number of templates that could be applied to the reactant pairs for both the highest and lowest probability pairs, as a given pair can match more than one template. We observe a distribution shift for the lowest probability pairs to the right, meaning that these pairs match more templates than the highest probability pairs. This led us to two observations. Firstly, the lowest score pairs are more chemically promiscuous as these can react in more ways, derived from the higher amount of template matching. Secondly, a standalone template-based approach would require the implementation of more chemical rules (e.g. chemical function filtering) to avoid an ambiguous synthesis outcome, as the SMART templates often can be matched to the reactants in multiple ways because of its general nature.
611 templates. First, we noticed that most of the reactant pairs (97% for the highest and 99% for the lowest scored pairs) matched with at least one of the templates. This observation also implies that a purely template-based method could not be used to filter the reactant pairs based on probability or to rank the reactant pairs as our link prediction approach can, through probability predictions. Fig. 3 shows the distribution of the number of templates that could be applied to the reactant pairs for both the highest and lowest probability pairs, as a given pair can match more than one template. We observe a distribution shift for the lowest probability pairs to the right, meaning that these pairs match more templates than the highest probability pairs. This led us to two observations. Firstly, the lowest score pairs are more chemically promiscuous as these can react in more ways, derived from the higher amount of template matching. Secondly, a standalone template-based approach would require the implementation of more chemical rules (e.g. chemical function filtering) to avoid an ambiguous synthesis outcome, as the SMART templates often can be matched to the reactants in multiple ways because of its general nature.
In addition, to further evaluate the quality of the products, we compared the template-based products to products generated by Chemformer for each set. From this comparison we observe that for 78.5% of the high-probability reactant pairs at least one of the template-products correspond to the highest probable Chemformer product, while for the low-probability pairs, this is the case for only 38.96%. Thus, there is a larger agreement between the template-based method and Chemformer for the high-probability reactants compared to the lower-probability reactants. This could possibly result from the higher ambiguity in the lowest-probability pairs observed above. This suggests that our link prediction scoring method can also be used to complement the template-based approach in reducing the number of reactant pairs that could lead to ambiguous chemistry.
5 Predicting novel DRD2 modulators
In this section, we demonstrate the efficacy of our method by applying it to predict novel reactions in the CRKG and thus expand the chemical space. This is followed by an analysis of the reaction classes and the drug-likeliness of the compounds. In addition, the compounds were screened for potential DRD2 modulators. DRD2 has been selected for two reasons: (i) it is a validated drug target for which many ligands are publicly available in the literature and (ii) it has been found to be a convenient target to benchmark de novo design studies.5,26 There is no reason to expect an enrichment in DRD2 modulators specifically amongst the predicted compounds as no specific biological data have been considered for the CRKG construction. Still, it would be interesting to learn if our method could generate potential novel active DRD2 molecules starting from random reactants. The following section will outline the process and the evaluation of the generated compounds and the corresponding synthesis reactions.As the number of negative links in the graph is very high, we sampled a subset of the negative links for computational feasibility. To generate this subset, first a set of reactants pairs were sampled by drawing 1000 random unique reactants in the graph. Each of these unique reactants were combined with all other reactants in the graph which participated in at least five reactions (26![[thin space (1/6-em)]](https://www.rsc.org/images/entities/char_2009.gif) 846 reactants) to create a set of negative links. This sampling procedure has been reproduced three times for statistical consistency, creating three sets with unique unobserved reactions. The probabilities for the unobserved reactions have been predicted by the SEAL model. The reactant pairs with a predicted reaction probability above 0.95 were then passed through the Chemformer model to predict products for the proposed reactions. In Table 4, the number of unobserved reactions in each set and the number of predictions above 0.95 are reported. The results show that most of the predicted reactions generate unique products and that most of the generated products are novel, as ∼0.1–0.2% are also a product in the USPTO.
846 reactants) to create a set of negative links. This sampling procedure has been reproduced three times for statistical consistency, creating three sets with unique unobserved reactions. The probabilities for the unobserved reactions have been predicted by the SEAL model. The reactant pairs with a predicted reaction probability above 0.95 were then passed through the Chemformer model to predict products for the proposed reactions. In Table 4, the number of unobserved reactions in each set and the number of predictions above 0.95 are reported. The results show that most of the predicted reactions generate unique products and that most of the generated products are novel, as ∼0.1–0.2% are also a product in the USPTO.
| Set 1 | Set 2 | Set 3 | USPTO products | |
|---|---|---|---|---|
| Unobserved reactions | 26![[thin space (1/6-em)]](https://www.rsc.org/images/entities/char_2009.gif) 697 697![[thin space (1/6-em)]](https://www.rsc.org/images/entities/char_2009.gif) 891 891 |
26![[thin space (1/6-em)]](https://www.rsc.org/images/entities/char_2009.gif) 697 697![[thin space (1/6-em)]](https://www.rsc.org/images/entities/char_2009.gif) 929 929 |
26![[thin space (1/6-em)]](https://www.rsc.org/images/entities/char_2009.gif) 696 696![[thin space (1/6-em)]](https://www.rsc.org/images/entities/char_2009.gif) 479 479 |
— |
| Reactions with p > 0.95 | 457![[thin space (1/6-em)]](https://www.rsc.org/images/entities/char_2009.gif) 722 722 |
484![[thin space (1/6-em)]](https://www.rsc.org/images/entities/char_2009.gif) 276 276 |
465![[thin space (1/6-em)]](https://www.rsc.org/images/entities/char_2009.gif) 746 746 |
— |
| Products in the dataset | — | — | — | 673![[thin space (1/6-em)]](https://www.rsc.org/images/entities/char_2009.gif) 390 390 |
| Unique products | 443![[thin space (1/6-em)]](https://www.rsc.org/images/entities/char_2009.gif) 116 (97%) 116 (97%) |
466![[thin space (1/6-em)]](https://www.rsc.org/images/entities/char_2009.gif) 702 (96%) 702 (96%) |
450![[thin space (1/6-em)]](https://www.rsc.org/images/entities/char_2009.gif) 527 (97%) 527 (97%) |
662![[thin space (1/6-em)]](https://www.rsc.org/images/entities/char_2009.gif) 228 (98%) 228 (98%) |
| In USPTO products | 658 (0.1%) | 740 (0.2%) | 628 (0.1%) | — |
An extensive evaluation of the predicted reactions and products with respect to reaction classes, molecular diversity, scaffold diversity, reaction classes and drug-likeliness is given below.
5.1 Reaction classes
Reaction classes were analyzed using the NameRxn function from NextMove Software.27Fig. 4 illustrates the distribution of reaction classes in the three prediction sets as well as the USPTO for reference. We observe that our method can generate reactions of varied classes, although less diverse compared to the USPTO reactions. For example, some of the classes are more common amongst the predicted reactions such as class N-acylation to amide and Suzuki coupling which together account for 40% of the predicted reactions, while the two most common classes in the USPTO (N-acylation to amide and O-substitution) account for 29% of the reactions. Why we observe less diverse reactions could be explained by the smaller set of reactants used for the predictions compared to the USPTO, because of our initial sampling of reactants.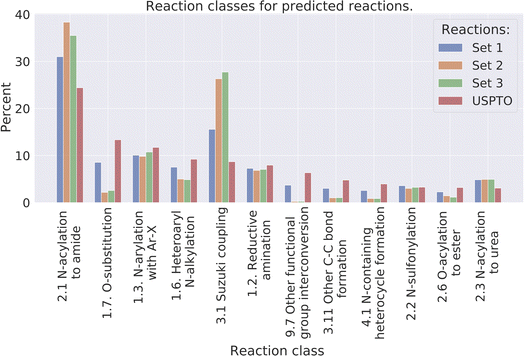 | ||
| Fig. 4 The distribution of the 10 most common reaction classes, for the predicted reactions and the USPTO for reference. | ||
5.2 Molecular and scaffold diversity
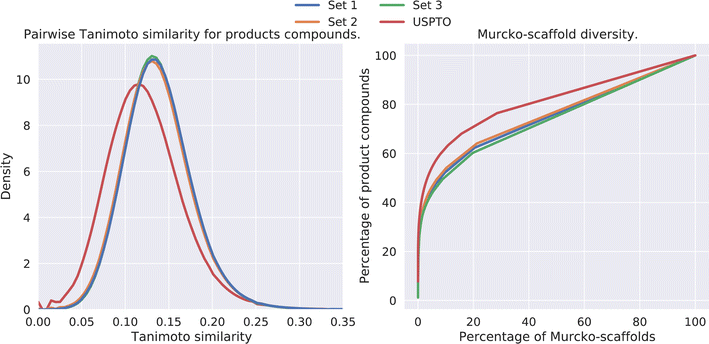
The diversity amongst the predicted compounds was investigated. First, for each set we sampled 10![[thin space (1/6-em)]](https://www.rsc.org/images/entities/char_2009.gif) 000 compounds and calculated the pairwise Tanimoto similarity, based on the fingerprints, within each set. The distribution of the Tanimoto similarity is shown in Fig. 5 (left). Here we observe that the mean similarity among the USPTO compounds is slightly lower (0.12) compared to our prediction (0.14). In addition, the Murcko-scaffold was generated for each of the predicted products and the unique scaffolds were ranked based on the number of product compounds it described. In Fig. 5 (right), the percentage of product compounds described by the percentage of the ranked scaffolds is shown.
000 compounds and calculated the pairwise Tanimoto similarity, based on the fingerprints, within each set. The distribution of the Tanimoto similarity is shown in Fig. 5 (left). Here we observe that the mean similarity among the USPTO compounds is slightly lower (0.12) compared to our prediction (0.14). In addition, the Murcko-scaffold was generated for each of the predicted products and the unique scaffolds were ranked based on the number of product compounds it described. In Fig. 5 (right), the percentage of product compounds described by the percentage of the ranked scaffolds is shown.
 | ||
| Fig. 5 (Left) Pairwise Tanimoto similarities between a subset of the predicted products. (Right) The percentage of product compounds described by the percentage of the (ranked) Murcko-scaffolds. | ||
The results show that although these products are generated from a smaller set of reactants and thus overall diversity is slightly lower than that of the USPTO, a relatively high diversity is maintained, as shown in Fig. 5. However, the scaffold diversity is higher among the predicted compounds as indicated by a lower percentage of the compounds which can be described by the most common scaffolds compared to USPTO products (Fig. 5 (right)). This is also an indication that the de novo compounds are also spanning a larger range of different scaffolds. This is in line as each scaffold for the predicted products on average describes fewer compounds (∼2) compared to the scaffolds for USPTO products (∼3) (Table 5). Additionally, there is little overlap between the scaffolds found in the USPTO and the predicted scaffolds as ∼5% of the scaffolds of the predicted products are found in the USPTO.
| Set 1 | Set 2 | Set 3 | USPTO products | |
|---|---|---|---|---|
| QED > 0.6 | 138![[thin space (1/6-em)]](https://www.rsc.org/images/entities/char_2009.gif) 407 (30%) 407 (30%) |
157![[thin space (1/6-em)]](https://www.rsc.org/images/entities/char_2009.gif) 033 (32%) 033 (32%) |
141![[thin space (1/6-em)]](https://www.rsc.org/images/entities/char_2009.gif) 873 (30%) 873 (30%) |
310![[thin space (1/6-em)]](https://www.rsc.org/images/entities/char_2009.gif) 795 (46%) 795 (46%) |
| QED > 0.8 | 34![[thin space (1/6-em)]](https://www.rsc.org/images/entities/char_2009.gif) 465 (8%) 465 (8%) |
40![[thin space (1/6-em)]](https://www.rsc.org/images/entities/char_2009.gif) 985 (8%) 985 (8%) |
33![[thin space (1/6-em)]](https://www.rsc.org/images/entities/char_2009.gif) 504 (7%) 504 (7%) |
78![[thin space (1/6-em)]](https://www.rsc.org/images/entities/char_2009.gif) 343 (12%) 343 (12%) |
| Products in ExCAPE | 0 (0%) | 0 (0%) | 0 (0%) | 221 (0.0%) |
| Predicted activity > 0.6 | 2391 (0.5%) | 1142 (0.2%) | 2148 (0.5%) | 6348 (0.9%) |
| Predicted activity > 0.8 | 607 (0.1%) | 475 (0.1%) | 650 (0.1%) | 3175 (0.5%) |
| Unique scaffolds | 216![[thin space (1/6-em)]](https://www.rsc.org/images/entities/char_2009.gif) 820 (47%) 820 (47%) |
220![[thin space (1/6-em)]](https://www.rsc.org/images/entities/char_2009.gif) 864 (46%) 864 (46%) |
230![[thin space (1/6-em)]](https://www.rsc.org/images/entities/char_2009.gif) 835 (50%) 835 (50%) |
221![[thin space (1/6-em)]](https://www.rsc.org/images/entities/char_2009.gif) 825 (33%) 825 (33%) |
| Scaffolds in the USPTO | 11![[thin space (1/6-em)]](https://www.rsc.org/images/entities/char_2009.gif) 904 (5%) 904 (5%) |
13![[thin space (1/6-em)]](https://www.rsc.org/images/entities/char_2009.gif) 669 (6%) 669 (6%) |
11![[thin space (1/6-em)]](https://www.rsc.org/images/entities/char_2009.gif) 889 (5%) 889 (5%) |
— |
| Scaffolds in ExCAPE | 99 (∼0.0%) | 106 (∼0.0%) | 102 (∼0.0%) | 446 (0.2%) |
5.3 Drug-likeliness
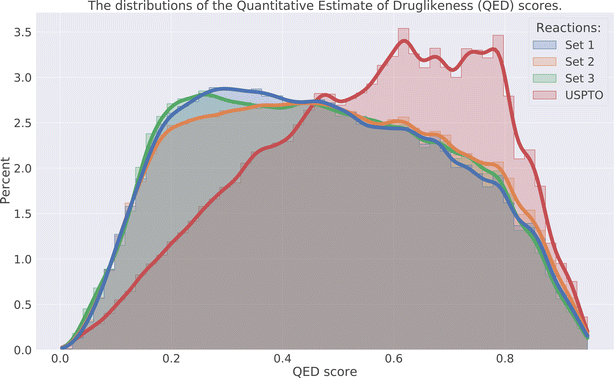
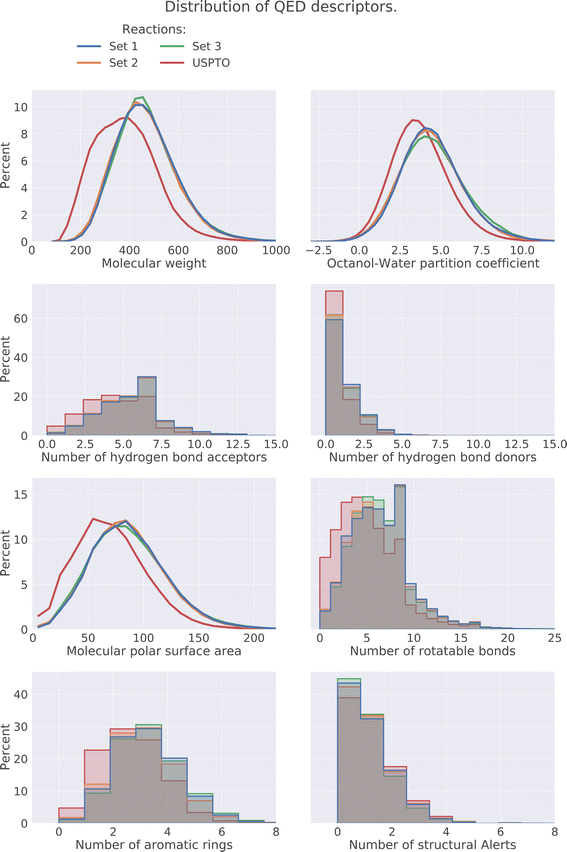
The drug-likeness of the compounds was evaluated by calculating the Quantitative Estimator of Drug-likeliness (QED) score28 using RDKit. The QED score considers several molecular descriptors, namely molecular weight, octanol–water partitioning coefficient, number of hydrogen bond acceptors, number of hydrogen bond donors, molecular polar surface area, number of rotatable bonds, number of aromatic rings, and number of structural alerts (presence of unwanted chemical functionalities). Based on the molecular descriptors an estimate of the drug-likeliness of a compound can be estimated where a value close to 1 indicates that a compound is drug-like and 0 indicates that it is not. The distribution of the QED score for the predicted compounds is compared to the distribution of the product compounds in the USPTO and is shown in Fig. 6. We can see that the distributions for the predicted compounds are slightly shifted toward lower QED scores. Although the distributions for the predictions are shifted towards lower scores, there is a large overlap between the distributions. A significant proportion of the compounds have high QED scores with 30–32% > 0.6 and 7–8% > 0.8, compared to 46% and 12% for the USPTO. Finally, we also note that the distributions of the compound's properties are slightly different compared to what is observed in the USPTO products. Moreover, we observe that the predicted compounds in general are slightly more complex in terms of molecular weight, number of aromatic rings, rotatable bonds, etc., as shown in Fig. 7. Specifically, the predicted compounds are slightly larger with more aromatic rings and rotatable bonds. This is likely an effect of the initial sampling of the starting reactants, as if these are more complex, the resulting predicted products will also be so.5.4 DRD2 activity
Finally, we investigate whether any of the predicted products are potential DRD2 modulators by predicting activity toward DRD2 using a Random Forest (RF) classifier. The RF classifier was trained to predict DRD2 activity based on the fingerprints and activity data from ExCAPE.29 From the ExCAPE database we obtained 8323 active and 343![[thin space (1/6-em)]](https://www.rsc.org/images/entities/char_2009.gif) 212 inactive DRD2 compounds. The RF model was implemented and calibrated using Scikit-learn. The hyperparameters were obtained through a 5-fold cross validation on the training set consisting of 80% of the compounds, using Optuna. Finally, a RF model was trained on the full training set and evaluated on the hold-out test set consisting of the remaining 20%. The trained random forest model had an ROC–AUC score of 0.966 and a Brier score of 0.003 on the test set. The activity for DRD2-target was predicted for all predicted products and USPTO products.
212 inactive DRD2 compounds. The RF model was implemented and calibrated using Scikit-learn. The hyperparameters were obtained through a 5-fold cross validation on the training set consisting of 80% of the compounds, using Optuna. Finally, a RF model was trained on the full training set and evaluated on the hold-out test set consisting of the remaining 20%. The trained random forest model had an ROC–AUC score of 0.966 and a Brier score of 0.003 on the test set. The activity for DRD2-target was predicted for all predicted products and USPTO products.
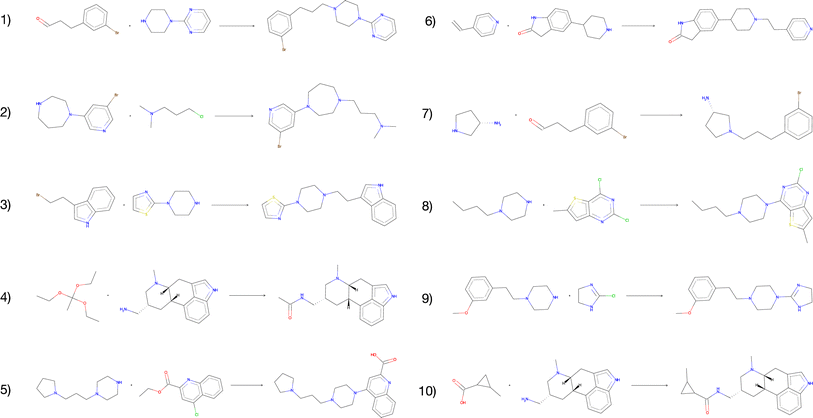
The vast majority of both the USPTO products and the predicted products were predicted to be inactive against the target. In addition, we observed no enrichment of active compounds amongst the predicted products compared to the USPTO, which was expected given that the reactants were sampled randomly. However, for all predicted products we found 1732 compounds that were predicted to be active (p > 0.8) for the target while none of these were present in the ExCAPE database (Table 5). When the reactions are filtered on both DRD2 activity > 0.8 and QED score > 0.8 simultaneously, we obtained 123 reactions with 117 unique compounds. This indicates that even though the reactants are randomly selected, our exhaustive method could be used to find active, synthesizable, and novel compounds using different kinds of filtering and screening techniques. Fig. 8 illustrates the 10 reactions with the highest activity and with a QED score > 0.8. The presented reactions look feasible and are also predicted to be successful by an experienced chemist. Although most reactions are considered rather simple, we also observe that the predicted reactions are not necessarily the simplest way to synthesize the products. For example, the product of reaction 4 (Fig. 8) could be more simply synthesized by using either acetic anhydride or chloride instead.
 | ||
| Fig. 8 The top-10 predicted reactions with the highest predicted DRD2 activity and a QED score > 0.8. | ||
We also observe that for the compounds that are predicted to be active, there are some reactants that are overrepresented. For the 123 reactions with a predicted DRD2 activity > 0.8 and a QED score > 0.8, 145 unique reactants are observed. One example is reactions 4 and 10 which share one reactant. The presented results suggest that among our generated compounds there are some promising structures which are predicted to be active DRD2 modulators. However, further analysis should be applied to the generated library to screen the novel compounds for desired molecular properties and activities. In Table 5, these results together with additional details that have been evaluated in this section are presented, such as QED, scaffolds and DRD2 activity.
6 Discussion
We have illustrated how we can utilize forward synthesis prediction in the CRKG for generating novel compounds with our proposed method. As a result of the interconnection of synthesizability and de novo design we can be more confident that the compounds generated are synthesizable, which is an essential criterion for de novo molecules to be useful. However, the synthesizability included in the prediction is, in this study, limited to one step which in general is not enough for ensuring that the products are synthesizable from the available building block molecules. One possible solution could be to perform the method in multiple steps, starting from a graph containing only building blocks and iteratively increasing the chemical reaction space.Moreover, it is important to keep in mind that there is some uncertainty for the link prediction as well as for the product prediction, as neither of the models perform perfect predictions. At the product prediction step, Chemformer will always generate a product given a set of reactants, even if the reactants are unlikely to react. Given that the reactivity prediction is preceding the product prediction we are more confident that the reactants provided should be able to react under some conditions. Thus, the predicted reactions should not be considered as ultimately true but rather as suggestions for new, potential reactions which could possibly expand the currently available chemical space.
The downstream results presented in Section 4 show that our proposed method can be used to generate a set of promising compounds. The predicted de novo compounds are diverse both in terms of scaffolds and Tanimoto similarity, have little overlap with the original graph, and include drug-like compounds. In addition, there is a small proportion of the products which are also potentially active DRD2 modulators based on quantitative structure–activity relationship (QSAR) predictions. As there is no reason to expect an enrichment in DRD2 modulators specifically, there is reason to anticipate that other potentially active compounds could be present in the predicted products. Considering that we were able to obtain promising results starting from randomly selected reactants in the CRKG, we suspect that this method could be used also for more targeted predictions. For example, the method could be used to find variants of a drug compound or for a specific drug target by handpicking the starting reactants. We also noted that amongst the compounds that were predicted to be active DRD2 modulators, some reactants were overrepresented which further confirms that a careful selection of the starting reactant could increase the number of potentially active compounds obtained. However, the proposed method can be used to generate an overwhelming number of compounds, even though high cut-offs are used for each step. Finally, the generated product compounds will have to go through some filtering and screenings to find compounds with desired properties. The analysis performed in Section 4 can be viewed as an example for how this process can be performed.
7 Conclusion
In this work we propose a novel approach for de novo design which combines known compounds in new ways and thereby intrinsically provides chemically accessible compounds. Our method utilizes a CRKG comprising reactions from the USPTO. In a two-step approach, we first use a link prediction algorithm for predicting a reaction between pairs of reactants which have not yet been observed to react. Secondly, we apply a transformer model to predict the product for a given reactant pair. We have showed that we can obtain satisfactory results for these tasks individually, on USPTO reaction data. To predict reactivity between pairs of reactants, we have applied the SEAL model for link prediction which significantly outperforms the heuristic baselines on the USPTO reaction data. In addition, we have applied the Chemformer model to predict the products given the reactant pairs, for which our results are aligned with the previously published results. Finally, we have demonstrated how the two parts can be combined and used for generating promising DRD2 modulator analogues using the reactants in the graph. The evaluation has been performed on the predicted de novo compounds in terms of the QED score, reaction classes, molecular diversity and finally DRD2 activity. We have observed that the predicted compounds are mostly novel. Our findings indicate that the predicted compounds differ from the compounds in the USPTO in various aspects. The drug-likeliness is slightly lower while the scaffold diversity is slightly higher. Despite these differences, our method appears to be capable of generating compounds with desired properties. The proposed method is a fast and simple way to expand the chemical space within an organization considering existing compounds and chemical reaction knowledge from the internal electronic laboratory notebooks. Our contribution with this work is a novel de novo design method which emphasizes the chemical accessibility when generating de novo libraries.Data availability
The code for the link prediction part in “Expanding the chemical space using a Chemical Reaction Knowledge Graph” can be found at https://github.com/MolecularAI/reaction-graph-link-prediction. Data for this paper, the reaction graph, are available at Zenodo at https://doi.org/10.5281/zenodo.10171188.Author contributions
ER wrote the first draft of the manuscript. ER, ES and TB contributed to the code used in the project. CK contributed to preparing the reaction graph. TB, TK, and OE supervised the project. All authors reviewed and approved the manuscript.Conflicts of interest
There are no conflicts to declare.Acknowledgements
ER was partially supported by the Wallenberg Artificial Intelligence, Autonomous Systems, and Software Program (WASP), funded by the Knut and Alice Wallenberg Foundation. TB was a fellow of the AstraZeneca postdoc programme. ES was (partially) funded by the European Union's Horizon 2020 research and innovation program under the Marie Sklodowska-Curie Innovative Training Network European Industrial Doctorate grant agreement No. 956832 “Advanced machine learning for Innovative Drug Discovery”. Samuel Genheden and Mikhail Kabeshov are acknowledged for providing their support and expertise while writing this article.References
- V. D. Mouchlis, A. Afantitis, A. Serra, M. Fratello, A. G. Papadiamantis and V. Aidinis, et al., Advances in De Novo Drug Design: From Conventional to Machine Learning Methods, Int. J. Mol. Sci., 2021, 22, 1676 CrossRef PubMed.
- H. C. S. Chan, H. Shan, T. Dahoun, H. Vogel and S. Yuan, Advancing Drug Discovery via Artificial Intelligence, Trends Pharmacol. Sci., 2019, 10, 592–604 CrossRef PubMed.
- A. Gupta, A. T. Müller, B. J. H. Huisman, J. A. Fuchs, P. Schneider and G. Schneider, Generative Recurrent Networks for De Novo Drug Design, Mol. Inf., 2018, 37(1–2), 1700111 CrossRef PubMed.
- M. Popova, O. Isayev and A. Tropsha, Deep reinforcement learning for de novo drug design, Sci. Adv., 2018, 4(7), eaap7885 CrossRef CAS PubMed.
- Y. Li, J. Hu, Y. Wang, J. Zhou, L. Zhang and Z. Liu, DeepScaffold: A Comprehensive Tool for Scaffold-Based De Novo Drug Discovery Using Deep Learning, J. Chem. Inf. Model., 2019, 60(1), 77–91 CrossRef PubMed.
- T. Blaschke, J. Arús-Pous, C. Hongming, C. Margreitter, C. Tyrchan and O. Engkvist, et al., REINVENT 2.0: an AI tool for de novo drug design, J. Chem. Inf. Model., 2020, 60(12), 5918–5922 CrossRef CAS PubMed.
- S. Genheden, A. Thakkar, V. Chadimová, J. L. Reymond, O. Engkvist and E. Bjerrum, AiZynthFinder: a fast, robust and flexible open-source software for retrosynthetic planning, J. Cheminf., 2020, 12(1), 70 Search PubMed.
- D. M. Lowe, Extraction of Chemical Structures and Reactions From the Literature, Diss., University of Cambridge, 2012 Search PubMed.
- M. Zhang and Y. Chen, Link Prediction Based on Graph Neural Networks, Adv. Neural Inf. Process. Syst., 2018, 31, 5165–5175 Search PubMed.
- R. Irwin, S. Dimitriadis, J. He and E. J. Bjerrum, Chemformer: a pre-trained transformer for computational chemistry, Mach. Learn.: Sci. Technol., 2022, 3(1), 015022 Search PubMed.
- D. G. Brown and J. Boström, Analysis of Past and Present Synthetic Methodologies on Medicinal Chemistry: Where Have All the New Reactions Gone?, J. Med. Chem., 2016, 16, 4443–4458 CrossRef PubMed.
- H. M. Rogers, Extended-Connectivity Fingerprints, J. Chem. Inf. Model., 2010, 28, 742–754 CrossRef PubMed.
- RDKit, Open-Source Cheminformatics, Online, available from, http://www.rdkit.org Search PubMed.
- D. Liben-Nowell, and J. Kleinberg, The Link Prediction Problem for Social Networks, Proceedings of the Twelfth International Conference on Information and Knowledge Management, 2003, pp. 556–559 Search PubMed.
- T. Z. Linyuan Lü, Link prediction in complex networks: A survey, Phys. A, 2011, 390(6), 1150–1170 CrossRef.
- M. E. J. Newman, Clustering and preferential attachment in growing networks, Phys. Rev. E, 2001, 64(2), 025102 CrossRef CAS PubMed.
- M. Zhang, P. Li, Y. Xia, K. Wang, and L. Jin, Revisiting Graph Neural Networks for Link Prediction, 2020 Search PubMed.
- E. Rydholm, and E. Svensson, Discovering Novel Chemical Reactions, Department of Computer Science and Engineering Division of Data Science and AI, Chalmers University of Technology, 2021.
- P. Schwaller, T. Laino, T. Gaudin, P. Bolgar, C. A. Hunter and C. Bekas, et al., Molecular Transformer: A Model for Uncertainty-Calibrated Chemical Reaction Prediction, ACS Cent. Sci., 2019, 1572–1583 CrossRef CAS PubMed.
- D. Weininger, SMILES, a chemical language and information system. 1. Introduction to methodology and encoding rules, J. Chem. Inf. Comput. Sci., 1988, 28, 31–36 CrossRef CAS.
- T. Akiba, S. Sano, T. Yanase, T. Ohta, and M. Koyama, Optuna: A Next-generation Hyperparameter Optimization Framework, in Proceedings of the 25th ACM SIGKDD International Conference on Knowledge Discovery & Data Mining, 2019, pp. 2623–2631 Search PubMed.
- J. Bergstra, R. Bardenet, Y. Bengio and B. Kégl, Algorithms for Hyper-Parameter Optimization, Adv. Neural Inf. Process. Syst., 2011, 24, 2546–2554 Search PubMed.
- Chemformer, GitHub Repository, Online, Commit: 6333badcd4e1d92891d167426c96c70f5712ecc3, available from, https://github.com/MolecularAI/Chemformer Search PubMed.
- M. H. S. Segler, M. Preuss and M. P. Waller, Planning chemical syntheses with deep neural networks and symbolic AI, Nature, 2018, 29, 604–610 CrossRef PubMed.
- S. Genheden and E. Bjerrum, PaRoutes: towards a framework for benchmarking retrosynthesis route predictions, Digital Discovery, 2022, 10, 527–539 RSC.
- A. S. Romeo, J. Viguera Diez, O. Engkvist, S. Olsson and R. Mercado, De Novo Drug Design Using Reinforcement Learning with Graph-Based Deep Generative Models, J. Chem. Inf. Model., 2019, 60(1), 77–91 Search PubMed.
- NextMove Software, NameRxn, Online, available from, https://www.nextmovesoftware.com/namerxn.html Search PubMed.
- B. G. Richard, G. V. Paolini, J. Besnard, S. Muresan and A. L. Hopkins, Quantifying the chemical beauty of drugs, Nat. Chem., 2012, 24, 90–98 Search PubMed.
- J. Sun, N. Jeliazkova, V. Chupakhin, J. F. Golib-Dzib, O. Engkvist and L. Carlsson, et al., ExCAPE-DB: an integrated large scale dataset facilitating Big Data analysis in chemogenomics, J. Cheminf., 2017, 9, 1–9 Search PubMed.
Footnote |
| † Electronic supplementary information (ESI) available. See DOI: https://doi.org/10.1039/d3dd00230f |
| This journal is © The Royal Society of Chemistry 2024 |

