 Open Access Article
Creative Commons Attribution 3.0 Unported Licence
Reconstructing the materials tetrahedron: challenges in materials information extraction
Kausik
Hira
 a,
Mohd
Zaki
 b,
Dhruvil
Sheth
 a,
Mausam
 *a and
N. M. Anoop
Krishnan
 *ab
*ab
aYardi School of Artificial Intelligence, Indian Institute of Technology, Delhi, India. E-mail: kausikhira@gmail.com; dhruvilsheth01@gmail.com; mausam@iitd.ac.in
bDepartment of Civil Engineering Indian Institute of Technology Delhi, India. E-mail: cez198233@iitd.ac.in; krishnan@iitd.ac.in
First published on 18th March 2024
Abstract
The discovery of new materials has a documented history of propelling human progress for centuries and more. The behaviour of a material is a function of its composition, structure, and properties, which further depend on its processing and testing conditions. Recent developments in deep learning and natural language processing have enabled information extraction at scale from published literature such as peer-reviewed publications, books, and patents. However, this information is spread in multiple formats, such as tables, text, and images, and with little or no uniformity in reporting style giving rise to several machine learning challenges. Here, we discuss, quantify, and document these challenges in automated information extraction (IE) from materials science literature towards the creation of a large materials science knowledge base. Specifically, we focus on IE from text and tables and outline several challenges with examples. We hope the present work inspires researchers to address the challenges in a coherent fashion, providing a fillip to IE towards developing a materials knowledge base.
1 Introduction
Understanding a material's behavior requires knowledge about its composition, properties, processing and testing protocols, and microstructure—represented as the materials science (MatSci) tetrahedron (see Fig. 1). These different aspects of a material are reported by researchers in peer-reviewed publications, patents, and other scientific documents. Recently, there have been several attempts to exploit the advances in machine learning (ML) and artificial intelligence (AI) towards automated information extraction (IE) from the literature.1–4 These include the development of materials specific language models,5–8 rule-based systems,9–13 IE from tables,8,14,15 and IE from images.16–19 The widely varying information expression styles in research papers make the automated MatSci IE a challenging task. Most of the studies have focused on IE in a specific domain; hence, the transferability to different materials is not explored. Moreover, no consolidated work exists that explores the specific challenges associated with IE in MatSci and the gain associated with solving these challenges, which provides a clear direction to the researchers regarding the areas that require increased attention.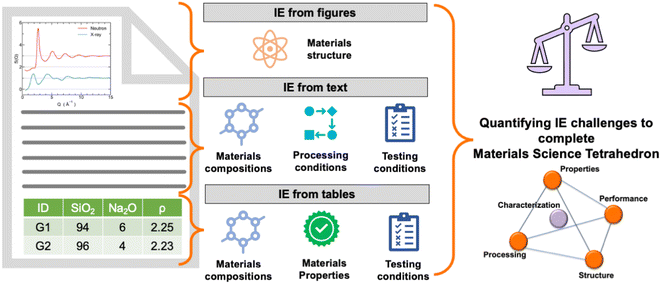 | ||
| Fig. 1 Quantifying challenges in information extraction from different elements of a research paper such as text, tables, and figures. | ||
We thoroughly review MatSci articles to identify IE challenges towards completing the materials tetrahedron (see Fig. 1). We also highlight some of the major challenges toward the development of a “universal” MatSci knowledge base linking the extracted information from multiple sources and forms of data—structured, semi-structured, and unstructured. Indeed, millions of scientific documents exist reporting information about various materials known to humans. Thus, the automated development of MatSci IE will lead to a rich knowledge base on materials. The outline of the paper is as follows: first, we explain the methodology of collecting papers for the review and annotation process. Then, in the results and discussion sections, we investigate the proportion of each of the entities, such as composition, structure, properties, processing, and testing conditions, reported in tables or text of the articles, followed by the challenges faced in their extraction. We quantify how frequently a challenge occurs to motivate researchers to gauge the amount of information that will be obtained after solving the respective challenges. We further identify the challenges in extracting and connecting the information from text and tables and among different tables belonging to the same MatSci research papers. Note that the challenges reported for extracting compositions from tables are verified by the present IE models, and only those that are unaddressed or solved unsatisfactorily are reported in the main text, whereas some of the existing challenges that have been resolved satisfactorily are documented in the appendix. In our study, DiSCoMaT8 was employed as the IE model for extracting compositions from tables, recognized as the most effective IE model for this purpose.4 Concurrently, GPT-4 was utilized to extract compositions from textual content in our study. For extracting properties from MatSci tables, we could not find any domain-specific IE model, but we believe that the challenges reported are valid for any IE models. We have also provided reasons and examples to elaborate on the same. Regarding IE from text to complete the materials tetrahedron, we have highlighted examples where existing IE models also make mistakes. Finally, we provide some guidelines for presenting machine and human-friendly tables that enable automated MatSci IE from research papers.
2 Methodology
To elucidate the challenges, we referred to a dataset of 2536 peer-reviewed publications on MatSci. This dataset is taken from recent work on IE from tables,8 where the authors used distant supervision to annotate tables from research papers based on respective compositions present in INTERGLAD.20 The tables in val and test data were annotated manually by indicating the relevant rows and columns that should be used to extract material compositions. Fig. 1 shows different sections of the paper where these different components are mainly reported. The statistics of each challenge were computed by randomly taking 50/100 tables from the manually annotated val and test dataset. In the cases where this was not applicable, we further performed manual annotation on an additional 50 papers or 100 relevant tables selected randomly from the corpus. For instance, we randomly selected 100 composition tables from the manual annotation in the existing dataset for composition extraction. However, no such manual annotation was available for properties. For this problem, we selected 100 random property tables from the corpus and manually annotated the frequency of the challenges in property extraction. Note that all the challenges and their reported frequencies are based on manual annotation, which is more reliable than any ML-based technique, such as distant supervision. Further, we manually analyzed tables or text for the occurrence of each of the entities, such as composition, structure, and properties. All the results and data associated with the annotation process are shared in the following link: https://github.com/M3RG-IITD/MatSci-IE-Challenges.3 Results and discussion
Fig. 2 shows the percentage of papers reporting raw materials (precursors), compositions, properties, processing, and testing methods in text and tables. Note that the same information could be reported in both text and tables and hence, the percentages may add to more than 100. Although 78% and 74% of papers had compositions in text and tables, respectively, an in-depth analysis revealed that only 33.21% of the total compositions were reported in the text, whereas 85.92% of compositions were present in tables. The overlap exists due to the same composition being mentioned in both text and tables. 82% articles report properties in tables (see Fig. 2). Processing and testing conditions are mostly reported in the text, while in 80% articles, precursors are mentioned in the text. In the following sections, we discuss these aspects in detail.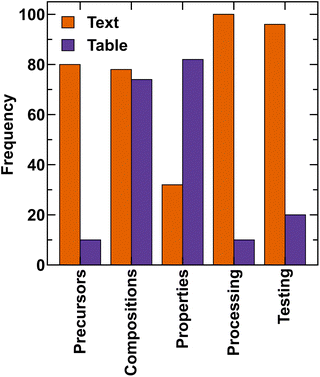 | ||
| Fig. 2 Occurrence of information regarding precursors (raw materials), compositions, properties, processing, and testing conditions in MatSci papers. | ||
3.1 Composition extraction
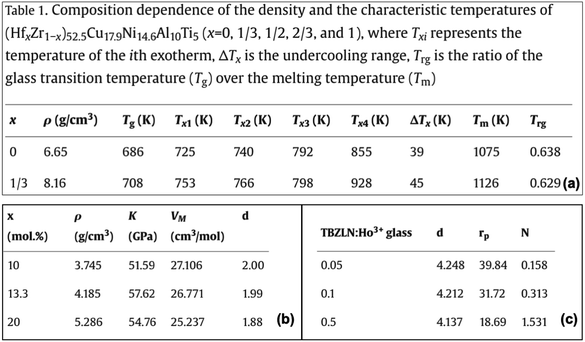
Since the majority of the material compositions are reported in tables, we first discuss the challenges in extracting compositions from tables. This is followed by the discussion on IE from text.3.1.1.1 Variation in the table structure and information content. An analysis of 100 random MatSci composition tables revealed that these tables do not follow any standard structure. Accordingly, following an earlier schema proposed by Gupta et al.,8 composition tables can be categorized into two broad categories—multi-cell composition (MCC) and single-cell composition (SCC). These are further subdivided into tables containing complete information (CI) and partial information (PI). When the entire composition is written inside a single cell, it is classified as an SCC table, whereas when the composition is written across multiple cells of the table by reporting the value of each constituent (compounds or elements) of the composition in separate cells, it is defined as an MCC table. If the table contains all the information regarding the constituents of the material, they are classified as CI tables (complete information). Alternatively, if only some of the constituents are mentioned in the table for the material, they are PI tables. In the latter case, we need to extend the analysis to the text of the article to extract the full composition. Fig. 3 illustrates all 4 types of tables.21–24 The most prevalent composition table types are MCC-CI (36%), followed by SCC-CI (30%). PI tables are less common, with 24% being MCC-PI and the remaining 10% being SCC-PI. Note that this distribution may also vary significantly depending on the material types. For instance, it is common practice in alloys to skip the major element while describing the composition in a table. In previous work by Gupta et al.,8 while F1 scores of 78.21% and 65.41% have been achieved for extraction from SCC-CI and MCC-CI tables, respectively, an F1 score of only 51.66% has been achieved for extraction from MCC-PI. Although the researchers have not explicitly focused on SCC-PI, we used their best model for SCC-PI tables and obtained 47.19% as the F1 score. Hence, there is significant scope for improvement in extracting compositions from PI tables.
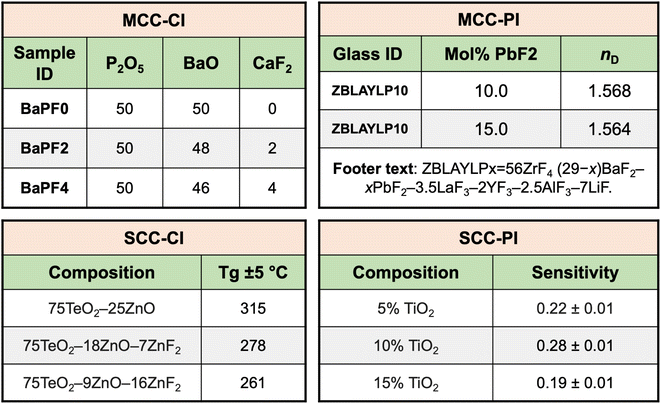 | ||
| Fig. 3 Classification of composition tables in single-cell composition (SCC) and multi-cell composition (MCC) with complete information (CI) and partial information (PI). | ||
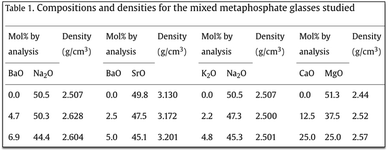
3.1.1.2 Presence of nominal and experimental compositions. While the nominal composition is the amount of chemicals taken initially to prepare the material, analyzed/experimental composition refers to the actual composition of the material obtained after analyzing the manufactured material (see Fig. 4(a)).25,26 Our analysis revealed that in 3% of the tables, both nominal and analyzed/experimental compositions are reported. These values are not reported in any fixed pattern, making it difficult to correctly separate the nominal and analyzed compositions after extraction.
 | ||
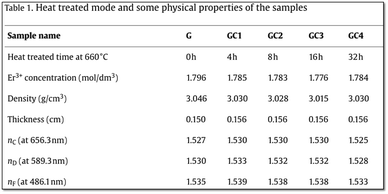
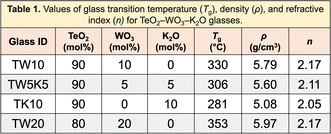
| Fig. 4 Example of tables: (a) mentioning nominal (batch) and analyzed composition and (b) having references to other papers. | ||
3.1.1.3 Compositions and related info inferred from other documents. In some tables, the details of the glasses studied are not explicitly mentioned; rather, references to previous research publications which use the same material are provided in the tables or their captions (see Fig. 4(b)). Thus, the composition or the other associated information of the material which is missing in the current publication must be extracted from the cited work, which then must be combined with the relevant information of the material present in the current work. We found references about different entities of the material in 11 tables.27,28 4 out of the 11 tables have not explicitly mentioned compositions, due to which the IE model8 was unsuccessful in obtaining the desired compositions.
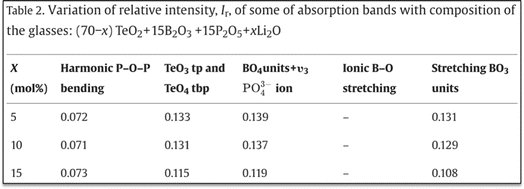
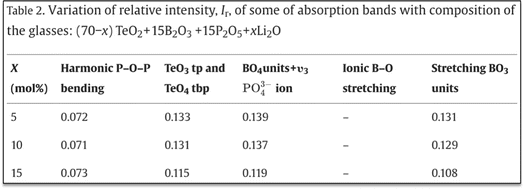
3.1.1.4 Composition inferred from material IDs. We observed that 10% of the total composition tables contain IDs with essential material composition information. In 60% of these tables, DiSCoMaT8 failed to extract the compositions correctly. Most of these tables did not mention the materials' composition separately, thereby making the extraction challenging. For example, some of the materials have their compositions indicated within the IDs in an abbreviated form29 and did not mention them explicitly (see Fig. 5(a)). We also found tables where the composition of the materials is not specified; instead, their standard names are used as IDs. Such examples include Wollastonite and Diopside,30 which have a fixed chemical composition that can be obtained from standard sources/databases. In some cases, the composition was specified separately, but the IE model failed to extract the composition correctly due to dependency on material IDs, as shown in Fig. 5(b). Here, the variable ‘M’ needs to be substituted by elements like ‘W’, ‘Nb’, or ‘Pb’, which needs to be inferred using the material IDs mentioned in the first column of the illustrated table.31
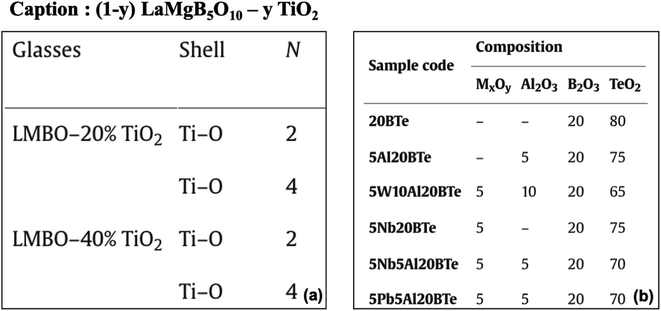 | ||
| Fig. 5 (a) Table with composition mentioned as acronyms in ID (first column). (b) The value of variable ‘M’ needs to be inferred from the material IDs. | ||
3.1.1.5 Variables used to represent compounds. When a composition is expressed with variables such as (70 − x)TeO2 + 15B2O3 + 15P2O5 + xLi2O, where x = 5, 10, 15, 20, 25 and 30 mol%,32 it mostly denotes the variation of different compounds. However, in some articles, variables have been used to represent compound names instead of their values. One such example is RE36Y20Al24Co20, where RE = Ce, Pr, Nd, Sm, Gd, Tb, Er, Sc.33 This scenario is observed in 1% of the tables, where DiSCoMaT8 fails to extract the material compositions. Note that this particular case can be solved using GPT-4, but as DiSCoMaT performs better in composition extraction from tables than GPT-4,4 and a pipeline of GPT-4 and DiSCoMaT is not feasible, hence, this still remains an open challenge.
3.1.2.1 Different formats of compositions. The compositions in materials literature do not adhere to a predetermined pattern and encompass several variations. This is in strict contrast to notations in chemistry, where IUPAC nomenclature is used. Some notable examples are as follows.
1. “Erbium-doped glasses with the molar composition 40GeO2 10SiO2 25Nb2O5 25K2O, plus 0.1 to 4 mol% of ErO1.5, were prepared using mixtures of the respective oxides (99.99% purity), with exception of K2O, which was added in the form of K2CO3”.342. “Bulk samples of (Se80Te20)100−xAgx (0 ≤ x ≤ 4) system were prepared by conventional melt quenching technique. High-purity (99.999%) elements with appropriate atomic percentages were sealed in a quartz ampoule (length ∼100 mm and internal diameter ∼6 mm) in a vacuum of 10–5 mbar”.353. “The samples having chemical composition of 2(Ca,Sr,Ba)O–TiO2–2SiO2 were examined. CaO, SrO, and BaO contents in the samples were varied as shown in Table 1. RO% shows the molar percentage of CaO, SrO or BaO in total RO of CaO + SrO + BaO”.36
| Challenges in IE from material IDs | % of occurrence |
|---|---|
| Composition info/doping conc. present only in IDs | 20 |
| IDs present in the middle | 2 |
| Multiple IDs present for the same composition | 4 |
| State or structural info in the ID | 2 |
| Info or references about the processing conditions | 8 |
| Same IDs but different composition | 4 |
| The article contains IDs interconnected | 2 |
| Taken from other articles | 6 |
3.1.2.2 Extracting variable values in text. Extracting values from variables is challenging since the variable values are specified in different formats, with some present only in the text. For instance, consider the following sentence from a peer-reviewed manuscript.37 A series of tellurite glasses with nominal composition (80−x)TeO2–xGeO2–10Nb2O5–10K2O, where x = 0, 10, 20, 30, 40, 50, 60, 70 and 80 mol%, hereafter named 8T0G, 7T1G, 6T2G, 5T3G, 4T4G, 3T5G, 2T6G, 1T7G and 0T8G, respectively, were doped with 0.2 to 4 mol% ErO1.5.
Although GPT-4 understands the doping element, since the entire information is not present in the same sentence and the exact values of doping content are not specified, it does not extract the composition successfully.
Here, the x values representing the compositions and the respective variable names are present only in the text. Appendix A.2.2(A.2.2.3) shows a few instances of other composition formats with variables. However, it may be noted that if full information is present in the sentences, GPT-4 is able to extract information correctly for the cases where the compositions are given in the form of variables.
3.1.2.3 Low recall in extracting compositions expressed with variables. 28% of the articles have compositions written with variables, of which 28.57% do not provide any values for the variables in the text. Among the 71.53% where values are present, 40% of them do not mention the step size for the range of values taken by the variable. For example, consider the text representing a set of compositions as follows from a manuscript: x(0.75AgI:0.25AgCl):(1−x)(Ag2O:WO3), where 0.1 ≤ x ≤ 1 in the molar weight fraction.38 The step size of 0.1 is mentioned nowhere in the text but could be inferred from the composition table present in the paper. Therefore, extracting only from the text in such cases leads to more errors, and this can be resolved by connecting the variables to the correct composition table containing the variable. GPT-4 takes the endpoints for substituting the values in the compositions. However, due to a lack of information, it does not extract complete compositions due to the lack of values between the extreme values.
3.1.2.4 Recognition of full forms and abbreviations. Instead of providing precise composition values, full forms are employed instead of abbreviations. Consider the following example.
“Lithium disilicate glass was prepared in 30 g quantity by heating stoichiometric homogeneous mixtures of lithium carbonate (99.0%), synth, and silica (99.9999%), Santa Rosa, for 4 h at 1500 °C in a platinum crucible.“.39 This text indirectly mentions the glass's composition as lithium disilicate without clearly mentioning the percentages or numbers. GPT-4 is able to infer the chemical formulae from chemical names but cannot infer the exact composition and its percentages from the sentence.
3.1.2.5 Unstable and irrelevant composition extraction. Unstable reagents and other irrelevant compositions which do not refer to the material are also identified as compositions due to a lack of robust parsers. AlO4 is an unstable entity referring to the aluminum tetrahedral structure, while SiO2 can be a composition. These undesired extractions can lead to a huge drop in the precision of the IE model, and separating them from the material composition is not easy. Only a domain expert, with the help of the source article, can confirm whether the extraction is relevant or not. GPT4 fails to differentiate compositions from unstable compounds.
It is worth noting that although GPT-4 can address some of these challenges, especially extraction from text, its closed nature makes it challenging to use it at scale and for custom applications. Some of the reasons are:
1. Often, the research documents could be highly sensitive, preventing their sharing with commercial models such as GPT-4.
2. The inability of GPT-4 to be combined with smaller predictive models like DiSCoMaT prevents exploiting excellent domain-specific models that extract information very accurately.
3. The commercial nature of such models can make it prohibitive due to the expenses associated with the usage due to the large number of sentences to be analyzed in the research papers and any additional prompt-engineering involved.
Therefore, GPT-4 may not be an ideal baseline for IE at large scale from research publications.
3.1.3.1 Unusual variables used. Other than the common variables like x, X, y, z, and Z, we also encounter variables like R, A, Y and S in 4% of the manuscripts. Distinguishing some of them, such as S or Y, is difficult as they are valid symbols for chemical elements as well.40
3.1.3.2 Composition present across multiple columns. The composition of the material is spread across multiple columns/rows (for instance as depicted in Fig. 6(a) (ref. 41)) or the table does not follow any fixed orientation. This is observed among 4% of the PI tables.
 | ||
| Fig. 6 (a) Composition across multiple columns. (b) Partial composition in the table and rest in the text. | ||
3.1.3.3 Composition partly in the table and partly in text. Although PI tables contain the composition partly, it is expected that the complete information is available in the text. But in rare occurrences, as depicted by Fig. 6(b), we observe that only the remaining part of the composition, which is not mentioned in the table, is present in the text. This makes linking the parts of compositions in the text and tables challenging. Thus, extracting the whole composition is extremely difficult, a case seen in less than 1% of the PI tables.42
3.1.3.4 Presence of multiple variables. We found 6% of the PI tables having more than one variable, all of which need to be taken into account to extract the composition correctly. As discussed previously, variables can be of various forms, making extracting multiple variables a challenging task.43,44
3.2 Extracting properties from tables
Until now, we focused on the extraction of compositions from tables and text. In this section, we discuss the challenges with property extraction. To this extent, we analyzed 100 arbitrarily selected property tables. The observations based on this analysis are as follows.3.3 Challenges common for both composition and property extraction
Thus far, we discussed the challenges faced during composition extraction in 3.1.1 and property extraction in 3.2 from tables. However, some challenges arise in either of these scenarios.Note that none of these challenges could be solved using the IE model DiSCoMaT8 and GPT-4.
3.4 IE for manufacturing and characterizing materials
To identify the challenges in extracting precursors, processing and testing conditions, and material structures, we analyzed 50 arbitrarily selected papers from the dataset for reporting our findings.3.4.3.1 Material structure. To study the structure of materials, researchers perform X-ray diffraction studies, obtain the Raman spectra, optical micrographs, and scanning electron micrographs depending upon the depth of detail about the material structure required. This information is mostly reported in figures and the figure description in the text provides some important details about the material's structure. In the statement, "The Raman spectrum of the porous phase (Fig. 6(b)) shows only one band at 277 cm−1 assigned to silica vibrations…",59 the information about Raman spectra is already shown in the graph, and the text mentions only critical findings.
To summarise, the extraction of precursors, processing, and testing conditions from text poses challenges related to named entity recognition and relation extraction, which requires the need for specialized datasets and model development. There exist several materials science domain-specific models capable of extracting this information but their performance (F1-Score) on different types of desired entities ranges from as low as 33%5 (interlayer materials for batteries, taken from the SOFC dataset60) to 93% (ref. 7) (materials tag, taken from the MatScholar dataset61). There also exist some knowledge graphs created using these tools like MatKG;62 however, the quality of the information in such sources is as good as that from the underlying model. Further, in relation-extraction tasks, the best-performing models have an F1 score of 0.82,63 which indicates significant efforts required to facilitate the information extraction and complete the materials science tetrahedron. Further, the extracted entities should be linked with the respective materials. The challenges faced during IE from tables for processing and testing variables require overcoming similar challenges as explained earlier for composition (Section 3.1.1) and properties (Section 3.2).
3.5 MatSci knowledge-base: linking extracted information
The tetrahedron, as shown in Fig. 1, will be considered complete for a given material if its properties, processing, testing conditions, and raw materials required to manufacture are available. To this end, researchers need to link extracted compositions with these variables. These pose unique challenges as it requires linking information among different entities within the paper such as connecting different paragraphs of the paper, text with tables, or tables with other tables in the paper.Material IDs are required to link information across multiple tables. For instance, in Fig. 11,64 we obtain the composition of CAS1 from Table 1 and Tg of this material from another table (Fig. 11 and Table 2). Every material in an article should have a unique ID, which should be used consistently across the whole article to denote the corresponding material. Any exception to this will lead to difficulties in linking our extracted information. We detected 187 out of 2536 (7.37%) publications where inter-table IE is necessary and found difficulties in 81 of them while connecting the different components of the tetrahedron.
 | ||
| Fig. 11 Composition and properties of the same material are mentioned in different tables within the article. | ||
As we observe that the material ID is a very important factor in connecting tables, we did an intensive analysis of the types of IDs that are reported in the tables (see Table 1).
3.6 ID analysis
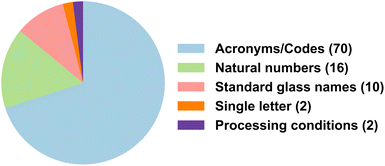
As the material ID is the key component in connecting materials from tables to text, across two different tables, or also across different sections of the text, we investigated arbitrarily selected 50 articles containing material IDs in the tables and recorded their semantic pattern to observe the semantics used by authors to refer to materials. We found that a majority of the authors prefer to use acronyms or self-made codes as IDs for referring to the materials, followed by natural numbers and standard material names, as illustrated in Fig. 12. Material IDs are generally present at the beginning of the table and very rarely seen in the middle or end. Often, we come across tables having IDs that contain relevant information like the processing conditions of the material, or information about the state of the glass like amorphous or crystalline, or its composition, which are not separately mentioned in the table. This information is generally encoded as abbreviations, and extracting it can be challenging. In Table 1, we describe different cases along with the percentage occurrences. Note that the composition of the material should not be confused with its ID, as both are separate entities. An ID is expected to be shorter in length, most likely an acronym, and unique to each material.4 Guidelines for writing IE-friendly MatSci tables
Tables should be reported in such a way that automated extraction and the detection of the desired information are easy. Some of our suggestions are as follows (illustrated with Fig. 13, adapted from ref. 69).4.1 Use column orientation
Many IE algorithms that have been developed for tables have considered column orientation only. Also, we showed that 93% of the published tables are column-oriented. The following suggestions assume that we are following column orientation.4.2 Use MCC-CI tables
Tables should have the components associated with a composition written in different cells. Moreover, the table should have the complete information of the material compositions (see Fig. 3).4.3 Use proper and descriptive headers
The headers should contain the chemical formula of the compounds or elements that make up the materials, along with the acronyms of the reported properties, with processing and testing conditions. If precursors, processing, and testing conditions are common, they can be omitted from tables.4.4 Use standard notations for units
Units should be mentioned in the column headers of the tables within brackets. Moreover, the standard notations for representing the SI unit should be consistently used.4.5 All-in-one table
Writing all the information of a particular material in a single table while following proper orientation is preferred. Following this will avoid the need for inter-table extraction.4.6 IDs are mandatory
Material IDs are important to identify different materials mentioned in the tables and link them across tables and text. IDs should be mandatory for tables and written in the first column.4.7 Consistent IDs
Material IDs should be formed as an acronym of its comprising constituents. They should be consistent in the whole article, that is, there should not be more than one ID referring to the same material.4.8 Table structure
The table should be of the structure [[Material ID], [C1], [C2], …, [P1], [P2], …]. ‘C’ denotes the constituting compound/elements that form the material. They are sequenced so that their proportions are arranged in a descending manner. ‘P’ refers to the properties of the corresponding material.4.9 Column/row-wise consistency
Each column or row should contain information only related to a particular entity mentioned in the heading or in the first row, respectively. Multiple tables or columns should not be concatenated into one.4.10 Captions
All tables should have a clear, concise, and descriptive caption. The table caption should clearly explain the acronyms used in the tables.5 Conclusion and future work
The literature is replete with IE challenges and algorithms to extract information about materials. However, there exists no study that quantifies how much benefit can be obtained if a particular challenge is solved. In this paper, we have identified and quantified several unresolved challenges present in IE for every aspect of the MatSci tetrahedron. Specifically, we pointed out the locations in a MatSci research paper where each piece of information on the MatSci tetrahedron of a given material is reported. Further, we outlined the challenges associated with IE and linking them to build the MatSci KB. We hope that this extensive analysis will motivate researchers to focus on the challenges in the field, giving an insight into the gain associated with each of these challenges. This will also enable the researchers to identify the right problems to focus on based on the desired outcome. Finally, we provided recommendations for an IE-friendly table format to enhance the automated extraction of the desired information and improve the researchers' tabular understanding. Such concerted efforts are required to streamline the reporting in MatSci articles, thereby accelerating IE for materials discovery.Data availability
The data and scripts to quantify different challenges for information extraction from materials science research papers are provided in the following GitHub repository: https://github.com/M3RG-IITD/MatSci-IE-ChallangesAuthor contributions
Hira, K – conceptualization, methodology, software, validation, investigation, data curation, and writing – original draft. Zaki, M – conceptualization, methodology, validation, investigation, visualization, data curation, and writing – original draft. Sheth, D. – investigation, data curation, and writing – original draft. Mausam – conceptualization, writing – review & editing, supervision, and project administration. Krishnan, N. M. A. – conceptualization, writing – review & editing, supervision, and project administration.Conflicts of interest
There are no conflicts to declare.A Appendix
In this section, we will address some more notable challenges, most of which have been solved satisfactorily by IE models.The details of all the research papers used in this study, along with annotations to identify the challenges, are available at https://github.com/M3RG-IITD/MatSci-IE-Challanges.
A.1 Common challenges faced during information extraction from tables
We begin by discussing the problems encountered for all-encompassing IE tasks. Challenge a has been resolved in (ref. 8) while challenge b has been addressed by (ref. 8 and 70).A.2 Other challenges faced in composition extraction
We discuss three more challenges which can be seen in the composition tables. Challenges a and b have already been handled by Gupta et al.8 In challenge c, extraction of compositions mentioned with atomic%, atomic fraction and parts per million (ppm) is still outstanding, whereas extraction of dopant concentration from challenge d has not been solved yet.
A.2.1.1 One composition with multiple units. Consider the following example composition – 0.85TeO2 + 0.15WO3 + 0.1 wt% Ag2O + 0.076 wt% CeO2.71 Here, for a given material, different components are measured in different units (mol% and wt%). This is found in 2% of the tables making composition extraction challenging.
A.2.1.2 Composition in table headers. Most tabular IE models like Tabbie72 and DiSCoMaT8 perform better when row/column headers contain appropriate information regarding their contents. In MatSci tables, the headers are mostly material IDs, compound names, properties, and processing and testing labels, and the inner cells contain the corresponding values. However, in 6% of the tables, we found that the compounds with their values were present in the heading, which makes it hard for the IE models to extract the desired information. For instance, Se58Ge33Pb9 (ref. 73) or x = 10%, x = 20%,…74 are column headers which contain both the compounds and corresponding concentration in the heading. 67% of these were SCC-CI, whereas the rest 33% were MCC-PI tables.
A.2.1.3 Composition expressed with different units in various articles. Compositions are expressed with different units such as mol%, weight%, atomic%, mol fraction, weight fraction, atomic fraction, and ppm. Among them, the most commonly used unit is mol%, followed by weight%.
A.2.1.4 Percentage not equal to 100. In some papers, even after extracting the whole composition correctly, we observe that the sum of the chemical component concentrations is not equal to 100, whereas we also notice the presence of the scenario where composition is extracted incorrectly and the sum is equal to 100. Especially in the case of doping, the sum exceeds 100, which is correct. The challenge is to identify where we need to normalize the values extracted and where we should not. We noted that the dopant is reported in 2% of the composition tables.
A.2.2.1 Unit not mentioned. 39.53% compositions had no unit specified explicitly.
A.2.2.2 Percentages not summing to 100. Out of the 78% compositions found in the text, 17.94% of them did not have the sum of values of the chemical compounds equal to 100.
A.2.2.3 Different formats of compositions with variables. A few instances of different formats of compositions expressed in variables are:
1. The non-isothermal crystallization kinetics of xLi2S–(1−x)Sb2S3, x = 0–0.17 were investigated using differential scanning calorimetry (DSC).75
2. To ascertain the effect of the glass composition on fluorescence parameters around 1.86 μm, we prepared and experimented on two series of glasses. The first one was aR21 O(1 − a) TeO2, where ‘a’ was 0, 10, 15, 20, and 30 mol%, and ‘R1’ was Li, Na, and K. The second one was bR11O.cR2111 O3(1 − b − c)TeO2, where ‘b’ was 0, 10, 20, and 30 mol%, and ‘c’ was 0.5% or 16.5%, and ‘R11’ = Ba, ‘R111’ = Al, Ga, or In. To find the effect of concentration quenching, the concentration of thulium oxide was varied from 0.01 to 5.0 mol%.76
3. Glasses with composition in mol%: 51ZrF4, 16BaF2, 5LaF3, 3AlF3, 20LiF, and 5PbF2 have been prepared by melting of the powders (commercial raw materials of purity higher than 99.99%) in a covered vitreous carbon crucible at about 850 °C for 45 min in a dry argon glove box with a water content lower than 5 ppm. The melt was poured into a preheated copper mould at 240 °C and slowly cooled down to room temperature. The doping ion was added in excess to the formula +xErF3 from 0.01 to 11 mol% corresponding to 0.02 to 22 × 1020 Er3 + ions per cm3. The samples obtained were of good optical quality.77
A.3 From tables and text jointly
| Prompt | GPT-4 response | Conclusion |
|---|---|---|
| “Extract all the compositions from the following expression. (70 – x)TeO2 + 15B2O3 + 15P2O5 + xLi2O, where x = 5, 10, 15, 20, 25 and 30 mol%” | To extract all the compositions based on the given expression for different values of x (5, 10, 15, 20, 25, and 30 mol%), substitute each value of x into the expression and calculate the resulting composition. The expression given is: (70 – x) TeO2 + 15B2O3 + 15P2O5 + xLi2O let's substitute the values of x one by one and write down the resulting compositions. For x = 5 mol%: (70–5)TeO2 + 15B2O3 + 15P2O5 + 5Li2O = 65TeO2 + 15B2O3 + 15P2O5 + 5Li2O for x = 10 mol%: (70–10)TeO2 + 15B2O3 + 15P2O5 + 10Li2O = 60TeO2 + 15B2O3 + 15P2O5 + 10Li2O for x = 15 mol%: (70–15)TeO2 + 15B2O3 + 15P2O5 + 15Li2O = 55TeO2 + 15B2O3 + 15P2O5 + 15Li2O for x = 20 mol%: (70–20)TeO2 + 15B2O3 + 15P2O5 + 20Li2O = 50TeO2 + 15B2O3 + 15P2O5 + 20Li2O for x = 25 mol%: (70–25)TeO2 + 15B2O3 + 15P2O5 + 25Li2O = 45TeO2 + 15B2O3 + 15P2O5 + 25Li2O for x = 30 mol%: (70–30)TeO2 + 15B2O3 + 15P2O5 + 30Li2O = 40TeO2 + 15B2O3 + 15P2O5 + 30Li2O | GPT-4 is able to extract information correctly for the cases where the compositions are given in the form of variables |
| “Extract all the compositions from the following expression. Glasses with composition in mol%: 51ZrF4, 16BaF2, 5LaF3, 3AlF3, 20LiF, 5PbF2 have been prepared. +xErF3 from 0.01 to 11 mol%” | The given expression lists the components of a glass system in terms of their mole percentage (mol%). Additionally, it mentions that the glass composition can be doped with varying amounts of ErF3 (erbium fluoride) from 0.01 to 11 mol%. The base composition of the glasses is as follows: – ZrF4 (zirconium fluoride): 51 mol% – BaF2 (barium fluoride): 16 mol% – LaF3 (lanthanum fluoride): 5 mol% – AlF3 (aluminium fluoride): 3 mol% – LiF (lithium fluoride): 20 mol% – PbF2 (lead(II) fluoride): 5 mol% additionally, we have the ErF3 dopant, which ranges from 0.01 to 11 mol%. A specific glass composition would include a certain percentage of ErF3 within the given range, and because the total mol% must sum up to 100%, adding ErF3 will decrease the percentages of the other components proportionally. Here's how to calculate the adjusted percentages for a specific amount of ErF3 added: Let's say we add x mol% ErF3 to the glass: – The sum of the other components without ErF3 is 100% - after adding x mol% ErF3, the sum of the original components must be scaled down to (100–x)% – each of the original components will be scaled by multiplying their percentages by (100 – x)%/100 for example, for a composition with 2 mol% ErF3: – total of the original components: 100–2% ErF3 = 98% – ZrF4: 51 mol% × (98/100) = 49.98 mol% – BaF2: 16 mol% × (98/100) = 15.68 mol% – LaF3: 5 mol% × (98/100) = 4.90 mol% – AlF3: 3 mol% × (98/100) = 2.94 mol% – LiF: 20 mol% × (98/100) = 19.60 mol% – PbF2: 5 mol% × (98/100) = 4.90 mol% so the new composition with 2 mol% ErF3 added would be approximately: – ZrF4: 49.98 mol% – BaF2: 15.68 mol% – LaF3: 4.90 mol% – AlF3: 2.94 mol% – LiF: 19.60 mol% – PbF2: 4.90 mol% – ErF3: 2 mol% for every specific addition of ErF3 within the range of 0.01 to 11 mol%, this calculation would have to be performed to determine the adjusted composition. The exact values would of course depend on the precise amount of ErF3 being added to the composition | GPT-4 understands the doping element, but since the entire information is not present in the same sentence, as well as exact values of doping content are not specified, it is able to give just partial information |
| “Extract all the compositions from the following expression. Lithium disilicate glass was prepared in 30 g quantity by heating stoichiometric homogeneous mixtures of lithium carbonate (99.0%), synth, and silica (99.9999%), Santa Rosa, for 4 h at 1500 °C in a platinum crucible.” | The compositions mentioned in the given expression include: 1. Lithium carbonate (Li2CO3) with a purity of 99.0% – this is one of the starting materials used to prepare the lithium disilicate glass. 2. Silica (SiO2) with a purity of 99.9999% – this is the other starting material used in the preparation. “Santa Rosa” is likely a brand name or location associated with the high-purity silica used. There are no exact quantities provided for each individual component (lithium carbonate and silica); however, the overall quantity of the prepared lithium disilicate glass is given as 30 g. The process involves heating these stoichiometric mixtures at 1500 °C for 4 hours in a platinum crucible, which avoids contamination as platinum is inert to the process. To determine the stoichiometry, you would need the molecular weights of the reactants and the targeted lithium disilicate (Li2Si2O5) product. Even though exact proportions are not given in this expression, you can infer that the molar ratios are configured to produce lithium disilicate without excessive amounts of either lithium carbonate or silica. “Synth” could represent that the lithium carbonate used is synthetic or refers to a brand or grade, but no additional context for this term is provided | GPT-4 was able to understand the chemical compounds but was unable to produce exact composition percentages for the same |
| “Extract all the compositions from the following expression. The formation of SiO3 groups was also confirmed by electron diffraction analysis on thin (4–80 Å) films of pure SiO2. The strong cohesive energy of the SiO4 groups (previously noted during studies of displacement cascades in complex glasses21) makes them less ‘vulnerable’ than BO4 or AlO4 groups, which more easily give up an oxygen atom.” | From the provided expression, the compositions mentioned are: 1. SiO3 groups 2. SiO2 (pure silicon dioxide) 3. SiO4 groups 4. BO4 groups 5. AlO4 groups these represent various oxide groups or arrangements of silicon (Si), boron (B), and aluminum (Al) with oxygen (O) | GPT4 fails to differentiate compositions from the unstable compounds |
Acknowledgements
N. M. Anoop Krishnan acknowledges the financial support received from BRNS YSRA (53/20/01/2021-BRNS), Google, and Intel Labs. Mohd Zaki acknowledges the funding received from the PMRF award by the Government of India. Mausam acknowledges grants by Google, IBM, Verisk, and a Jai Gupta chair fellowship. He also acknowledges travel support from Google and Yardi School of AI travel grants. The authors thank the High Performance Computing (HPC) facility at IIT Delhi for computational and storage resources. The authors also thank the Microsoft Accelerate Foundation Models Research (AFMR) for access to OpenAI models. We thank the anonymous reviewers of the 2023 AI4Mat NeurIPS workshop for recommending our work to be published in the special issue of Digital Discovery.References
- O. Kononova, T. He, H. Huo, A. Trewartha, E. A. Olivetti and G. Ceder, Opportunities and challenges of text mining in materials research, Iscience, 2021, 24(3), 102155 CrossRef PubMed.
- M. Zaki, A. Jan, N. A. Krishnan and J. C. Mauro, Glassomics: An omics approach toward understanding glasses through modeling, simulations, and artificial intelligence, MRS Bull., 2023, 1–14 Search PubMed.
- V. V. Ravinder, S. Bishnoi, S. Singh, M. Zaki and H. S. Grover, et al., Artificial intelligence and machine learning in glass science and technology: 21 challenges for the 21st century, Int. J. Appl. Glass Sci., 2021, 12(3), 277–292 CrossRef.
- M. Zaki, M. Jayadeva and N. M. A. Krishnan, MaScQA: investigating materials science knowledge of large language models, Digital Discovery, 2024 10.1039/D3DD00188A . Available from: http://xlink.rsc.org/?DOI=D3DD00188A.
- T. Gupta, M. Zaki and N. A. Krishnan, Mausam. MatSciBERT: A materials domain language model for text mining and information extraction, npj Comput. Mater., 2022, 8(1), 102 CrossRef.
- S. Huang and J. M. Cole, BatteryBERT: A pretrained language model for battery database enhancement, J. Chem. Inf. Model., 2022, 62(24), 6365–6377 CrossRef CAS PubMed.
- A. Trewartha, N. Walker, H. Huo, S. Lee, K. Cruse and J. Dagdelen, et al., Quantifying the advantage of domain-specific pre-training on named entity recognition tasks in materials science, Patterns, 2022, 3(4), 100488 CrossRef PubMed.
- T. Gupta, M. Zaki, D. Khatsuriya, K. Hira, N. M. A. Krishnan and M. Mausam, DiSCoMaT: Distantly Supervised Composition Extraction from Tables in Materials Science Articles, in Proceedings of the 61st Annual Meeting of the Association for Computational Linguistics (Volume 1: Long Papers), Association for Computational Linguistics, Toronto, Canada, 2023, pp. 13465–13483. Available from: https://aclanthology.org/2023.acl-long.753 Search PubMed.
- M. C. Swain and J. M. Cole, ChemDataExtractor: a toolkit for automated extraction of chemical information from the scientific literature, J. Chem. Inf. Model., 2016, 56(10), 1894–1904 CrossRef CAS PubMed.
- J. Mavracic, C. J. Court, T. Isazawa, S. R. Elliott and J. M. Cole, ChemDataExtractor 2.0: Autopopulated ontologies for materials science, J. Chem. Inf. Model., 2021, 61(9), 4280–4289 CrossRef CAS PubMed.
- M. Zaki and N. A. Krishnan, et al., Extracting processing and testing parameters from materials science literature for improved property prediction of glasses, Chem. Eng. Process-Process Intensif., 2022, 180, 108607 CrossRef CAS.
- V. Venugopal, S. Sahoo, M. Zaki, M. Agarwal, N. N. Gosvami and N. A. Krishnan, Looking through glass: Knowledge discovery from materials science literature using natural language processing, Patterns, 2021, 2(7), 100290 CrossRef PubMed.
- M. Zaki, S. R. Namireddy, T. Pittie, V. Bihani, S. R. Keshri and V. Venugopal, et al., Natural language processing-guided meta-analysis and structure factor database extraction from glass literature, J. Non-Cryst. Solids: X, 2022, 15, 100103 CAS.
- J. Zhao and J. M. Cole, A database of refractive indices and dielectric constants auto-generated using ChemDataExtractor, Sci. Data, 2022, 9(1), 192 CrossRef PubMed.
- J. Zhao, S. Huang and J. M. Cole, OpticalBERT and OpticalTable-SQA: Text-and Table-Based Language Models for the Optical-Materials Domain, J. Chem. Inf. Model., 2023, 63(7), 1961–1981 CrossRef CAS PubMed.
- K. T. Mukaddem, E. J. Beard, B. Yildirim and J. M. Cole, ImageDataExtractor: a tool to extract and quantify data from microscopy images, J. Chem. Inf. Model., 2019, 60(5), 2492–2509 CrossRef PubMed.
- L. Zhang and S. Shao, Image-based machine learning for materials science, J. Appl. Phys., 2022, 132(10), 100701 CrossRef CAS.
- M. Zaki, S. Sharma, S. K. Gurjar, R. Goyal and N. A. Krishnan, et al., Cementron: Machine learning the alite and belite phases in cement clinker from optical images, Constr. Build. Mater., 2023, 397, 132425 CrossRef CAS.
- M. Zaki, S. Kasimuthumaniyan, S. Sahoo, N. N. Gosvami and N. A. Krishnan, et al., Interpretable Machine Learning Approach for Identifying the Tip Sharpness in Atomic Force Microscopy, Scr. Mater., 2022, 221, 114965 CrossRef CAS.
- NGF J., International Glass Database System, 2019. Available from: https://www.newglass.jp/interglad_n/gaiyo/info_e.html Search PubMed.
- V. Nazabal, S. Todoroki, A. Nukui, T. Matsumoto, S. Suehara and T. Hondo, et al., Oxyfluoride tellurite glasses doped by erbium: thermal analysis, structural organization and spectral properties, J. Non-Cryst. Solids, 2003, 325(1–3), 85–102 CrossRef CAS.
- M. Zaharescu, A. Barau, L. Predoana, M. Gartner, M. Anastasescu and J. Mrazek, et al., TiO2–SiO2 sol–gel hybrid films and their sensitivity to gaseous toluene, J. Non-Cryst. Solids, 2008, 354(2–9), 693–699 CrossRef CAS.
- M. K. Narayanan and H. Shashikala, Thermal and optical properties of BaO–CaF2–P2O5 glasses, J. Non-Cryst. Solids, 2015, 422, 6–11 CrossRef CAS.
- Y. Jestin, A. Le Sauze, B. Boulard, Y. Gao and P. Baniel, Viscosity matching of new PbF2–InF3–GaF3 based fluoride glasses and ZBLAN for high NA optical fiber, J. Non-Cryst. Solids, 2003, 320(1–3), 231–237 CrossRef CAS.
- R. E. Youngman, B. G. Aitken and J. E. Dickinson, Multi-nuclear NMR studies of borosilicophosphate glasses and microfoams, J. Non-Cryst. Solids, 2000, 263–264, 111–116 CrossRef . Available from: https://www.sciencedirect.com/science/article/pii/S0022309399006262.
- K. Petkov and P. J. S. Ewen, Photoinduced changes in the linear and non-linear optical properties of chalcogenide glasses, J. Non-Cryst. Solids, 1999, 249(2), 150–159 CrossRef CAS . Available from: https://www.sciencedirect.com/science/article/pii/S0022309399003300.
- V. B. Brasil and E. Meyer, Test of the adiabatic nucleation model in SeTe and GeSnSe glasses, J. Non-Cryst. Solids, 2004, 348, 7–10 CrossRef CAS . Proceedings of the 6th Brazilian Symposium of Glases and Related Materials and 2nd International Symposium on Non-Crystalline Solids in Brazil. Available from: https://www.sciencedirect.com/science/article/pii/S002230930400660X.
- Q. Chen, M. Ferraris, D. Milanese, Y. Menke, E. Monchiero and G. Perrone, Novel Er-doped PbO and B2O3 based glasses: investigation of quantum efficiency and non-radiative transition probability for 1.5 μm broadband emission fluorescence, J. Non-Cryst. Solids, 2003, 324(1–2), 12–20 CrossRef CAS.
- V. Nazabal, E. Fargin, B. Ferreira, G. Le Flem, B. Desbat and T. Buffeteau, et al., Thermally poled new borate glasses for second harmonic generation, J. Non-Cryst. Solids, 2001, 290(1), 73–85 CrossRef CAS . Available from: https://www.sciencedirect.com/science/article/pii/S0022309301007268.
- J. Schneider, V. R. Mastelaro, H. Panepucci and E. Zanotto, 29Si MAS–NMR studies of Qn structural units in metasilicate glasses and their nucleating ability, J. Non-Cryst. Solids, 2000, 273(1–3), 8–18 CrossRef CAS.
- N. Kaur, A. Khanna, M. Gónzález-Barriuso, F. González and B. Chen, Effects of Al3+, W6+, Nb5+ and Pb2+ on the structure and properties of borotellurite glasses, J. Non-Cryst. Solids, 2015, 429, 153–163 CrossRef CAS . Available from: https://www.sciencedirect.com/science/article/pii/S0022309315301824.
- A. Khafagy, A. El-Adawy, A. Higazy, S. El-Rabaie and A. Eid, The glass transition temperature and infrared absorption spectra of:(70- x) TeO2+ 15B2O3+ 15P2O5+ xLi2O glasses, J. Non-Cryst. Solids, 2008, 354(14), 1460–1466 CrossRef CAS.
- K. Zhao, Q. Luo, D. Q. Zhao, H. Y. Bai, M. X. Pan and W. H. Wang, Bulk metallic glasses based on binary rare earth elements, J. Non-Cryst. Solids, 2009, 355(16), 1001–1004 CrossRef CAS . Available from: https://www.sciencedirect.com/science/article/pii/S0022309309001215.
- R. Santos, L. F. Santos and R. M. Almeida, Optical and spectroscopic properties of Er-doped niobium germanosilicate glasses and glass ceramics, J. Non-Cryst. Solids, 2010, 356(44), 2677–2682 CrossRef CAS . 12th International Conference on the Physics of Non-Crystalline Solids (PNCS 12). Available from: https://www.sciencedirect.com/science/article/pii/S0022309310002474.
- D. Singh, S. Kumar and R. Thangaraj, Optical and electrical properties of as-prepared and annealed (Se80Te20) 100 - xAgx (0 ≤ x ≤ 4) ultra-thin films, J. Non-Cryst. Solids, 2012, 358(20), 2826–2834 CrossRef CAS.
- K. Tsuzuku, S. Taruta, N. Takusagawa and H. Kishi, Crystallization of 2(Ca,Sr,Ba)O–TiO2–2SiO2 composition glasses, J. Non-Cryst. Solids, 2002, 306(1), 50–57 CrossRef CAS . Available from: https://www.sciencedirect.com/science/article/pii/S0022309302010578.
- G. Monteiro, L. F. Santos, R. M. Almeida and F. D'Acapito, Local structure around Er3+ in GeO2–TeO2–Nb2O5–K2O glasses and glass-ceramics, J. Non-Cryst. Solids, 2013, 377, 129–136 CrossRef CAS . ISNOG 2012 Proceedings of the 18th International Symposium on Non-Oxide and New Optical Glasses Rennes, France, July 1-5, 2012. Available from: https://www.sciencedirect.com/science/article/pii/S002230931200734X.
- R. Agrawal, M. Verma and R. Gupta, Electrical and electrochemical properties of a new silver tungstate glass system: x [0.75 AgI: 0.25 AgCl]:(1−x)[Ag2O: WO3], Solid State Ionics, 2004, 171(3–4), 199–205 CrossRef CAS.
- C. Schröder, M. de Oliveira Carlos Villas-Boas, F. C. Serbena, E. D. Zanotto and H. Eckert, Monitoring crystallization in lithium silicate glass-ceramics using 7Li → 29Si cross-polarization NMR, J. Non-Cryst. Solids, 2014, 405, 163–169 CrossRef . Available from: https://www.sciencedirect.com/science/article/pii/S0022309314004633.
- J. Henry and R. G. Hill, The influence of lithia content on the properties of fluorphlogopite glass-ceramics. I. Nucleation and crystallisation behaviour, J. Non-Cryst. Solids, 2003, 319(1), 1–12 CrossRef CAS . Available from: https://www.sciencedirect.com/science/article/pii/S0022309302019580.
- K. Kadono, M. Shojiya, M. Takahashi, H. Higuchi and Y. Kawamoto, Radiative and non-radiative relaxation of rare-earth ions in Ga2S3–GeS2–La2S3 glasses, J. Non-Cryst. Solids, 1999, 259(1), 39–44 CrossRef CAS . Available from: https://www.sciencedirect.com/science/article/pii/S0022309399004937.
- C. Le Deit and M. Poulain, Alkali fluorozirconate glasses, J. Non-Cryst. Solids, 1997, 213, 49–54 CrossRef.
- Y. B. Saddeek, M. Gaafar and S. A. Bashier, Structural influence of PbO by means of FTIR and acoustics on calcium alumino-borosilicate glass system, J. Non-Cryst. Solids, 2010, 356(20–22), 1089–1095 CrossRef CAS.
- A. Hayashi, R. Araki, R. Komiya, K. Tadanaga, M. Tatsumisago and T. Minami, Thermal and electrical properties of rapidly quenched Li2S-SiS2-Li2O-P2O5 oxysulfide glasses, Solid State Ionics, 1998, 113, 733–738 CrossRef.
- X. Gu, L. Xing and T. Hufnagel, Glass-forming ability and crystallization of bulk metallic glass (HfxZr1- x) 52.5 Cu17. 9Ni14. 6Al10Ti5, J. Non-Cryst. Solids, 2002, 311(1), 77–82 CrossRef CAS.
- X. Qiao, X. Fan, J. Wang and M. Wang, Luminescence behavior of Er3+ ions in glass–ceramics containing CaF2 nanocrystals, J. Non-Cryst. Solids, 2005, 351(5), 357–363 CrossRef CAS . Available from: https://www.sciencedirect.com/science/article/pii/S0022309304011196.
- A. Giridhar and S. Mahadevan, Mean atomic volume, Tg and electrical conductivity of Cux (As0. 4Te0. 6) 100- x glasses, J. Non-Cryst. Solids, 1998, 238(3), 225–233 CrossRef CAS.
- S. Scudino, J. Eckert, C. Mickel and L. Schultz, On the amorphous-to-quasicrystalline phase transformation in ball-milled and melt-spun Zr58.5Ti8.2Cu14.2Ni11.4Al7.7 glassy alloys, J. Non-Cryst. Solids, 2005, 351(10), 856–862 CrossRef CAS . Available from: https://www.sciencedirect.com/science/article/pii/S002230930500116X.
- O. Deparis, F. P. Mezzapesa, C. Corbari, P. G. Kazansky and K. Sakaguchi, Origin and enhancement of the second-order non-linear optical susceptibility induced in bismuth borate glasses by thermal poling, J. Non-Cryst. Solids, 2005, 351(27), 2166–2177 CrossRef CAS . Available from: https://www.sciencedirect.com/science/article/pii/S0022309305003959.
- M. Okuno, N. Zotov, M. Schmücker and H. Schneider, Structure of SiO2–Al2O3 glasses: Combined X-ray diffraction, IR and Raman studies, J. Non-Cryst. Solids, 2005, 351(12), 1032–1038 CrossRef CAS . Proceedings of the International Conference on Non-Crystalline Materials (CONCIM). Available from: https://www.sciencedirect.com/science/article/pii/S0022309305000050.
- M. Seshadri, L. Barbosa and M. Radha, Study on structural, optical and gain properties of 1.2 and 2.0 μm emission transitions in Ho3+ doped tellurite glasses, J. Non-Cryst. Solids, 2014, 406, 62–72 CrossRef CAS.
- A. Abd El-Moneim, Correlation between acoustical and structural parameters in some oxide glasses, J. Non-Cryst. Solids, 2014, 405, 141–147 CrossRef CAS.
- J. L. Besson, G. Massouras, A. Bondanini, M. Huger, S. Hampshire and Y. Menke, et al., On the glass transition domain in some M-SiAlON (M = Y or Ln) oxynitride glasses, J. Non-Cryst. Solids, 2000, 278(1), 187–193 CrossRef CAS . Available from: https://www.sciencedirect.com/science/article/pii/S0022309300003343.
- T. Konishi, T. Asano, Y. Ishii, K. Soga, H. Inoue and A. Makishima, et al., Effects of Eu2O3 on liquid–liquid phase separation of PbO–B2O3, BaO–B2O3 and SrO–B2O3 glasses, J. Non-Cryst. Solids, 2000, 265(1), 19–28 CrossRef CAS . Available from: https://www.sciencedirect.com/science/article/pii/S0022309399008789.
- J. Rocherullé, M. Matecki and Y. Delugeard, Heat capacity measurements of Mg–Y–Si–Al–O–N glasses, J. Non-Cryst. Solids, 1998, 238(1), 51–56 CrossRef . Available from: https://www.sciencedirect.com/science/article/pii/S002230939800578X.
- A. Thompson and B. N. Taylor, Guide for the Use of the International System of Units (SI). National Institute of Standards and Technology, 2008 Search PubMed.
- G. Walter, U. Hoppe, A. Barz, R. Kranold and D. Stachel, Intermediate range structure of mixed phosphate glasses by X-ray diffraction, J. Non-Cryst. Solids, 2000, 263–264, 48–60 CrossRef . Available from: https://www.sciencedirect.com/science/article/pii/S0022309399006225.
- J. Roderick, D. Holland, A. Howes and C. Scales, Density–structure relations in mixed-alkali borosilicate glasses by 29Si and 11B MAS–NMR, J. Non-Cryst. Solids, 2001, 293, 746–751 CrossRef.
- F. Sigoli, Y. Kawano, M. R. Davolos and Jr M. Jafelicci, Phase separation in pyrex glass by hydrothermal treatment: evidence from micro-Raman spectroscopy, J. Non-Cryst. Solids, 2001, 284(1–3), 49–54 CrossRef CAS.
- A. Friedrich, H. Adel, F. Tomazic, J. Hingerl, R. Benteau and A. Marusczyk, et al., The SOFC-Exp Corpus and Neural Approaches to Information Extraction in the Materials Science Domain, in, Proceedings of the 58th Annual Meeting of the Association for Computational Linguistics, ed. Jurafsky D., Chai J., Schluter N., Tetreault J., Online: Association for Computational Linguistics, 2020, pp. 1255–1268. Available from: https://aclanthology.org/2020.acl-main.116 Search PubMed.
- L. Weston, V. Tshitoyan, J. Dagdelen, O. Kononova, A. Trewartha and K. A. Persson, et al., Named entity recognition and normalization applied to large-scale information extraction from the materials science literature, J. Chem. Inf. Model., 2019, 59(9), 3692–3702 CrossRef CAS PubMed.
- V. Venugopal and E. Olivetti, MatKG: An autonomously generated knowledge graph in Material Science, Sci. Data, 2024, 11(1), 217 CrossRef PubMed.
- Y. Song, S. Miret and B. Liu, MatSci-NLP: Evaluating Scientific Language Models on Materials Science Language Tasks Using Text-to-Schema Modeling, in, Proceedings of the 61st Annual Meeting of the Association for Computational Linguistics (Volume 1: Long Papers), ed. Rogers A., Boyd-Graber J., Okazaki N., Association for Computational Linguistics, Toronto, Canada, 2023, pp. 3621–3639. Available from: https://aclanthology.org/2023.acl-long.201 Search PubMed.
- M. Solvang, Y. Yue, S. L. Jensen and D. B. Dingwell, Rheological and thermodynamic behaviors of different calcium aluminosilicate melts with the same non-bridging oxygen content, J. Non-Cryst. Solids, 2004, 336(3), 179–188 CrossRef CAS.
- M. Romero, R. D. Rawlings and J. M. Rincón, Crystal nucleation and growth in glasses from inorganic wastes from urban incineration, J. Non-Cryst. Solids, 2000, 271(1), 106–118 CrossRef CAS . Available from: https://www.sciencedirect.com/science/article/pii/S002230930000082X.
- J. R. Martinelli, F. F. Sene and L. Gomes, Synthesis and properties of niobium barium phosphate glasses, J. Non-Cryst. Solids, 2000, 263–264, 263–270 CrossRef . Available from: https://www.sciencedirect.com/science/article/pii/S0022309399006389.
- O. Peitl and E. D. Zanotto, Thermal shock properties of chemically toughened borosilicate glass1The results described in this article were judged by an international committee and were considered to be the best poster of scientific nature presented at the III Brazilian Symposium on Glass and Related Materials, Bonito, Brazil, 1998.1, J. Non-Cryst. Solids, 1999, 247(1), 39–49 CrossRef CAS . Available from: https://www.sciencedirect.com/science/article/pii/S0022309399000290.
- M. Beggiora, I. M. Reaney, A. B. Seddon, D. Furniss and S. A. Tikhomirova, Phase evolution in oxy-fluoride glass ceramics, J. Non-Cryst. Solids, 2003, 326–327, 476–483 CrossRef . 13th Int. Symp. on Non-Oxide Glasses and New Optical Materials. Available from: https://www.sciencedirect.com/science/article/pii/S0022309303004563.
- T. Kosuge, Y. Benino, V. Dimitrov, R. Sato and T. Komatsu, Thermal stability and heat capacity changes at the glass transition in K2O–WO3–TeO2 glasses, J. Non-Cryst. Solids, 1998, 242(2–3), 154–164 CrossRef CAS.
- M. Habibi, J. Starlinger and U. Leser, DeepTable: a permutation invariant neural network for table orientation classification, Data Min. Knowl. Discov., 2020, 34(6), 1963–1983 CrossRef.
- J. R. Duclère, A. A. Lipovskii, A. P. Mirgorodsky, P. Thomas, D. K. Tagantsev and V. V. Zhurikhina, Kerr studies of several tellurite glasses, J. Non-Cryst. Solids, 2009, 355(43), 2195–2198 CrossRef . Available from: https://www.sciencedirect.com/science/article/pii/S0022309309005109.
- H. Iida, D. Thai, V. Manjunatha and M. Iyyer, TABBIE: Pretrained Representations of Tabular Data, 2021 Search PubMed.
- P. K. Jain, K. Rathore and N. Saxena, et al., Structural characterization and phase transformation kinetics of Se58Ge42- xPbx (x= 9, 12) chalcogenide glasses, J. Non-Cryst. Solids, 2009, 355(22–23), 1274–1280 Search PubMed.
- L. Minati, G. Speranza, M. Ferrari, Y. Jestin and A. Chiasera, X-ray photoelectron spectroscopy of erbium-activated-silica–hafnia waveguides, J. Non-Cryst. Solids, 2007, 353(5), 502–505 CrossRef CAS . SiO2, Advanced Dielectrics and Related Devices 6. Available from: https://www.sciencedirect.com/science/article/pii/S002230930601372X.
- S. De la Parra, L. Torres-Gonzalez, L. Torres-Martinez and E. Sanchez, Crystallization kinetics and phase transformation of xLi2S–(1- x) Sb2S3, x= 0–0.17 glass, J. Non-Cryst. Solids, 2003, 329(1–3), 104–107 CrossRef CAS.
- D. Hollis, F. Cruickshank and M. Payne, Structural influence of tellurite glasses on fluorescence of thulium near 1.86 μm, J. Non-Cryst. Solids, 2001, 293, 422–429 CrossRef.
- M. Mortier, P. Goldner, P. Féron, G. M. Stephan, H. Xu and Z. Cai, New fluoride glasses for laser applications, J. Non-Cryst. Solids, 2003, 326–327, 505–509 CrossRef . 13th Int. Symp. on Non-Oxide Glasses and New Optical Materials. Available from: https://www.sciencedirect.com/science/article/pii/S0022309303004617.
- S. Yoshida, J. Matsuoka and N. Soga, Sub-critical crack growth in sodium germanate glasses, J. Non-Cryst. Solids, 2003, 316(1), 28–34 CrossRef CAS . Available from: https://www.sciencedirect.com/science/article/pii/S0022309302019348.
| This journal is © The Royal Society of Chemistry 2024 |

