 Open Access Article
High throughput methodology for investigating green hydrogen generating processes using colorimetric detection films and machine vision†
Savannah
Talledo
 ,
Andrew
Kubaney
 ,
Mitchell A.
Baumer
 ,
Keegan
Pietrak
 and
Stefan
Bernhard
 *
*
Department of Chemistry, Carnegie Mellon University, 4400 Fifth Avenue, Pittsburgh, Pennsylvania 15213, USA. E-mail: bern@cmu.edu; Tel: +1-(412) 268-7419
First published on 13th June 2024
Abstract
The generation of hydrogen from abundant and renewable precursors driven by sunlight will be a cornerstone of a future, sustainable hydrogen infrastructure. Current methods to monitor the evolution of hydrogen in such photocatalytic systems such as gas chromatography, mass spectrometry, manometry or Raman spectroscopy are either expensive and low throughput or lack sensitivity and selectivity over other gasses. These impediments hinder the generation of photo-driven hydrogen evolution data necessary for machine learning and artificial intelligence-based protocols. This work presents an open-source approach for studying solar-driven hydrogen evolution reactions (HERs) in parallel that uses colorimetric hydrogen detection films in tandem with an image analysis software capable of providing metrics such as hydrogen amount, hydrogen evolution rates, incubation times, and plateau times. The sensing medium is composed of 0.05% (w/w) Pt impregnated molybdenum(VI) oxide or tungsten(VI) oxide which was incorporated into poly(vinyl alcohol) films placed under clear, gas impermeable septa. To conduct experiments, users require only blue reaction-driving high intensity LEDs (light emitting diodes), a camera, and uniform lighting to take pictures as the septa darken. This work introduces a sample configuration in which nine samples in hydrogen sensitive septa-capped vials were illuminated and the gas evolution is monitored using a RaspberryPi for image capture and storage. Two calibration methods are presented, one uses a gravimetric hydrogen evolution with Zn/HCl that is compared to a direct hydrogen injection. Both methods allow the accurate correlation of normalized intensity values of film photographs to mole fractions of H2 ranging from 0 to 50%. Four light-driven HERs are described that highlight the capabilities of the detection method, two of which were conducted using the novel septa-based instrumentation while the other two experiments used the films on a 108 multiwell plate using a previously described photoreactor.
1 Introduction
Finding alternative energy sources to replace fossil fuels and keep up with increasing energy demands has been a topic of immense interest for decades. Hydrogen is a promising green fuel due to its high energy density and water being the only byproduct upon oxidation; however, at present hydrogen is sourced predominantly from steam-methane reforming which generates 7.5 to 12 tons of CO2 per ton of H2.1,2 In an effort to avoid harmful emissions, solar-driven hydrogen evolution is being explored as an alternative. Such light-driven hydrogen evolving reactions (HERs) use the energy of photons via a light absorbing chromophore to reduce water or protons in solution to afford H2. This is commonly explored using three component systems consisting of a photocatalyst (PC), electron donor (D), and water reduction catalyst (WRC) (see Fig. 1).3–5 When the photocatalyst is irradiated, it can enter an excited state which can be reductively quenched by the D via a single electron transfer. The oxidation of the donor generates a reduced PC species that can transfer an electron to the WRC, regenerating the ground state PC. Water or protons in solution can be reduced by the WRC−, evolving H2. Donors are very commonly sacrificial in nature such as ascorbic acid6,7 and tertiary amines,8,9 but it is desirable to transition to bioavailable reagents10,11 or water.12,13 Reagents such as oxalic acid or isopropanol are thought to proceed via an oxidative quenching pathway (see Fig. 1B) which begins with the irradiation of the PC, generating the excited state PC*. This species is responsible for the reduction of a redox shuttle (RS) which is able to reduce the WRC. The ground state PC is regenerated via the oxidation of the OH-functionalized donor, a process that may be assisted by an alcohol oxidation catalyst (AOC). Oxidation of the donor generates protons in solution that can be reduced by the WRC to afford H2. Due to the complexity of these systems, no sustainable alternative for hydrogen production has been discovered; therefore, more powerful research methods that will allow for a greater understanding of such light to chemical energy transformations is urgently required.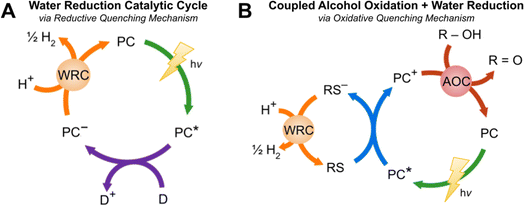 | ||
| Fig. 1 (A) Light-driven water reduction catalytic cycle14 for the photogeneration of H2 proceeding via a reductive quenching mechanism composed of a PC, D, and WRC. (B). Photo-driven coupled alcohol oxidation and water reduction catalytic cycle14via an oxidative quenching mechanism containing a PC, RS, WRC, AOC, and R–OH. | ||
One way to improve these photocatalytic systems is by creating an accessible tool that can accurately and efficiently monitor hydrogen evolution reactions in high-throughput, which could provide the data necessary for building insightful artificial intelligence-based tools or machine learning models. Unfortunately, introducing light-driven HERs to these environments can pose many challenges as the predominant tool used to monitor hydrogen evolution, gas chromatography, is expensive, requires hydrogen gas as a standard, and experiments can only be conducted in low throughput.15 Alternative approaches using headspace Raman spectroscopy or mass spectrometry are facing similar obstacles.16 Inexpensive and accessible solutions such as the use of pressure transducers or hydrogen sensors have been used, but often lack accuracy and selectivity for hydrogen over other potential gasses that may evolve in HERs such as CO, CO2, and O2.17–19 While some efforts towards developing high-throughput techniques for the synthesis of photocatalysts and studying light-driven HERs have been made,20,21 the instrumentation and characterization methods employed are costly and thus impractical for widespread use.
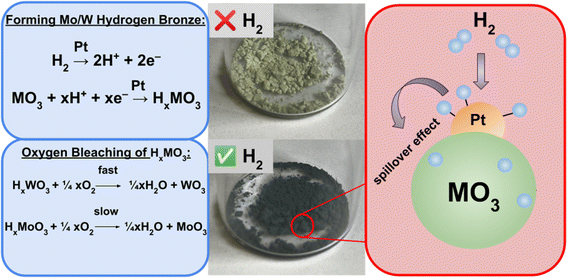
This work offers an inexpensive, open source, research grade method to study light-driven HERs by utilizing colorimetric hydrogen detection films, a photoreactor built using readily available materials, and an image analysis code written in Python. The films are made of poly(vinyl alcohol) (PVA) and contain 0.05% (w/w) Pt impregnated molybdenum(VI) oxide or tungsten(VI) oxide as the hydrogen sensing material. Detection of hydrogen using this material is achieved by the hydrogen spillover mechanism, a process previously studied by Adams and Chen.22 Hydrogen atoms dissociate onto the surface of the platinum catalyst and are able to migrate and diffuse into the metal oxide (MO3) (Fig. 2). The introduction of hydrogen radicals into the metal oxide allows for the formation of deep blue tungsten/molybdenum bronze (HxMO3).23 This color change can be attributed to the generation of M5+, creating a mixture of the metal occupying oxidation states of 5+ and 6+, allowing for intervalence charge transfers (IVCT) to occur in the visible region.24,25
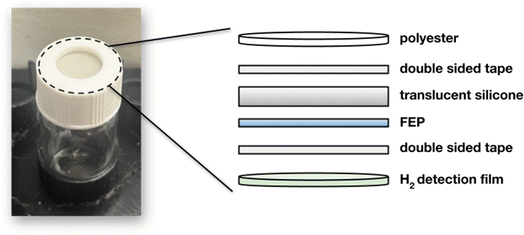
When selecting a sensing material to study a hydrogen evolving system, it is important to consider the experiment duration, predicted amount of H2 generated and other factors as one metal oxide may be preferred over another. The tungsten bronze sensing material has wider limits of detection and a quicker reverse reaction, while the molybdenum bronze is more sensitive to smaller changes in H2 evolution, surveys a smaller range of H2 concentration, and exhibits an extremely slow reverse reaction.26 These colorimetric H2 detection films can be implemented in a variety of relevant configurations, with applications that include (photo)-electrochemical cells, multiwell plates, and flow cells. In this manuscript, two configurations suited for colorimetric detection are discussed; the first of which has been reported previously27 with a once commercially available H2 detection tape on a 96 multiwell plate. Additionally, a novel, more accessible approach is presented where the H2 sensing films have been placed under clear, gas impermeable septa fitted for 20 mL screw cap vials. A photoreactor composed of blue and white strip LEDs, camera, and stir plate are able to house nine sample vials to study light-driven HERs. A RaspberryPi single board computer stores and executes a program written in Python that controls the illumination of the samples and times the digital imagery of the films to monitor reaction progress. Two calibration methods are presented, one uses H2 gas as a standard while the second technique employs a gravimetric method that utilizes the dissolution of zinc in acid. An image analysis program written in Python is used to generate calibration curves correlating the normalized darkness from the images of the films throughout an experiment to a mole fraction of evolved H2. Four light-driven HER chemistries have been described here to show a selection of experiments users could use as standards or expand upon in a research setting. Experiment 1 demonstrates how the detection films can be used to survey the chemical space of a solar H2 evolution system composed of earth abundant reagents. Experiment 2 uses a parallelized synthetic technique to generate 96 unique iridium photosensitizers on a multiwell plate to explore structure–activity relationships between photocatalyst identity and H2 production. Experiment 3 involves different mono and bimetallic in situ generated nanoparticulate WRCs to illustrate how the sensing technology can uncover synergistic effects in H2 activity. While Experiments 1, 2, and 3 use tertiary amines as sacrificial electron donors, Experiment 4 surveys eight different bioavailable donors at varying reaction conditions on a multiwell plate and compares their efficiencies for photo-generating H2. It is the desired outcome of this work that researchers are provided an accessible and effective method of studying solar-driven H2 evolution systems for the development of predictive models for the discovery of novel photocatalytic HERs.
2 Experimental
2.1 Fabrication of hydrogen detection films
![[thin space (1/6-em)]](https://www.rsc.org/images/entities/char_2009.gif) 000–70
000–70![[thin space (1/6-em)]](https://www.rsc.org/images/entities/char_2009.gif) 000) using a protocol for formulating the polymer solution adapted from previously published work.30 For ease of preparation, the following process could be done in tandem with the powder formulation described above. A 500 mL round bottom flask containing 285 mL of water was heated to 35 °C. 15 g of PVA was added and fully dissolved with stirring before heating to 85 °C using a reflux condenser for three hours. The resulting mixture was cooled to room temperature and covered. 360 mg of the tungsten containing or 600 mg of the molybdenum containing hydrogen sensing powder were placed in a 40 mL vial with a minimal amount (2–3 mL) of water and agitated until no clumps remained. 25 g of the PVA solution was poured into the same vial, stirred vigorously for several minutes, and quickly poured into a plastic Petri dish with a 150 mm diameter. The films were cured at room temperature overnight. Film thickness was measured using a digital micrometer and was found to be 40–50 microns when measured at four random points on the film across four different films. Films were stored in reclosable plastic bags until they were ready to be used.
000) using a protocol for formulating the polymer solution adapted from previously published work.30 For ease of preparation, the following process could be done in tandem with the powder formulation described above. A 500 mL round bottom flask containing 285 mL of water was heated to 35 °C. 15 g of PVA was added and fully dissolved with stirring before heating to 85 °C using a reflux condenser for three hours. The resulting mixture was cooled to room temperature and covered. 360 mg of the tungsten containing or 600 mg of the molybdenum containing hydrogen sensing powder were placed in a 40 mL vial with a minimal amount (2–3 mL) of water and agitated until no clumps remained. 25 g of the PVA solution was poured into the same vial, stirred vigorously for several minutes, and quickly poured into a plastic Petri dish with a 150 mm diameter. The films were cured at room temperature overnight. Film thickness was measured using a digital micrometer and was found to be 40–50 microns when measured at four random points on the film across four different films. Films were stored in reclosable plastic bags until they were ready to be used.
2.2 Instrument design
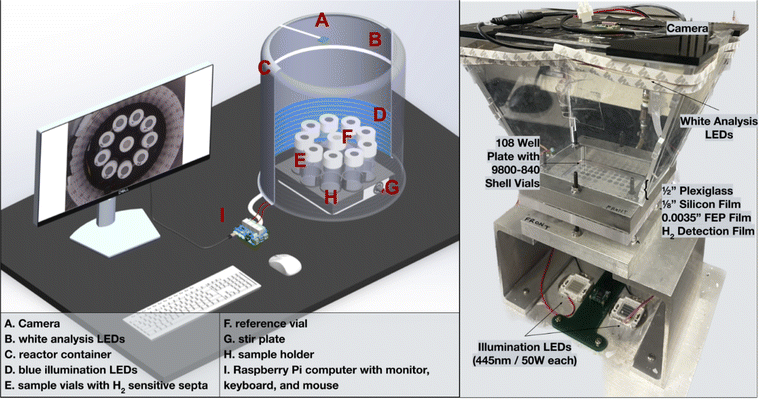 | ||
| Fig. 4 Visual rendering of H2 evolution photoreactor and its labeled parts (left). A picture of the wiring of the reactor set up can be found in the ESI (Fig. S1†). Labeled image of a multiwell plate hydrogen evolution photoreactor (right). Design files for this setup can be found in a previous publication.31 | ||
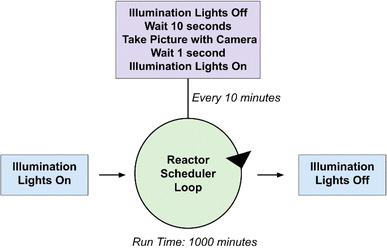
Experiments from both reactors shown in Fig. 4 are controlled with a program written in Python that can be found in the ESI.† A block diagram outlining the operations that occur when executing the photoreactor code has been provided in Fig. 5. Input parameters include the experiment duration and the time intervals at which pictures are taken in minutes. Each experiment begins with an initial image of the films. The vials are illuminated with blue LEDs for the desired experiment length with pauses at distinct intervals where pictures are taken with white light. The timing of the lighting is controlled by a 5 V relay board interfaced to the Raspberry Pi's GPIO interface (see ESI† for wiring details).
Changes in sample RGB intensity can be correlated to a mole fraction of H2 evolved once calibrated. Data is exported as a CSV file and contains the normalized raw reference intensity (the intensity value of the reference normalized by the first image, this value should be 1 for the first image and should only change slightly throughout an experiment), normalized reference intensity (the intensity value of the reference normalized by the first image and by the reference well, this value should always be 1), normalized sample intensity (the averaged RGB values for each sample in every image), H2 mole fraction, H2 volume, H2 amount, and H2 rate at every time point. It also outputs the maximum H2 amount, maximum H2 rate, H2 incubation time (time before any H2 is generated), and H2 plateau time (time H2 evolution halts) for each sample. It is important to note that the image analysis can also be performed manually with any image processing software that allows access to RGB values of pixels.
2.3 Film calibration
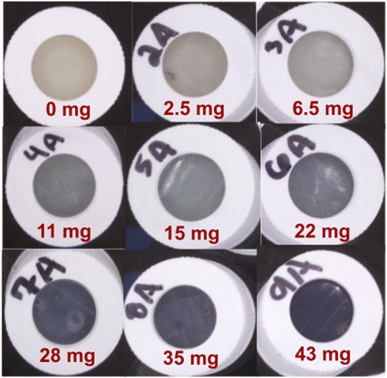
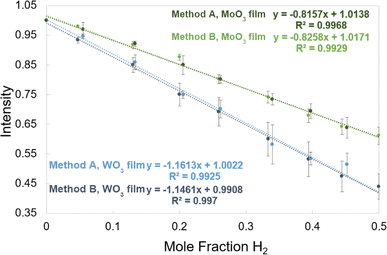
There is great flexibility in how the H2 detection films can be calibrated. The process by which the films were calibrated on the multiwell plate photoreactor has been discussed previously27 and the corresponding calibration curve can be found in the ESI (Fig. S2).† This work presents two methods to survey the analytical signal and the limits of detection of the films for the 20 mL vial photoreactor configuration. Images of the films with no H2 present and pictures showing the films after they have responded were read through the image analysis software described previously to obtain the intensity values of the films for different amounts of H2. Calibration curves were made by plotting intensity vs. mole fraction of H2 which produce a linear relationship with good R2 values and almost identical results for both calibration methods. Their calibration equations can be implemented into the image analysis program to correlate changes in intensity of the films to a quantitative amount of H2.2.4 Chemistries: materials and methods
Four HER experiments have been performed using the H2 detection films as a means of demonstrating the range of the sensing technology. Experiments 1 and 3 were conducted using the tungsten oxide-based films placed under translucent septa fitted for 20 mL scintillation vials and Experiments 2 and 4 were performed using the molybdenum oxide films sealed on multiwell plates.All of the materials used in this system are commercially available, though chloro (pyridine)cobaloxime(III) was synthesized according to literature,37 but can be purchased from Sigma Aldrich. Stock solutions of the PC and WRC were made in 2-methoxyethanol. TEOA was made as a 60% (w/w) solution in deionized water. Nine solutions spanning three different WRC (0.25, 0.5, 1 mM) and PC (0.5, 1, 2 mM) concentrations were made, all of which contained 0.8 mL of the TEOA stock and 7.2 mL of methoxyethanol. These solutions are stable for weeks and be used as internal standards in septum-based and multiwell plate experiments. Images of the films were taken every 10 minutes for a total duration of 1000 minutes of illumination; however, experiments do not require this entire duration to exhibit a range of response in the films.
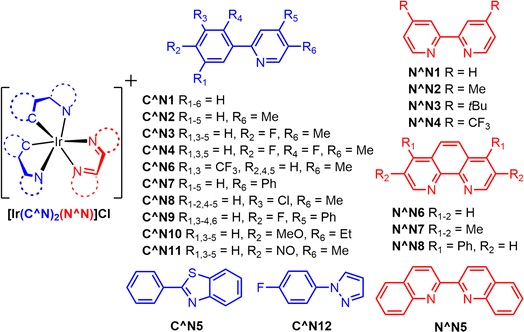 | ||
| Fig. 9 Structures of photocatalysts used in experiment 2. Each complex contains two cyclometallating C^N ligands and one ancillary N^N ligand. All complexes have a Cl− counterion. | ||
Fig. 9 outlines twelve different cyclometallating ligands (C^N) and eight different ancillary (N^N) ligands that were used to synthesize 96 unique iridium(III) photosensitizer in 1.1 mL shell vials. All complexes contain a Cl− counterion. Experimental conditions for the parallelized synthesis were derived from previously published work.38 150 microliters of an aqueous stock solution composed of 30% (w/w) TEOA and 0.65 mM potassium tetrachloropalladate (K2PdCl4) were added to all 96 wells. The samples were sealed with a hydrogen detection film using torqued screws to produce a uniform pressure. The samples were then illuminated for 1000 minutes using the multiwell plate H2 evolution photoreactor, and images of the films were taken every ten minutes.
Conditions for these experiments were taken from a previous publication31 that explored synergistic behavior of bimetallic WRCs using an iridium photosensitizer and sacrificial electron donor. The PC used for this set of experiments was Ir(fmppy)2 (dtbbpy)PF6 (where fmppy = 4′-fluoro-2-phenyl-5-methylpyridine, and dtbbpy = 4,4′-di-tert-butyl-2,2′-bipyridine, synthesized according to literature39) synthesis of the PC starts with iridium(III) chloride hydrate and 2.1 mol equiv. of fmppy in a 5![[thin space (1/6-em)]](https://www.rsc.org/images/entities/char_2009.gif) :
:![[thin space (1/6-em)]](https://www.rsc.org/images/entities/char_2009.gif) 1 ratio of 2-methoxyethanol:water and refluxed overnight. This generated a chloro-bridged iridium dimer that was precipitated with water, filtered, and dried. The resulting dimer was dissolved in a small amount of propylene glycol with 2.1 mol equiv. of dtbbpy and refluxed overnight. The crude material was diluted with water, extracted with ether, salt swapped with KPF6, filtered, and recrystallized with acetonitrile/ether using vapor diffusion. For the HER, TEOA was used as the D, and varying amounts of nickel(II) chloride, tin(II) chloride, and potassium tetrachloropalladate were used as the salt precursors for the in situ generated WRCs. Stock solutions of PC and the metal salts were made in DMSO (dimethyl sulfoxide) and a TEOA 60% (w/w) solution was made in DI (deionized) water. Each sample was composed of 0.8 mL of the aqueous TEOA solution and 7.2 mL of DMSO containing 0.25 mM PC and metal salt solutions all with a total concentration of 0.2 mM. Nine different metal compositions were explored including Pd, Ni, and Sn monometallic samples in addition to PdSn and PdNi bimetallic compositions in the ratios of 1
1 ratio of 2-methoxyethanol:water and refluxed overnight. This generated a chloro-bridged iridium dimer that was precipitated with water, filtered, and dried. The resulting dimer was dissolved in a small amount of propylene glycol with 2.1 mol equiv. of dtbbpy and refluxed overnight. The crude material was diluted with water, extracted with ether, salt swapped with KPF6, filtered, and recrystallized with acetonitrile/ether using vapor diffusion. For the HER, TEOA was used as the D, and varying amounts of nickel(II) chloride, tin(II) chloride, and potassium tetrachloropalladate were used as the salt precursors for the in situ generated WRCs. Stock solutions of PC and the metal salts were made in DMSO (dimethyl sulfoxide) and a TEOA 60% (w/w) solution was made in DI (deionized) water. Each sample was composed of 0.8 mL of the aqueous TEOA solution and 7.2 mL of DMSO containing 0.25 mM PC and metal salt solutions all with a total concentration of 0.2 mM. Nine different metal compositions were explored including Pd, Ni, and Sn monometallic samples in addition to PdSn and PdNi bimetallic compositions in the ratios of 1![[thin space (1/6-em)]](https://www.rsc.org/images/entities/char_2009.gif) :
:![[thin space (1/6-em)]](https://www.rsc.org/images/entities/char_2009.gif) 0.33, 1
0.33, 1![[thin space (1/6-em)]](https://www.rsc.org/images/entities/char_2009.gif) :
:![[thin space (1/6-em)]](https://www.rsc.org/images/entities/char_2009.gif) 1, and 1
1, and 1![[thin space (1/6-em)]](https://www.rsc.org/images/entities/char_2009.gif) :
:![[thin space (1/6-em)]](https://www.rsc.org/images/entities/char_2009.gif) 3. Samples were illuminated for 1000 minutes with pictures being taken every ten minutes.
3. Samples were illuminated for 1000 minutes with pictures being taken every ten minutes.
Experimental conditions were taken from previously published work40 that explored the use of oxalic acid, isopropanol, ethanol, and glycerol as electron donors for light driven H2 evolution. Ir(SCN)2 (bpy)PF6 (where SCN = 2-phenylbenzothiazole, and bpy = 2,2′-bipyridine, synthesized according to literature39) was used as the PC. Synthesis of the PC starts with iridium(III) chloride hydrate and 2.1 mol equiv. of SCN in a 5![[thin space (1/6-em)]](https://www.rsc.org/images/entities/char_2009.gif) :
:![[thin space (1/6-em)]](https://www.rsc.org/images/entities/char_2009.gif) 1 ratio of 2-methoxyethanol and water and refluxed overnight. This generated a chloro-bridged iridium dimer that was precipitated with water, filtered, and dried. The resulting dimer was dissolved in a small amount of propylene glycol with 2.1 mol equiv. of bpy and refluxed overnight. The crude material was diluted with water, extracted with ether, salt swapped with KPF6, filtered, and recrystallized with acetonitrile/ether using vapor diffusion. Potassium tetrachloropalladate was used as the salt precursor for the WRC and AOC, and poly(ethylene glycol) methyl ether thiol (PEG-SH, MW = 1 kDa) served as a capping agent for the in situ generated nanoparticulate species. 5,5′-dimethyl propyl diquat was used as the RS and was synthesized according to literature procedures.17 Synthesis of the RS involved the addition of 1 g of 5,5′-dimethyl-2 2′-bipyridine to 5 mL of 1,3-dibromopropane, refluxed overnight at 125 °C, filtered, and washed with ether. Eight different potentially plant-derived reagents containing hydroxyl group(s) were surveyed as electron donors including oxalic acid, isopropanol, ethanol, benzyl alcohol, glycerol, glucose, fructose, and sucrose. Stock solutions of the palladium salt and PC were made in DMSO and PEG-SH, redox shuttle, and donors were all made in DI water. Each sample consisted of 225 μL of DMSO and 175 μL of water with 0.5–1.5 mM PC, 1.5 mM Pd, 1.5 mM PEG-SH, and 2–8 mM RS. Isopropanol, ethanol, and benzyl alcohol were used at 2.6 M; glycerol, fructose, sucrose, and glucose were used at 1.25 M, and oxalic acid was used at 0.52 M due to limited solubility. Samples were illuminated for 4000 minutes and pictures were taken every 30 minutes.
1 ratio of 2-methoxyethanol and water and refluxed overnight. This generated a chloro-bridged iridium dimer that was precipitated with water, filtered, and dried. The resulting dimer was dissolved in a small amount of propylene glycol with 2.1 mol equiv. of bpy and refluxed overnight. The crude material was diluted with water, extracted with ether, salt swapped with KPF6, filtered, and recrystallized with acetonitrile/ether using vapor diffusion. Potassium tetrachloropalladate was used as the salt precursor for the WRC and AOC, and poly(ethylene glycol) methyl ether thiol (PEG-SH, MW = 1 kDa) served as a capping agent for the in situ generated nanoparticulate species. 5,5′-dimethyl propyl diquat was used as the RS and was synthesized according to literature procedures.17 Synthesis of the RS involved the addition of 1 g of 5,5′-dimethyl-2 2′-bipyridine to 5 mL of 1,3-dibromopropane, refluxed overnight at 125 °C, filtered, and washed with ether. Eight different potentially plant-derived reagents containing hydroxyl group(s) were surveyed as electron donors including oxalic acid, isopropanol, ethanol, benzyl alcohol, glycerol, glucose, fructose, and sucrose. Stock solutions of the palladium salt and PC were made in DMSO and PEG-SH, redox shuttle, and donors were all made in DI water. Each sample consisted of 225 μL of DMSO and 175 μL of water with 0.5–1.5 mM PC, 1.5 mM Pd, 1.5 mM PEG-SH, and 2–8 mM RS. Isopropanol, ethanol, and benzyl alcohol were used at 2.6 M; glycerol, fructose, sucrose, and glucose were used at 1.25 M, and oxalic acid was used at 0.52 M due to limited solubility. Samples were illuminated for 4000 minutes and pictures were taken every 30 minutes.
3 Results and discussion
3.1 Experiment 1: organic dyes and earth abundant water reduction catalysts
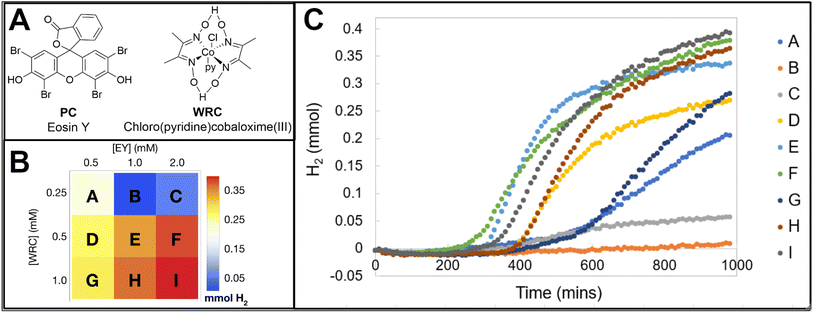
Due to the wealth of data provided by the image analysis software, changes in the concentration of Eosin Y and cobalt complex (structures provided in Fig. 10A) and their impact on the overall hydrogen production, rates of hydrogen production, incubation period, and plateau time can be studied. The reaction conditions and their overall hydrogen activity is shown as an array plot in Fig. 10B and the hydrogen evolution traces of the samples are shown in Fig. 10C. Generally, it is observed that increases in both the PC and WRC lead to higher amounts of hydrogen evolved. Higher concentrations of the photocatalyst yield faster onsets of hydrogen production and longer periods of activity before a plateau is observed. However, the increase in overall hydrogen production between 1 mM and 2 mM [PC] is not that significant, indicating the system may be limited by the amount of light the chromophore can absorb. When the WRC concentration is 0.5 mM, the faster rates and onsets of hydrogen production are exhibited and there is minimal improvement in overall hydrogen production between 0.5 and 1 mM. These findings are similar to what has been previously reported in the literature.3.2 Experiment 2: structure–activity relationships with 96 unique photocatalysts
Fig. 11 displays several metrics provided from the data analysis software including the maximum H2 produced, maximum H2 rate, incubation time, and plateau time for each of the 96 photocatalysts. Top performing PCs for H2 production and rate are C^N5N^N1 and C^N5N^N3. No activity is present for complexes in the C^N11 column or in the N^N5 row. For the samples that evolved H2, incubation times occurred under 200 minutes and plateau times ranged from about 500 minutes to 960 minutes. This data may potentially couple well with high-throughput UV-vis and luminescence spectroscopy experiments or DFT (density functional theory) calculations of the photocatalysts screened in order to further investigate how different photophysical and electronic properties impact H2 evolution.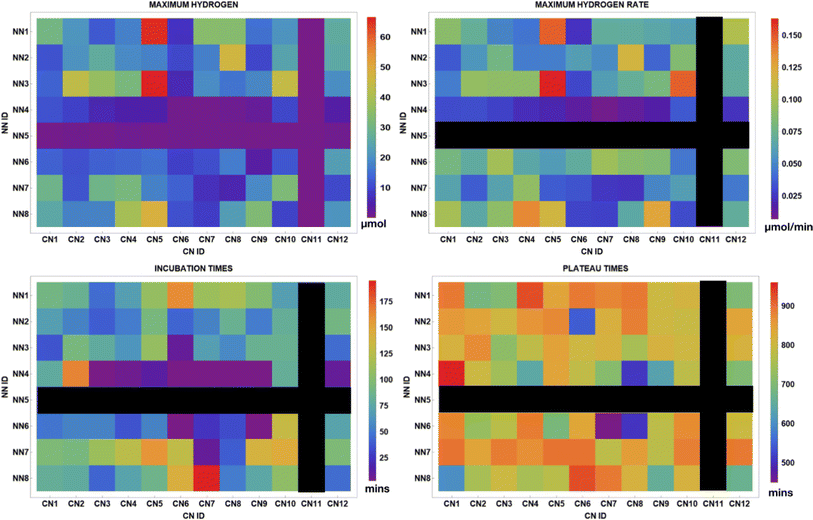 | ||
| Fig. 11 Array plots displaying the total H2 evolved, maximum H2 rate, incubation time, and plateau times for 96 structurally unique iridium photosensitizers used in Experiment 2. | ||
3.3 Experiment 3: mono and bimetallic water reduction catalysts
The colorimetric films accurately and rapidly detect the formed H2, which allows for the identification of synergistic behavior effortlessly. Fig. 12 provides the H2 evolution traces of the samples in addition to array plots that allow for ease in displaying the trends in metal incorporation and H2 output. For the monometallic species, Pd affords a great deal of H2, Ni makes a minimal amount, and Sn is completely inactive. In the Sn/Pd solutions, there is an increase in the H2 production as the ratio of Sn![[thin space (1/6-em)]](https://www.rsc.org/images/entities/char_2009.gif) :
:![[thin space (1/6-em)]](https://www.rsc.org/images/entities/char_2009.gif) Pd increases and both the 1
Pd increases and both the 1![[thin space (1/6-em)]](https://www.rsc.org/images/entities/char_2009.gif) :
:![[thin space (1/6-em)]](https://www.rsc.org/images/entities/char_2009.gif) 1 and 3
1 and 3![[thin space (1/6-em)]](https://www.rsc.org/images/entities/char_2009.gif) :
:![[thin space (1/6-em)]](https://www.rsc.org/images/entities/char_2009.gif) 1 samples exhibit synergistic behavior. The Ni/Pd combinations show an increase in H2 evolution compared to the Ni only sample with lower Ni
1 samples exhibit synergistic behavior. The Ni/Pd combinations show an increase in H2 evolution compared to the Ni only sample with lower Ni![[thin space (1/6-em)]](https://www.rsc.org/images/entities/char_2009.gif) :
:![[thin space (1/6-em)]](https://www.rsc.org/images/entities/char_2009.gif) Pd ratios leading to higher activity; however, no cases of synergy are observed.
Pd ratios leading to higher activity; however, no cases of synergy are observed.
 | ||
| Fig. 12 H2 evolution traces for experiment 3 (left), and array plots of overall H2 evolution at different metal incorporations (right). | ||
3.4 Experiment 4: green hydrogen evolution
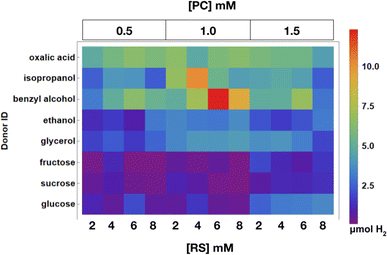
In this experiment, trends in RS and PC concentration on H2 evolution for each donor can be observed. An array plot showing the total H2 evolved in each well is shown in Fig. 13, all additional raw data points for the experiment can be found in the ESI.† Samples with donors that are easier to oxidize such as oxalic acid, benzyl alcohol, and isopropanol samples exhibit the shortest incubation times and larger amounts of H2 evolution. Additionally, species containing more viscous and harder to oxidize donors like glycerol and fructose did not afford much H2 and evolved the gas at slower rates.4 Conclusions
In this work, colorimetric H2 detection films are presented as a cost effective, high-throughput approach for the investigation of photo-driven (HERs). While there is great versatility in how the films can be used, HERs were monitored using a sample configuration containing a reaction vessel that houses nine vials illuminated by blue LEDs, white analysis LEDs, a stir plate, and a camera. Additionally, two experiments were conducted using the films on a multiwell plate using a photoreactor from previous work.27 Images of the films were taken at desired time intervals over the course of a reaction using a RaspberryPi. Data analysis for calibrations and light-driven experiments were performed using a Python script that reports the RGB values of the sample wells for every picture. Two highly linear and accurate calibration methods that correlate the normalized darkness of the films to a mole fraction of hydrogen are presented. Four experiments were conducted to illustrate potential research. These experiments use earth abundant materials as photocatalysts, explore structure–activity relationships of PCs and hydrogen production, investigate the synergy in bimetallic water reduction catalysts, and study the photogeneration of green hydrogen from bioavailable donors.Data availability
The code and analysis scripts along with processed example data supporting this article have been uploaded as part of the ESI.† This section contains a labeled image of the RaspberryPi and relay board wiring configuration for the 20 mL vial photoreactor and the calibration curve used for the analysis of the multi-well plate experiments (PDF). It also includes the processed image analysis data and a movie of the reaction progress from Experiment 2, information on making a mask, image analysis Python script, photoreactor Python script, and sample holder STL file for 3D printing (ZIP files).Author contributions
Savannah Talledo: conceptualization, data curation, formal analysis, investigation, methodology, project administration, resources, visualization, writing – original draft, writing – review & editing. Andrew Kubaney: resources, software, writing – review and editing. Mitchell A. Baumer: resources, visualization, writing – review and editing. Keegan Pietrak: resources. Stefan Bernhard: conceptualization, project administration, writing – review & editing.Conflicts of interest
There are no conflicts to declare.Acknowledgements
We are grateful for the financial support from the US National Science Foundation (CHE-2102460).References
- P. Sun, B. Young, A. Elgowainy, Z. Lu, M. Wang, B. Morelli and T. Hawkins, Environ. Sci. Technol., 2019, 53, 7103–7113 CrossRef CAS PubMed.
- G. Collodi and F. Wheeler, Chem. Eng. Trans., 2010, 19, 37–42 Search PubMed.
- S. P. Luo, E. Mejía, A. Friedrich, A. Pazidis, H. Junge, A. E. Surkus, R. Jackstell, S. Denurra, S. Gladiali, S. Lochbrunner and M. Beller, Angew. Chem., Int. Ed., 2013, 52, 419–423 CrossRef CAS PubMed.
- H. Lv, J. Song, H. Zhu, Y. G. Geletii, J. Bacsa, C. Zhao, T. Lian, D. G. Musaev and C. L. Hill, J. Catal., 2013, 307, 48–54 CrossRef CAS.
- C. Bachmann, B. Probst, M. Oberholzer, T. Fox and R. Alberto, Chem. Sci., 2016, 7, 436–445 RSC.
- I. Tabushi and Y. Akira, J. Org. Chem., 1981, 46, 1899–1901 CrossRef CAS.
- E. H. Edwards, J. Jelušić, S. Chakraborty and K. L. Bren, J. Inorg. Biochem., 2021, 217, 111384 CrossRef CAS PubMed.
- S. F. Chan, M. Chou, C. Creutz, T. Matsubara and N. Sutin, J. Am. Chem. Soc., 1981, 103, 369–379 CrossRef CAS.
- K. Kalyanasundaram, J. Kiwi and M. Grätzel, Helv. Chim. Acta, 1978, 61, 2291–2755 CrossRef.
- K. A. Davis, S. Yoo, E. W. Shuler, B. D. Sherman, S. Lee and G. Leem, Nano Convergence, 2021, 8, 1–19 CrossRef PubMed.
- A. V. Puga, Coord. Chem. Rev., 2016, 315, 1–66 CrossRef CAS.
- H. Hata, Y. Kobayashi, V. Bojan, W. J. Youngblood and T. E. Mallouk, Nano Lett., 2008, 8, 794–799 CrossRef CAS PubMed.
- Y. Bai, C. Li, L. Liu, Y. Yamaguchi, M. Bahri, H. Yang, A. Gardner, M. A. Zwijnenburg, N. D. Browning, A. J. Cowan, A. Kudo, A. I. Cooper and S. Sprick, Angew. Chem., Int. Ed., 2022, 61, e202201299 CrossRef CAS PubMed.
- J. McFarlane, B. Henderson, S. Donnecke and J. S. McIndoe, Organometallics, 2019, 38, 4051–4053 CrossRef CAS.
- M. C. Nevárez Martínez, O. Cavdar, L. P. Haliński, M. Miodyńska, P. Parnicka, B. Bajorowicz, M. Kobylański, L. Lewandowski and A. Zaleska-Medynska, Int. J. Hydrogen Energy, 2022, 47, 15783–15788 CrossRef.
- H. N. Kagalwala, D. N. Chirdon, I. N. Mills, N. Budwal and S. Bernhard, Inorg. Chem., 2017, 56, 10162–10171 CrossRef CAS PubMed.
- M. L. K. Sanchez, C. H. Wu, M. W. W. Adams and B. R. Dyer, Chem. Commun., 2019, 55, 5579–5582 RSC.
- A. A. Nada, M. H. Barakat, H. A. Hamed, N. R. Mohamed and T. N. Veziroglu, Int. J. Hydrogen Energy, 2005, 30, 687–691 CrossRef CAS.
- V. Kumaravel, M. D. Imam, A. Badreldin, R. K. Chava, J. Y. Do, M. Kang and A. Abdel-Wahab, Catalysts, 2019, 9, 276 CrossRef CAS.
- H. Dong, J. Li, M. Chen, H. Wang, X. Jiang, Y. Xiao, B. Tian and X. Zhang, Materials, 2019, 12, 2233 CrossRef CAS PubMed.
- Y. Bai, L. Wilbraham, B. J. Slater, M. A. Zwijnenburg, R. S. Sprick and A. I. Cooper, J. Am. Chem. Soc., 2019, 141, 9063–9071 CrossRef CAS PubMed.
- B. D. Adams and A. Chen, Mater. Today, 2011, 14, 282–289 CrossRef CAS.
- Y. Cui, F. Liang, C. Ji, S. Xu, H. Wang, Z. Lin and J. Liu, ACS Omega, 2019, 4, 7428–7435 CrossRef CAS PubMed.
- L. Chen, A. C. Cooper, G. P. Pez and H. Cheng, J. Phys. Chem. C, 2007, 111, 18995–19000 CrossRef CAS.
- V. Bérubé, G. Radtke, M. Dresselhaus and G. Chen, Int. J. Energy Res., 2007, 31, 637–663 CrossRef.
- Y. Xi, Q. Zhang and H. Cheng, J. Phys. Chem. C, 2014, 118(1), 494–501 CrossRef CAS.
- E. M. Lopato and S. Bernhard, Energy Fuels, 2021, 35, 18957–18981 CrossRef CAS.
- A. V. Vorontsov, I. V. Stoyanova, D. V. Kozlov, V. I. Simagina and E. N. Savinov, J. Catal., 2000, 189, 360–369 CrossRef CAS.
- Z. He, L. Xie, J. Tu, S. Song, W. Liu, Z. Liu, J. Fan, Q. Liu and J. Chen, J. Phys. Chem. C, 2010, 114, 526–532 CrossRef CAS.
- Z. W. Abdullah and Y. Dong, Front. Mater., 2019, 6, 58 CrossRef.
- E. M. Lopato, E. A. Eikey, Z. C. Simon, S. Back, K. Tran, J. Lewis, J. F. Kowalewski, S. Yazdi, J. R. Kitchin, Z. W. Ulissi, J. E. Millstone and S. Bernhard, ACS Catal., 2020, 10, 4244–4252 CrossRef CAS.
- M. Majek, F. Filace and A. J. von Wangelin, Beilstein J. Org. Chem., 2014, 10, 981–989 CrossRef PubMed.
- M. Majek and A. J. von Wangelin, Acc. Chem. Res., 2016, 49, 2316–2327 CrossRef CAS PubMed.
- M. Wang, Y. Na, M. Gorlov and L. Sun, Dalton Trans., 2009, 33, 6458–6467 RSC.
- P. Du and R. Eisenberg, Energy Environ. Sci., 2012, 5, 6012–6021 RSC.
- R. N. Motz, E. M. Lopato, T. U. Connell and S. Bernhard, Inorg. Chem., 2021, 60, 774–781 CrossRef CAS PubMed.
- D. L. Jameson, J. J. Grzybowski, D. E. Hammels, R. K. Castellano, M. E. Hoke, K. Freed, S. Basquill, A. Mendel and W. J. Shoemaker, J. Chem. Educ., 1998, 75, 447–450 CrossRef CAS.
- V. Mdluli, S. Diluzio, J. Lewis, J. F. Kowalewski, T. U. Connell, D. Yaron, T. Kowalewski and S. Bernhard, ACS Catal., 2020, 10, 6977–6987 CrossRef CAS.
- L. T. Tinker, N. D. McDaniel, E. D. Cline, S. Bernhard, R. D. Putnam and T. B. Rauchfuss, Inorg. Synth., 2010, 35, 168–173 CAS.
- E. M. Lopato, S. Talledo, S. Diluzio, V. Mdluli, Z. C. Simon, K. M. McHugh, J. E. Millstone and S. Bernhard, ACS Sustainable Chem. Eng., 2022, 10, 14248–14261 CrossRef CAS.
Footnote |
| † Electronic supplementary information (ESI) available: This section includes a labeled image of the RaspberryPi and relay board wiring configuration for the 20 mL vial photoreactor and the calibration curve used for the analysis of the multiwell plate experiments (PDF). It also includes the processed image analysis data and a movie of the reaction progress from Experiment 2, information on making a mask, image analysis Python script, photoreactor Python script, and sample holder STL file for 3D printing (ZIP files). See DOI: https://doi.org/10.1039/d4dd00070f |
| This journal is © The Royal Society of Chemistry 2024 |

