 Open Access Article
Creative Commons Attribution 3.0 Unported Licence
Deep learning-based recommendation system for metal–organic frameworks (MOFs)†
Xiaoqi
Zhang
 a,
Kevin Maik
Jablonka
 abc and
Berend
Smit
 *a
*a
aLaboratory of Molecular Simulation (LSMO), Institut des Sciences et Ingénierie Chimiques, Ecole Polytechnique Fédérale de Lausanne(EPFL), Rue de l'Industrie 17, CH-1951 Sion, Valais, Switzerland. E-mail: berend.smit@epfl.ch
bLaboratory of Organic and Macromolecular Chemistry (IOMC), Friedrich Schiller University Jena, Humboldtstrasse 10, 07743 Jena, Germany
cHelmholtz Institute for Polymers in Energy Applications Jena (HIPOLE Jena), Lessingstrasse 12-14, 07743 Jena, Germany
First published on 10th June 2024
Abstract
This work presents a recommendation system for metal–organic frameworks (MOFs) inspired by online content platforms. By leveraging the unsupervised Doc2Vec model trained on document-structured intrinsic MOF characteristics, the model embeds MOFs into a high-dimensional chemical space and suggests a pool of promising materials for specific applications based on user-endorsed MOFs with similarity analysis. This proposed approach significantly reduces the need for exhaustive labeling of every material in the database, focusing instead on a select fraction for in-depth investigation. Ranging from methane storage and carbon capture to quantum properties, this study illustrates the system's adaptability to various applications.
1 Introduction
Metal–organic frameworks (MOFs) are crystalline materials composed of metal ions or clusters connected by organic linkers. MOFs' unique structural characteristics, tunability, and high porosity have attracted significant attention in various research and industrial applications such as gas storage and separation, catalysis, sensing, and drug delivery.1,2 With the ever-growing number of synthesized MOFs3,4 and the increasing number of applications,5,6 it is time-consuming and labor-intensive to measure the key performance indicators (KPIs) for each material and each specific purpose.7In recent years, considerable efforts have been made to address this challenge using high-throughput simulation and machine learning (ML).8–14 Rosen et al.15 introduced the QMOF database and showed the power of machine learning in discovering MOFs with targeted electronic structure properties. In the gas-related field, there are various high-throughput screenings and ML models designed for Xe/Kr separation,16,17 hydrogen storage,18,19 carbon dioxide capture,20–22 to name a few. Although these efforts provide valuable data and resources to the MOF community, developing these supervised machine-learning models relies on large-scale computation or experiments. Besides, researchers cannot always find a developed ML model that perfectly matches their needs.
To reduce the cost of labeling a database for a specific application from scratch, more and more trials focus on leveraging pre-trained models and transferring them to related tasks. It reduces data requirements while preserving model efficacy.23,24 For example, Ma et al.25 applied transfer learning from a source model trained for H2 adsorption at specific conditions to predict H2 adsorption under varied conditions and different gas species. Lim and Kim26 showcased knowledge from methane adsorption properties can enhance predictions of methane diffusion properties within MOFs. Despite these successful examples, the performance of transfer learning considerably depends on the task similarity. Methods like Bayesian optimization27 and genetic algorithm28 have been proposed to reduce computational expense. However, these methods require either well-designed acquisition functions or extensive tuning and iterations. Bearing this in mind, we would like a universal tool for MOFs that requires minimal labeling effort for development and is easily scalable to newly designed MOF databases.
Inspired by online recommendation platforms for movies or articles, we aim to develop a recommendation system for MOFs. Conceptually, this system functions similarly to online recommenders; it generates a pool of interesting materials for specific applications based on user-endorsed MOFs. The model learns MOF embedding vectors without supervision, suggesting materials by assessing their similarities to the known top-performing structures. This approach eliminates the need for exhaustive labeling of every material in the database, focusing instead on a fraction for in-depth investigation. Sturluson et al.29 were among the first to link recommenders and properties of nanoporous materials and used this analogy as inspiration for dealing with materials for which a gas adsorption property was missing. In this work, we use the analogy directly: recommend similar materials guided by candidates for a specific application.
Our recommendation system harnesses the power of the Doc2Vec model, a task-agnostic and data-driven representation learning approach for document-structured data.30 It adapts to various applications similarly to how a movie or document recommender tailors suggestions to user preferences. The comprehensive characteristics of MOFs, including the crystallographic information, geometric descriptors, and topology, in the document-structured data ensures its ability to capture gas adsorption, separation, and quantum properties. When faced with an application or a MOF database lacking prior knowledge, the model efficiently navigates researchers to a subset of structures with a minimal number of measurements. This is especially essential in the scenario where the measurements are expensive or laborious.
2 Recommendation model
2.1 Architecture
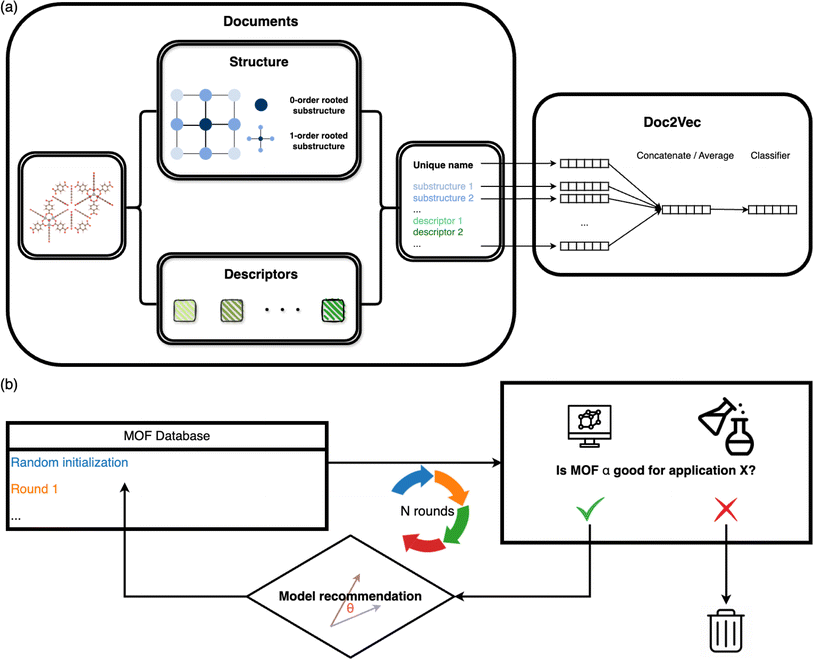
The overall architecture of the MOF recommendation system is based on the Doc2Vec algorithm.30 The methodology requires converting MOFs into document-like structures.31–33 The MOF documents comprise inherent structure connectivities and geometric descriptors, as depicted in the left panel of Fig. 1a. For each atom within a MOF, rooted substructures are identified and represented using ordered element symbols. Substructure searches are limited to the second-order neighbors to balance the need for distinct structures without overwhelming uniqueness. Beyond crystallographic information, the MOF documents incorporate geometric properties computed by Zeo++.34 Continuous values such as density and pore diameters are discretized into binned categories. Additionally, topology, often represented with three letters by reticular chemists that describe the arrangement and connectivity of MOF building blocks,35 is appended to the MOF documents to enrich the depiction of MOFs.These document corpora are then fed into the unsupervised Doc2Vec model. We used the distributed memory algorithm when training the Doc2Vec model, as shown in the right panel of Fig. 1a. In this training process, the algorithm learns to associate words with document contexts, generating unique numeric vector representations for documents and words. We assigned a unique name to each MOF in the dataset to distinguish them, like the title of a document. Each MOF name is linked to a name vector, and every word in the document is associated with a fixed-length word vector. The numeric name vectors and word vectors are initialized to the same length. Throughout the training, contexts are sampled from sliding windows. Each name vector is shared across all the contexts sampled from one document. The name vector represents the missing information from the current context and can act as a memory of the overall MOF characteristics. The model endeavors to predict the next word in a context from averaged or concatenated name vector and word vectors. The name vector and word vectors are adjusted iteratively through this training process, ultimately capturing the semantic information shared across the document contexts.
2.2 Iterative recommendations based on similarity analysis
The underlying assumption guiding the recommendation is that MOFs with similar structural characteristics likely exhibit analogous performance in the same application. Our recommendation model generates fixed-length continuous vectors for document titles (MOF names) and words. The Doc2Vec model learns word semantics by capturing the contextual information surrounding each word. Through this process, words often occurring in similar contexts tend to have similar semantics, thereby being mapped closely in the embedding space.36,37 In parallel, document vectors, or name vectors as we term them, are learned by aggregating the context of all words within each document. This approach results in documents with akin contexts, i.e., similar compositions, geometric properties, and topologies in the case of MOFs, being positioned proximally within the embedding space. Consequently, these distributed embedding vectors enable us to effectively measure the similarities or dissimilarities between the MOFs or words. The cosine similarity metric is employed for this purpose, calculated by | (1) |
In practical applications, we initiate the recommendation process with a subset of MOFs randomly selected from the entire database. Molecular simulations (for gas adsorption and separation) or density functional theory computations (for electronic properties) are then conducted to assess the performance of these chosen MOFs, ranking them based on KPIs specific to the relevant applications. In cases where multiple KPIs are considered, we calculate the summation of the ranks of all the KPIs. Highly ranked MOFs are subsequently queried to the model for the next rounds of selections. The model computes the cosine similarities of MOFs in the database with each queried MOF. The most similar ones are then returned. We combine all the returned structures with high similarity scores and filter the unique ones. Statistical analysis of the similarity scores of the MOF databases we used in this study can be found in Section S1.† The suggested structures are subsequently evaluated by simulations and again input into the model for the next recommendation round. We iteratively perform this process until the properties of suggested MOFs do not improve much. The overall scheme is illustrated in Fig. 1b.
3 Results
Researchers often seek or design new structures with analogous functionalities when a novel structure is discovered for a specific application, typically achieved through functionalization.38,39 Our model proves useful in populating the chemical landscape of interest by discerning the similarities between MOFs in the database. Among all the reported MOF databases,15,40–42 the ARC-MOF database43 contains both experimental and hypothetical structures, which is a good starting point for studying MOF application in gas adsorption and separation. To refine the original dataset and eliminate redundancies, we leverage the ARC-MOF database sourced from mofdscribe.44 In the following sections, we illustrate the practical use of our recommendation model in identifying a subset of compelling structures, especially when limited information about the materials in the database is available. This is demonstrated through two exemplary applications: methane storage and carbon dioxide capture.Remarkably, the recommendation model performs well beyond gas adsorption and separation. We show its further application by suggesting MOFs with band gaps falling within specified ranges from the QMOF database,15 which is a fundamental property of interest for MOF application in gas sensing and detection,45,46 photocatalysis,47,48etc. This reveals the model's ability to capture MOF quantum characteristics.
3.1 Methane storage
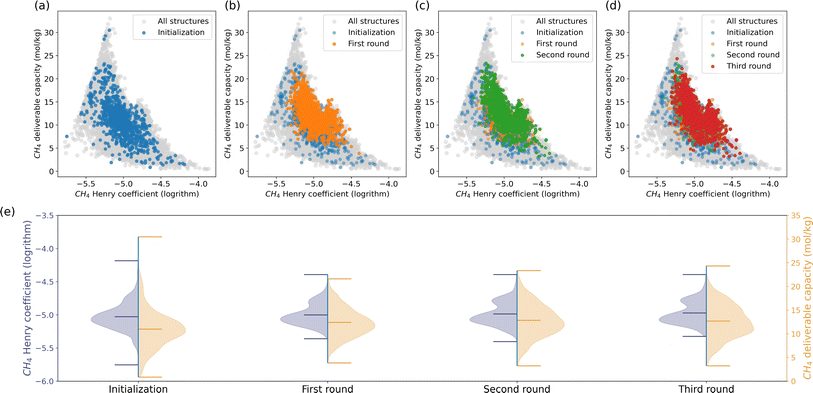
Many research groups have focused on finding the optimal MOF for methane storage to promote using methane as an alternative energy source.49,50 In evaluating the methane storage capacity of porous materials, assessing their adsorption capacity is the fundamental step. The CH4 Henry coefficient, which reflects the affinity between gas and the framework, can serve as a proxy for methane adsorption capacity.51 An adsorbed natural gas (ANG) system consists of porous materials packed into a vessel to store methane at ambient pressure, where understanding methane storage at infinite dilution is crucial.52 Besides the adsorption capacity, optimal materials should also have a high deliverable capacity. The deliverable capacity is defined as the maximum amount of gas that can be released and quantified by the difference in methane loading between high pressure and low pressure.53,54 The CH4 Henry coefficient and deliverable capacity are considered as the key performance indicators (KPIs) in this study. We used molecular simulations to compute these KPIs for each material. The simulation details are in Section 6.1.We launched a recommendation process introduced in Section 2.2 to tackle this challenge. The process involves 1000 randomly selected structures in the initialization, spanning three iterative recommendation rounds as shown in the first row of Fig. 2. By ranking the simulated CH4 Henry coefficients and deliverable capacities, the top-performing structures are then queried to the model for another set of 1000 MOFs in the database with the highest similarity scores. Repetitive structures may be returned. We repeated the labeling process and model recommendations and stopped the iteration where the statistics of the KPIs of the recommended MOFs showed insignificant improvement compared to the last round.
Fig. 2e depicts the minimum, mean, and maximum KPIs for the structures in each round. The initialization structures are a good representative of the dataset. The model recommendations narrow down the ranges of the KPIs as a result of the competitive interplay between the CH4 Henry coefficient and deliverable capacity. The average Henry coefficient and deliverable capacity exhibit a steady increase across each round. Structures with CH4 Henry coefficient around 17.8 mol kg−1 MPa−1 boast a lot. Due to the competitive relationship between CH4 Henry coefficient and deliverable capacity, the three structures with the highest deliverable capacity in the initialization were abandoned in the recommendation stage. Instead, the model recommendations explored a lot of structures with deliverable capacity from 15 to 25 mol kg−1. The maximum deliverable capacity increases across the recommendation rounds.
3.2 Carbon capture
In a carbon capture process, we would like to separate CO2 from the flue gasses, of which the primary component is N2.55 The ideal material should have high CO2 selectivity and maximum CO2 recovered after an adsorption–desorption cycle.50 Therefore, we focus on two KPIs![[thin space (1/6-em)]](https://www.rsc.org/images/entities/char_2009.gif) :
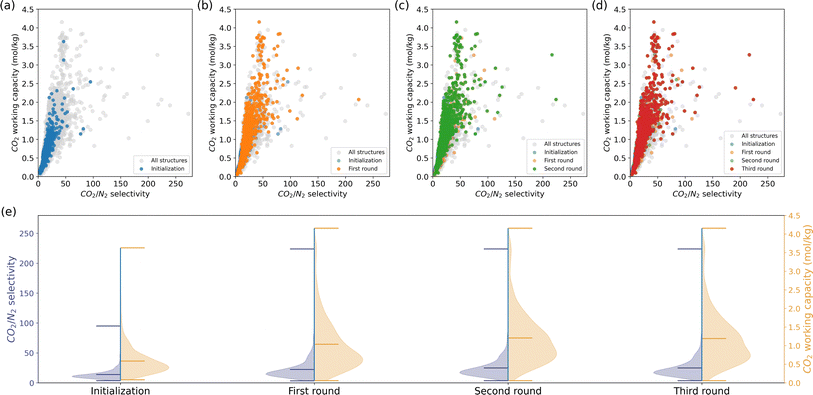
:![[thin space (1/6-em)]](https://www.rsc.org/images/entities/char_2009.gif) CO2 Henry selectivity over N2 and CO2 working capacity. Unlike methane storage, these two KPIs exhibit a positive correlation. We followed the same procedure as the methane storage case, i.e., assessing a subset of randomly selected 1000 MOFs by molecular simulation and querying the recommendation model for similar MOFs to the top-performing candidates iteratively.
CO2 Henry selectivity over N2 and CO2 working capacity. Unlike methane storage, these two KPIs exhibit a positive correlation. We followed the same procedure as the methane storage case, i.e., assessing a subset of randomly selected 1000 MOFs by molecular simulation and querying the recommendation model for similar MOFs to the top-performing candidates iteratively.
The outcomes of each iteration are depicted in Fig. 3. Although the initialization phase assessed only a limited number of structures with high selectivity and working capacity, the subsequent recommendations uncovered numerous structures in the upper right region of Fig. 3b–d. The minimum KPIs did not show impressive improvement due to the large deviations of the KPIs and the large amount of structures in the low-value region. Unlike methane storage, the model recommendations enhanced the mean and maximum KPIs. It is crucial to note that our model's objective is to efficiently populate regions of interest rather than exhaustively discover all top-performing candidates in the database. Therefore, not all the grey points in the upper-right space of the CO2/N2 selectivity—CO2 working capacity figures are recommended.
3.3 MOF recommendations based on band gaps
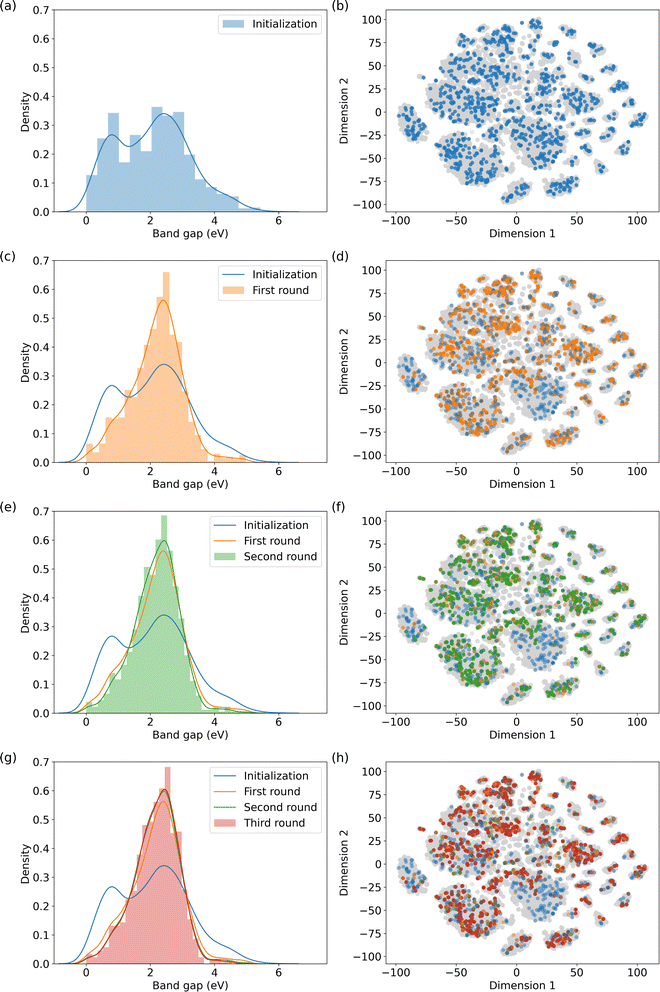
To demonstrate our recommendation model's effectiveness beyond gas adsorption and separation, we leveraged the QMOF database15,56 to study MOF electric properties. Specifically, we focused on recommending MOFs with band gaps falling within a specified range within the QMOF database, namely between 1 to 3 eV. MOFs with band gaps within this range exhibit semiconductor behavior and hold promise for applications such as photovoltaic devices, microelectronics, and sensors.57,58A similar recommendation procedure as described in Sections 3.1 and 3.2 is followed. The only difference lies in the material evaluation methods. Unlike performing molecular simulations in methane storage and carbon capture, we took advantage of the DFT-simulated band gaps from the QMOF database. The results of our recommendation process are illustrated in Fig. 4.
The results indicate that the model embeddings effectively capture quantum information, thereby enabling the identification of MOFs with comparable electronic properties. In Fig. 4, the left panel depicts the normalized distributions of MOF subsets across the initialization and subsequent three recommendation rounds. Initially, a discernible valley exists within the band gap range of 1 to 2 eV. However, this valley is filled through the recommendation rounds, indicating an augmentation in the number of MOFs falling within the specified band gap range. Furthermore, the number of MOFs with band gaps outside the queried range decreases with each round. We also mapped the MOFs in the QMOF database into two-dimensional space using t-SNE59 as shown on the right column of Fig. 4. Recommended MOFs from each round are highlighted. We stopped the recommendation iteration at the third round when the suggested subset closely aligns with the highlighted structures in Fig. 4f.
4 Discussion
4.1 MOF recommendations for methane storage and carbon capture
We further compared the top-performing MOFs identified by our recommendation model and those ranked by simulations. The model recommendations effectively cover a substantial portion (44% for methane storage and 61% for carbon capture) of around 100 top-performing MOFs in the dataset. This is achieved by evaluating less than 15% of the database with more than 22![[thin space (1/6-em)]](https://www.rsc.org/images/entities/char_2009.gif) 000 MOFs, including initialization and three rounds of recommendations. This enhances the efficiency of identifying candidates for specific applications. To achieve a similar percentage mentioned above via random selection, one must evaluate at least 45% of the database (details elucidated in Section S3).†
000 MOFs, including initialization and three rounds of recommendations. This enhances the efficiency of identifying candidates for specific applications. To achieve a similar percentage mentioned above via random selection, one must evaluate at least 45% of the database (details elucidated in Section S3).†
The model recommendations closely align with the top-performing MOFs from simulations, especially for carbon capture. This alignment is evident within regions labeled as A and B in Fig. 5a (for methane storage and carbon capture, respectively). Fig. 5b provides example MOFs from these regions. They share the same metal nodes and topology but exhibit versatile organic ligands. The diversity in organic ligands offers more options for MOF synthesis.60–63 Notably, the organic ligands for methane storage are generally longer, indicating larger pore sizes.62 Some candidates for methane storage remain undiscovered by our recommendation model as they are distributed across the chemical space. Moreover, the embedding vectors exhibit strong performance in downstream supervised regression models (see Section S4).†
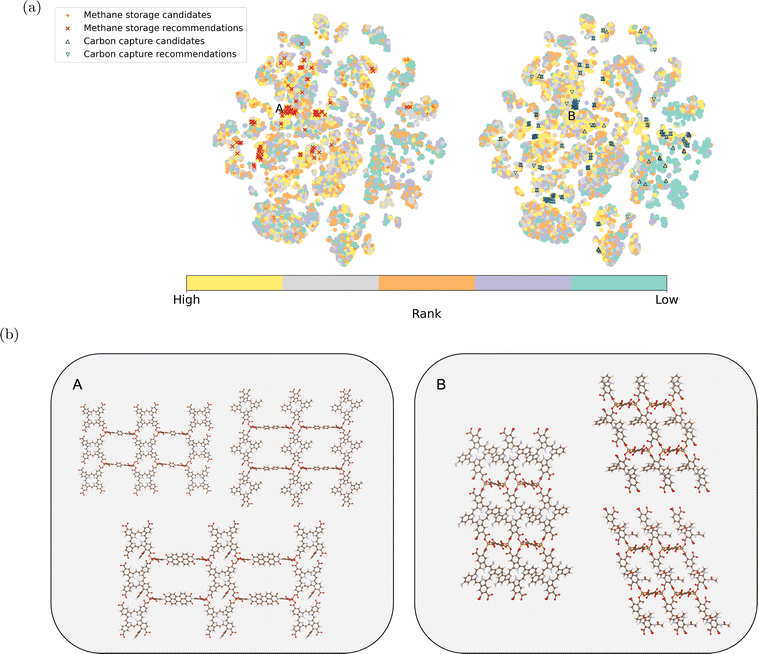 | ||
Fig. 5 (a) Two-dimensional projection of the learned MOF embeddings using t-SNE.59 The color scheme represents the ranking of each material from the simulation for methane storage and carbon capture, respectively. The top 100 candidates for methane storage and carbon capture from simulation and model recommendations are highlighted. Candidates from simulations and model recommendations highly align in two regions labeled A and B. (b) Example MOFs are shown for Region A (methane storage) and Region B (carbon capture). These structures share the same topology and metal node, with variations in organic ligands. (The color scheme for the elements in the example structures follows:  : H; : H;  : C; : C;  : N; : N;  : O; : O;  : Fe). : Fe). | ||
4.2 Semantic analysis of MOF descriptors
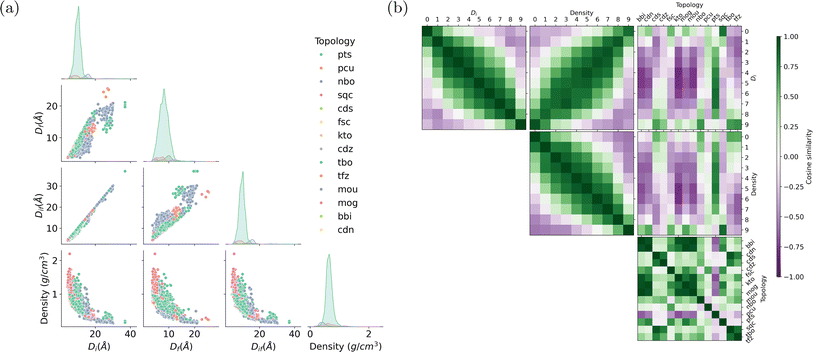
During the training of a Doc2Vec model, the numeric word vectors undergo updates concurrently with the training of numeric document vectors, which encapsulate the content of a document. Similarly, the MOF vector learning process involves updating the embedding vectors associated with words based on their contextual surroundings. For instance, a pore diameter bin with larger values and a density bin with smaller values tend to appear in similar contexts, indicating shared semantic attributes and resulting in close proximity within the embedding space. The word corpus in this study includes MOF substructures and descriptors as shown in Fig. 1a. The learned embedding vectors offer valuable insights into the interrelations among various MOF characteristics by assessing their similarities.We begin by presenting the statistical appearance frequency of descriptors within the MOF documents sourced from the ARC-MOF database, as illustrated in Fig. 6a. The diagonal axis of Fig. 6a reveals the distribution patterns of geometric descriptors for each topology. Descriptors such as pts, pcu, and nbo, representing distinct MOF topologies, exhibit the highest occurrence in the documents. Furthermore, the peaks associated with these descriptors shift from smaller to larger pore diameters. The three types of pore diameters (the largest included sphere, the largest free sphere, and the largest included sphere along the free sphere path) show strong positive correlations. In contrast, the pore diameter is negatively correlated with density, as we can see from the scatter plots in the last row of Fig. 6a.
Fig. 6b shows the pairwise cosine similarities among descriptors. Numeric descriptors, including pore diameters and densities, are categorized into ten bins ranging from small to large values. As expected, adjacent pore diameter and density bins exhibit cosine similarities close to 1, while bins that are farther apart tend to have cosine similarities close to −1. The off-diagonal line in the heatmap between pore diameter and density bins (the middle figure in the first row of Fig. 6b) highlights a darker green shade, indicating a negative correlation—larger pore diameters correspond to lower densities. Interestingly, some topologies exhibit distinct affinities with particular pore size ranges. For example, nbo exhibits high cosine similarity with large pore diameter bins, while sqc and pcu are closely associated with small pore diameter bins. The pts topology demonstrates similarity across all pore diameter ranges, particularly scoring high with medium pore sizes. These trends are consistent with the distributions shown in Fig. 6a. Cubic-shaped, straight and intersecting in a grid pattern, and hexagonal-shaped channels, respectively, characterize the nbo, pcu, and pts topologies. Each topology's distinctive geometric characteristics influence the MOFs' spatial constraints, resulting in preferences for specific pore sizes.1,64,65 Furthermore, the other topologies like bbi, cdn, and fsc, do not show a clear, obvious tendency toward pore diameters or densities due to their limited appearance in the document corpus or their weak correlation with porosity. The control of topology is critical in tuning the porosity of MOFs, a process significantly influenced by the ligand functionalization and synthesis conditions.66
In addition to semantic analysis between geometric descriptors, we extend our exploration to assess the similarity among molecular fragments (see Section S5).† This comprehensive analysis enhances our understanding of the intrinsic relationships between MOF functional groups, porosity, topology, etc.
5 Conclusion
In this work, we presented a deep-learning-based recommendation system for metal–organic frameworks (MOFs), employing an unsupervised model built on Doc2Vec. The iterative recommendation system can be a valuable tool for exploring the vast MOF chemical space, aiding researchers in identifying potential MOFs for tailored applications without prior knowledge about the databases. We demonstrate that it is a practical and resource-effective approach for specific applications through methane storage and carbon capture and its success in capturing MOFs' quantum properties. Beyond recommendations, the model unveils the interrelations of various MOF characteristics and provides insights into materials design. In an era dominated by large language models, our work showcases a novel application of lightweight language models in materials discovery.6 Methods
6.1 Molecular simulation
The gas adsorption and separation performance of MOFs is evaluated by molecular simulation. We applied the TraPPE force-fields67 to describe CH4, CO2, and N2 molecules. Lennard-Jones 12-6 potential using UFF parameters68 were used to simulate the gas-framework interactions, truncated at 12.8 Å with tail corrections.69 Electrostatic interactions were modeled with Ewald summation. All the molecular simulations were performed with RASPA.70 The Henry coefficients of gas molecules at 298 K are simulated by Widom insertions. Grand-canonical Monte Carlo (GCMC) simulations with 6000 equilibrium cycles followed by 6000 production cycles were used to simulate the gas uptakes. We simulated methane adsorption and desorption at 298 K at 65 and 5.8 bar, respectively. The mixture gas for carbon capture contains 15% CO2 and 85% N2. The CO2 and N2 adsorption were simulated at 298 K with an external pressure of 1 bar and desorption conditions of 363 K and 0.1 bar. The deliverable capacity (methane storage) and working capacity (carbon capture) were computed by the difference in loadings at adsorption and desorption conditions.6.2 Crystallographic information encoding
As we adopt a natural language processing (NLP) framework, the geometric and structural information of the MOFs are encoded into textual documents. Each document is assigned a unique title. The encoding of chemistry structure utilizes the Weisfeiler-Lehman (WL) kernel algorithm like the work of Narayanan et al.71The WL algorithm mines through the subgraphs of graphs to compare how similar two graphs are. We applied a similar strategy: considering a MOF as a graph with nodes representing atoms and edges representing bonds. Firstly, we label the atoms in the MOFs according to their species. Each atom's first-order neighbors are extracted, called the substructures. Next, we label the substructures with the sorted atom species. We repeat the labeling process to the second-order neighbors and retain the unique labels in each step.
Additionally, we categorize continuous descriptors into ten bins to encode geometric information. To be independent of probes, we only apply the intrinsic geometric characteristics of MOFs, including density, the largest included sphere diameter, the largest free sphere diameter, and the largest included sphere diameter along the free sphere path. We included all three types of pore diameters since a larger corpus typically yields better embeddings, especially when the words are not rare. Binning the KPI values enables the discretization of continuous data into distinct categories. Categorial descriptors like topology are also appended to the documents.
6.3 Doc2Vec model
We employ the gensim72 package to implement the Doc2Vec model using the distributed memory algorithm, which can capture the context of the MOF fragments. This algorithm simultaneously learns reliable embeddings for MOFs and document words, facilitating further analysis. We embed the MOF documents and associated words into 1000-dimensional continuous vectors. The maximum distance between the current and predicted words within a document was set to 100. No word is dropped due to its scarcity in the corpus. The learning rate was initialized at 3 × 10⁻² and gradually reduced to at least 1 × 10⁻⁵ throughout 100 training epochs.Data availability
The recommendation framework is available at https://github.com/XiaoqZhang/mofgraph2vec.git as open source. The datasets and trained models are available at Zenodo at https://zenodo.org/doi/10.5281/zenodo.11045846.Author contributions
X. Z. developed the recommendation system and analyzed the results. K. M. J. proposed the idea of the project and contributed to discussions. B. S. led the project and provided directions. All authors contributed to the manuscript and have approved the final version of the manuscript.Conflicts of interest
There are no conflicts to declare.Acknowledgements
This work received support from the Swiss National Science Foundation through the SNSF Advanced Grants scheme (grant number 216165). We also acknowledge funding from the USorb-DAC Project, which is supported by a grant from The Grantham Foundation for the Protection of the Environment to RMI's climate tech accelerator program, Third Derivative. The Carl Zeiss Foundation supported parts of the work of K. M. J.References
- H. Furukawa, K. E. Cordova, M. O'Keeffe and O. M. Yaghi, Science, 2013, 341, 1230444 CrossRef PubMed.
- R. Freund, O. Zaremba, G. Arnauts, R. Ameloot, G. Skorupskii, M. Dincă, A. Bavykina, J. Gascon, A. Ejsmont and J. Goscianska, et al. , Angew. Chem., Int. Ed., 2021, 60, 23975–24001 CrossRef CAS PubMed.
- P. Z. Moghadam, A. Li, S. B. Wiggin, A. Tao, A. G. P. Maloney, P. A. Wood, S. C. Ward and D. Fairen-Jimenez, Chem. Mater., 2017, 29, 2618–2625 CrossRef CAS.
- L. T. Glasby, K. Gubsch, R. Bence, R. Oktavian, K. Isoko, S. M. Moosavi, J. L. Cordiner, J. C. Cole and P. Z. Moghadam, Chem. Mater., 2023, 35, 4510–4524 CrossRef CAS PubMed.
- P. Cheng, C. Wang, Y. V. Kaneti, M. Eguchi, J. Lin, Y. Yamauchi and J. Na, Langmuir, 2020, 36, 4231–4249 CrossRef CAS PubMed.
- O. Shekhah, J. Liu, R. Fischer and C. Wöll, Chem. Soc. Rev., 2011, 40, 1081–1106 RSC.
- D. Ongari, L. Talirz and B. Smit, ACS Cent. Sci., 2020, 6, 1890–1900 CrossRef CAS PubMed.
- S. M. Moosavi, K. M. Jablonka and B. Smit, J. Am. Chem. Soc., 2020, 142, 20273–20287 CrossRef CAS PubMed.
- K. M. Jablonka, D. Ongari, S. M. Moosavi and B. Smit, Chem. Rev., 2020, 120, 8066–8129 CrossRef CAS PubMed.
- X. Zhang, Z. Xu, Z. Wang, H. Liu, Y. Zhao and S. Jiang, APL Mater., 2023, 11, 060901 CrossRef CAS.
- C. Altintas, O. F. Altundal, S. Keskin and R. Yildirim, J. Chem. Inf. Model., 2021, 61, 2131–2146 CrossRef CAS PubMed.
- H. Demir, H. Daglar, H. C. Gulbalkan, G. O. Aksu and S. Keskin, Coord. Chem. Rev., 2023, 484, 215112 CrossRef CAS.
- I. Tsamardinos, G. S. Fanourgakis, E. Greasidou, E. Klontzas, K. Gkagkas and G. E. Froudakis, Microporous Mesoporous Mater., 2020, 300, 110160 CrossRef CAS.
- S. Chong, S. Lee, B. Kim and J. Kim, Coord. Chem. Rev., 2020, 423, 213487 CrossRef CAS.
- A. S. Rosen, S. M. Iyer, D. Ray, Z. Yao, A. Aspuru-Guzik, L. Gagliardi, J. M. Notestein and R. Q. Snurr, Matter, 2021, 4, 1578–1597 CrossRef CAS.
- C. M. Simon, R. Mercado, S. K. Schnell, B. Smit and M. Haranczyk, Chem. Mater., 2015, 27, 4459–4475 CrossRef CAS.
- H. Liang, K. Jiang, T.-A. Yan and G.-H. Chen, ACS Omega, 2021, 6, 9066–9076 CrossRef CAS PubMed.
- A. W. Thornton, C. M. Simon, J. Kim, O. Kwon, K. S. Deeg, K. Konstas, S. J. Pas, M. R. Hill, D. A. Winkler, M. Haranczyk and B. Smit, Chem. Mater., 2017, 29, 2844–2854 CrossRef CAS PubMed.
- N. S. Bobbitt and R. Q. Snurr, Mol. Simul., 2019, 45, 1069–1081 CrossRef CAS.
- T. D. Burns, K. N. Pai, S. G. Subraveti, S. P. Collins, M. Krykunov, A. Rajendran and T. K. Woo, Environ. Sci. Technol., 2020, 54, 4536–4544 CrossRef CAS PubMed.
- R. Anderson, J. Rodgers, E. Argueta, A. Biong and D. A. Gómez-Gualdrón, Chem. Mater., 2018, 30, 6325–6337 CrossRef CAS.
- M. Fernandez, P. G. Boyd, T. D. Daff, M. Z. Aghaji and T. K. Woo, J. Phys. Chem. Lett., 2014, 5, 3056–3060 CrossRef CAS PubMed.
- S. Chong, S. Lee, B. Kim and J. Kim, Coord. Chem. Rev., 2020, 423, 213487 CrossRef CAS.
- Y. Kang, H. Park, B. Smit and J. Kim, Nat. Mach. Intell., 2023, 5, 309–318 CrossRef.
- R. Ma, Y. J. Colón and T. Luo, ACS Appl. Mater. Interfaces, 2020, 12, 34041–34048 CrossRef CAS PubMed.
- Y. Lim and J. Kim, Mol. Syst. Des. Eng., 2022, 7, 1056–1064 RSC.
- E. Taw and J. B. Neaton, Adv. Theory Simul., 2022, 5, 2100515 CrossRef CAS.
- Y. G. Chung, D. A. Gómez-Gualdrón, P. Li, K. T. Leperi, P. Deria, H. Zhang, N. A. Vermeulen, J. F. Stoddart, F. You and J. T. Hupp, et al. , Sci. Adv., 2016, 2, e1600909 CrossRef PubMed.
- A. Sturluson, A. Raza, G. D. McConachie, D. W. Siderius, X. Z. Fern and C. M. Simon, Chem. Mater., 2021, 33, 7203–7216 CrossRef CAS.
- Q. Le and T. Mikolov, Distributed Representations of Sentences and Documents, Proceedings of the 31st International Conference on Machine Learning, 2014, pp. 1188–1196 Search PubMed.
- A. M. Ganose and A. Jain, MRS Commun., 2019, 9, 874–881 CrossRef CAS.
- N. E. Zimmermann and A. Jain, RSC Adv., 2020, 10, 6063–6081 RSC.
- A. P. Shevchenko, M. I. Smolkov, J. Wang and V. A. Blatov, J. Chem. Inf. Model., 2022, 62, 2332–2340 CrossRef CAS PubMed.
- T. F. Willems, C. H. Rycroft, M. Kazi, J. C. Meza and M. Haranczyk, Microporous Mesoporous Mater., 2012, 149, 134–141 CrossRef CAS.
- S. R. Batten, N. R. Champness, X.-M. Chen, J. Garcia-Martinez, S. Kitagawa, L. Öhrström, M. O'Keeffe, M. P. Suh and J. Reedijk, Pure Appl. Chem., 2013, 85, 1715–1724 CrossRef CAS.
- V. Tshitoyan, J. Dagdelen, L. Weston, A. Dunn, Z. Rong, O. Kononova, K. A. Persson, G. Ceder and A. Jain, Nature, 2019, 571, 95–98 CrossRef CAS PubMed.
- S. Jaeger, S. Fulle and S. Turk, J. Chem. Inf. Model., 2018, 58, 27–35 CrossRef CAS PubMed.
- P. G. Boyd, et al. , Nature, 2019, 576, 253–256 CrossRef CAS PubMed.
- S. P. Collins, T. D. Daff, S. S. Piotrkowski and T. K. Woo, Sci. Adv., 2016, 2, e1600954 CrossRef PubMed.
- Y. G. Chung, E. Haldoupis, B. J. Bucior, M. Haranczyk, S. Lee, H. Zhang, K. D. Vogiatzis, M. Milisavljevic, S. Ling, J. S. Camp, B. Slater, J. I. Siepmann, D. S. Sholl and R. Q. Snurr, J. Chem. Eng. Data, 2019, 64, 5985–5998 CrossRef CAS.
- P. G. Boyd and T. K. Woo, CrystEngComm, 2016, 18, 3777–3792 RSC.
- S. Majumdar, S. M. Moosavi, K. M. Jablonka, D. Ongari and B. Smit, ACS Appl. Mater. Interfaces, 2021, 13, 61004–61014 CrossRef CAS PubMed.
- J. Burner, J. Luo, A. White, A. Mirmiran, O. Kwon, P. G. Boyd, S. Maley, M. Gibaldi, S. Simrod, V. Ogden and T. K. Woo, Chem. Mater., 2023, 35, 900–916 CrossRef CAS.
- K. M. Jablonka, A. S. Rosen, A. S. Krishnapriyan and B. Smit, ACS Cent. Sci., 2023, 9, 563–581 CrossRef CAS PubMed.
- H. Yuan, N. Li, W. Fan, H. Cai and D. Zhao, Adv. Sci., 2022, 9, 2104374 CrossRef CAS PubMed.
- H. Sohrabi, S. Ghasemzadeh, Z. Ghoreishi, M. R. Majidi, Y. Yoon, N. Dizge and A. Khataee, Mater. Chem. Phys., 2023, 299, 127512 CrossRef CAS.
- Q. Wang, Q. Gao, A. M. Al-Enizi, A. Nafady and S. Ma, Inorg. Chem. Front., 2020, 7, 300–339 RSC.
- V. García-Salcido, P. Mercado-Oliva, J. L. Guzmán-Mar, B. I. Kharisov and L. Hinojosa-Reyes, J. Solid State Chem., 2022, 307, 122801 CrossRef.
- J.-R. Li, J. Sculley and H.-C. Zhou, Chem. Rev., 2012, 112, 869–932 CrossRef CAS PubMed.
- P. G. Boyd, Y. Lee and B. Smit, Nat. Rev. Mater., 2017, 2, 1–15 Search PubMed.
- X. Wu, S. Xiang, J. Su and W. Cai, J. Phys. Chem. C, 2019, 123, 8550–8559 CrossRef CAS.
- Z. Wu, V. Wee, X. Ma and D. Zhao, Adv. Sustainable Syst., 2021, 5, 2000200 CrossRef CAS.
- L. Ali and E. Mahmoud, J. Porous Mater., 2021, 28, 213–230 CrossRef.
- Y. He, W. Zhou, G. Qian and B. Chen, Chem. Soc. Rev., 2014, 43, 5657–5678 RSC.
- C. A. Scholes, M. T. Ho and D. E. Wiley, Technologies, 2016, 4, 14 CrossRef.
- A. S. Rosen, V. Fung, P. Huck, C. T. O'Donnell, M. K. Horton, D. G. Truhlar, K. A. Persson, J. M. Notestein and R. Q. Snurr, npj Comput. Mater., 2022, 8, 1–10 CrossRef.
- M. Usman, S. Mendiratta and K.-L. Lu, Adv. Mater., 2017, 29, 1605071 CrossRef PubMed.
- C. G. Silva, A. Corma and H. García, J. Mater. Chem., 2010, 20, 3141–3156 RSC.
- L. v. d. Maaten and G. Hinton, J. Mach. Learn. Technol., 2008, 9, 2579–2605 Search PubMed.
- S. Bhattacharjee, C. Chen and W.-S. Ahn, RSC Adv., 2014, 4, 52500–52525 RSC.
- A. E. Baumann, D. A. Burns, B. Liu and V. S. Thoi, Commun. Chem., 2019, 2, 1–14 CrossRef.
- M. Eddaoudi, J. Kim, N. Rosi, D. Vodak, J. Wachter, M. O'Keeffe and O. M. Yaghi, Science, 2002, 295, 469–472 CrossRef CAS PubMed.
- R. Banerjee, H. Furukawa, D. Britt, C. Knobler, M. O'Keeffe and O. M. Yaghi, J. Am. Chem. Soc., 2009, 131, 3875–3877 CrossRef CAS PubMed.
- W. Lu, Z. Wei, Z.-Y. Gu, T.-F. Liu, J. Park, J. Park, J. Tian, M. Zhang, Q. Zhang, T. G. Iii, M. Bosch and H.-C. Zhou, Chem. Soc. Rev., 2014, 43, 5561–5593 RSC.
- O. Delgado Friedrichs, M. O'Keeffe and O. M. Yaghi, Acta Crystallogr., Sect. A: Found. Crystallogr., 2003, 59, 22–27 CrossRef PubMed.
- D. Kim, X. Liu and M. S. Lah, Inorg. Chem. Front., 2015, 2, 336–360 RSC.
- J. J. Potoff and J. I. Siepmann, AIChE J., 2001, 47, 1676–1682 CrossRef CAS.
- A. K. Rappe, C. J. Casewit, K. S. Colwell, W. A. I. Goddard and W. M. Skiff, J. Am. Chem. Soc., 1992, 114, 10024–10035 CrossRef CAS.
- K. M. Jablonka, D. Ongari and B. Smit, J. Chem. Theory Comput., 2019, 15, 5635–5641 CrossRef CAS PubMed.
- D. Dubbeldam, S. Calero, D. E. Ellis and R. Q. Snurr, Mol. Simul., 2016, 42, 81–101 CrossRef CAS.
- A. Narayanan, M. Chandramohan, R. Venkatesan, L. Chen, Y. Liu and S. Jaiswal, graph2vec: Learning Distributed Representations of Graphs, arXiv, 2017, arXiv:1707.05005, DOI:10.48550/arXiv.1707.05005.
- R. Rehurek and P. Sojka, NLP Centre, Faculty of Informatics, Masaryk University, Brno, Czech Republic, 2011, vol. 3 Search PubMed.
Footnote |
| † Electronic supplementary information (ESI) available. See DOI: https://doi.org/10.1039/d4dd00116h |
| This journal is © The Royal Society of Chemistry 2024 |

