 Open Access Article
Computer vision enabled high-quality electrochemical experimentation
Keiichi
Okubo
 ab,
Jaydeep
Thik
 a,
Tomoya
Yamaguchi
ab and
Chen
Ling
 *a
*a
aToyota Research Institute of North America, 1555 Woodridge Avenue, Michigan, USA 48105. E-mail: chen.ling@toyota.com; Tel: +1-7349950279
bToyota Motor Corporation, Higashifuji Technical Center, 1200, Mishuku, Susono, Shizuoka, 410-1193, Japan
First published on 4th October 2024
Abstract
The rotating disk electrode (RDE) technique is an essential tool for studying the activity, stability, and other fundamental properties of electrocatalysts. High-quality RDE experimentation requires evenly coating the catalyst layer on the electrode surface, which relies heavily on experience and currently lacks necessary quality control. The lack of an adequate evaluation method to ensure the quality of RDE experimentation, aside from conventional judgment based on expertise, reduces efficiency, complicates data interpretation, and hinders future automation of RDE experimentation. Here we propose a simple, easy-to-execute and non-destructive method that combines microscopy imaging and artificial intelligence-based decision-making to assess the quality of as-prepared electrodes. We develop a convolutional neural network-based method that uses microscopic images of as-prepared electrodes to directly evaluate the sample quality. In a study of electrodes used for the oxygen reduction reaction, the model achieved an accuracy of over 80% in predicting sample qualities. Our method enables the removal of low-quality samples prior to the actual RDE test, thereby ensuring high-quality electrochemical experimentation and paving the way towards high-quality automated electrochemical experimentation. This approach is applicable to various electrochemical systems and highlights the potential of artificial intelligence in automated experimentation.
1 Introduction
The increasing demand to reduce carbon dioxide emissions in the pursuit of carbon neutrality has accelerated the adoption of green technologies to mitigate the reliance on fossil fuels for energy storage, utilization and transportation.1–3 Electrochemical devices such as fuel cells,1–3 water electrolysis,4,5 CO2 electrolysis,6 and ammonia production7 play a pivotal role in this transition. A critical component in these devices is the electrocatalyst, which enables electrochemical reactions under mild conditions with the potential for industrial scalability. In recent decades, research into electrocatalysts has progressed and many technically important catalysts have been rationally developed through the combined utilization of theory, experimentation and, most recently, artificial intelligence.8,9 The close-loop integration of theoretical design, synthesis and characterization, performance evaluation and machine learning based data analysis has the potential to fully automate the search and optimization process, enabling the unprecedented discovery of catalyst with superior functionality.10To fulfill the potential of the on-going development and exploration of electrocatalysts, it is crucial to employ robust and reliable methods that assess true catalytic properties while minimizing the impact of other factors. The most commonly adopted technique for this purpose is the rotating disk electrode (RDE) method. A RDE experiment consists of two essential steps, the electrode preparation and the electrochemical measurements with the electrode rotated in an electrolyte solution.11–13 Information about the reaction rate, kinetics and mechanism can be extracted from the current measured at applied potentials. As one of the few convective electrode systems for which the steady-state mechanism has been rigorously solved in hydrodynamic and convective diffusion equations,14 RDE is used to assess the catalytic activity, clarify surface adsorbate species, acquire fundamental properties of the capacitance and electrochemical surface area, and estimate the redox potentials of catalysts.12,15–17 Due to the advantages of easy implementation, rapid evaluation and ability to mitigate the influence of other transport processes, the RDE method has become widely adopted for evaluation in many applications such as oxygen reduction,17–20 oxygen evolution,21,22 hydrogen oxidation,15,16,23 hydrogen evolution,24 ammonia oxidation,25 urea oxidation,26 alcohol oxidation,27,28 and CO2 reduction.29
One practical challenge in using RDE in electrochemical experimentation is the preparation of high-quality electrodes. This is usually accomplished by casting a catalysis ink on a thin disk electrode. After drying, the catalyst powder is dispersed as a thin coating layer on the electrode. However, as the solvent evaporates, the capillary flow tends to carry particles towards the edge of ring-like patterns instead of forming a thin layer, famously known as the coffee ring effect in physics. This presents a significant obstacle to achieving a perfectly uniform dispersion. Additionally, extending the ink smoothly to the edge of the electrode under continuous evaporation complicates catalyst dispersion.30,31 Consequently, the preparation process often yields non-uniformly distributed catalysts. These non-uniform domains on the electrode can significantly alter catalytic behavior and ultimately affect the measured results. Despite the development of multiple methods to improve the electrode preparation, achieving a thin and uniform catalyst coating remains a significant challenge.31–35
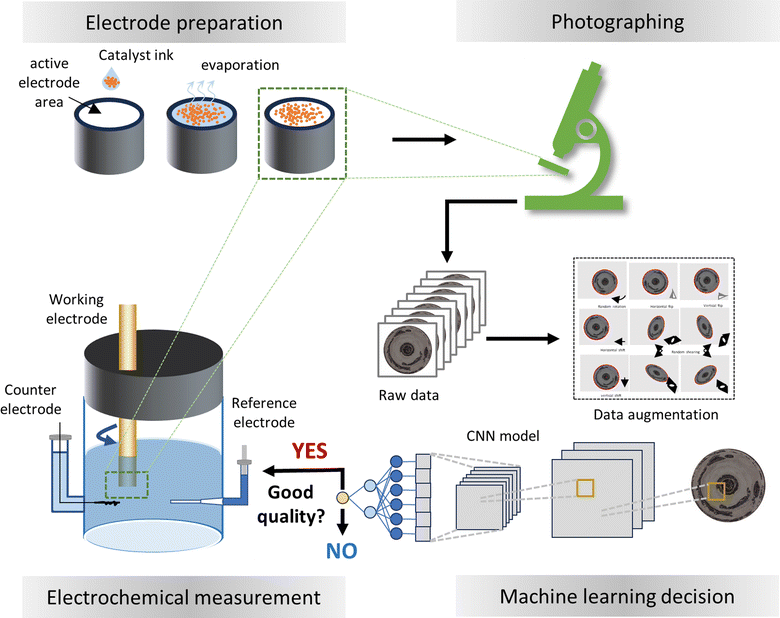
The absence of a reliable method to prepare high-quality disk electrodes underscores the importance of assessing electrode quality. Because the electrochemical measurement subsequent to the electrode preparation is more time-consuming and expensive, the direct knowledge of the electrode quality could help save on experiment costs by avoiding unnecessary testing of poor-quality electrodes, as illustrated in Fig. 1. Additionally, performing measurements solely on high-quality electrodes ensures accurate data gathering and analysis, which is particularly essential for automated experimentation to prevent the contamination of incorrect information. Currently, this step relies heavily on visual inspection and the experience and expertise of researchers. Here, we present a more objective and accurate approach to ensure high-quality RDE experimentation using machine learning methods. Specifically, we created a convolutional neural network (CNN) model to assess the quality of the as-prepared electrodes for oxygen reduction reactions (ORR). The model analyzed the microcopy images of 85 electrodes and achieved an accuracy of 88% in predicting sample quality. Through the removal of low-quality electrodes prior to the actual electrochemical measurements, we estimated that the experimental costs could be reduced by ∼60%. Our method is applicable to various electrochemical systems and demonstrates the great potential of artificial intelligence towards automated experimentation.
2 Method
2.1 Materials
Nafion solution as a binder (DE520 CS type) and isopropyl alcohol were purchased from Fujifilm Wako Chemicals. Ultrapure perchloric acid (Ultrapur) was purchased from Kanto chemical. Platinum nanoparticles deposited carbon (TEC10V30E, TEC10V40E, TEC10V50E, TEC10E30E, TEC10E40E, and TEC10E50E) were obtained from Tanaka Kikinzoku Kogyo K.K. Glassy carbon electrodes (HR2-D1-GC5) and poly-crystal platinum electrodes (HR2-D1-Pt5) were obtained from Hokuto Denko Corporation.2.2 Electrode preparation and electrochemical tests
Catalysts were dispersed in a Nafion solution in a mixture of isopropyl alcohol and water such that the weight ratio of Nafion against carbon ranged from 0.0 to 1.2. A catalyst-coated electrode was prepared so that the amount of carbon in the catalyst was 20 mg carbon per cm2 by drop-casting on a 5 mm grassy carbon electrode. After the electrode preparation, the top view of the catalyst-coated electrode was captured by the VHX-7000 microscope from Keyence Corporation. The magnification ratio was 40–50. Only one image was taken for each individual electrode.To conduct the electrochemical test, 0.1 M perchloric acid diluted with ultrapure water (18.2 mΩ) was used as the electrolyte. Linear sweep voltammograms were recorded with a rotating speed from 400 to 2400 rpm in an oxygen saturated electrolyte. The sweep direction was anodic, and the sweep rate was 0.01 V s−1.
2.3 Quantifying the electrode quality
To obtain the quality of as-prepared RDE electrode we conducted electrochemical measurements to estimate the Koutecky–Levich slopes from the linear sweep voltammogram experiments. The Koutecky–Levich equation states that the electric current from an electrode is determined by the kinetics of catalytic reaction and the mass transport of reactants, the latter of which is controlled by the rotating speed.14 | (1) |
The Koutecky–Levich slope (kKL) encodes the physical properties of A, D, ν and C
 | (2) |
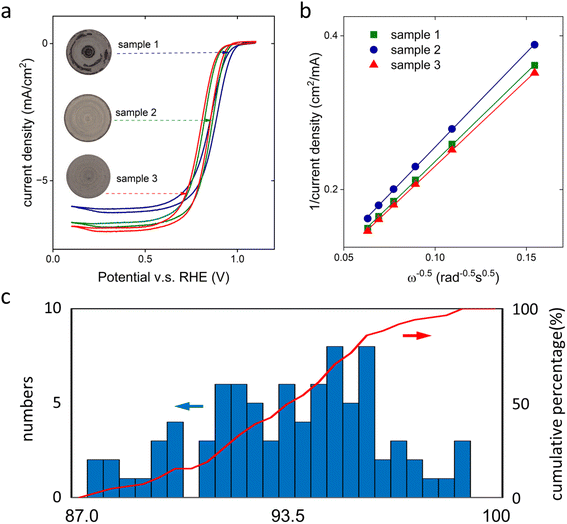
If the experiment is conducted at sufficiently high reaction rates, the resistance of the kinetic reaction could be neglected ( in eqn (1)). For example, Fig. 2a shows the measured ORR sweep voltammogram. The relationship between i−1 at a lower potential of 0.3 V against the reference hydrogen electrode (RHE) and ω−0.5 passed the origin of coordinates (Fig. 2b) for three different sized electrodes, suggestion the intercept in eqn (1) became zero under the measurement conditions. kKL is then obtained by measuring the current at different rotating speeds
 | (3) |
Assuming the experimentation under constant D, ν and C, kKL is only affected by the active area, as shown in Fig. 2c. It indicates the values of kKL could be utilized to quantify the uniformity of the catalyst coating on the electrode. In a uniform coating, the catalyst covers the entire electrode surface so that A ≡ A0 = 0.25πd2, where d is the diameter. A non-uniform coating will generate an active surface less than A0. The uniformity is therefore quantified as the coverage of catalyst on the electrode surface
| θKL = A/A0 | (4) |
To obtain the active area from kKL from eqn (2), it is necessary to estimate D, ν and C. We consider a platinum electrode for ORR, for which the entire surface is active and hence the active area equals to the geometric area. Fitting the data in Fig. 2c gives
 | (5) |
| A = 0.41kKL−1 | (6) |
This equation is derived for the ORR in 0.1 M perchloric acid solution, measured at 0.3 V vs. RHE from the voltammograms under the rotating speed between 400 to 2400 rpm. By keeping these conditions unchanged in the measurements, the combination of eqn (4)–(6) gives
| θKL = αkKL−1A0−1 = 0.52d−2kKL−1 | (7) |
It should be noted that the same procedure can be applied for other electrochemical systems. The coefficient in eqn (7) should be re-evaluated due to the change of diffusion coefficient, kinematic viscosity, and the analyte concentration.
2.4 Machine learning
Convolutional neural networks were implemented through the Keras provided by TensorFlow. The training batch size was 32, and the number of training epochs was 200. The learning rate was eventually reduced according to the following regulations. When the loss of the validation set was not reduced by 10 times in a row, the original learning rate was multiplied by 0.9. The starting learning rate and minimum learning rate were 0.05 and 0.0001, respectively. When the loss of the validation set was not reduced by 20 times in a row, the learning process was stopped to avoid overfitting. The total data size contained the microscopic photos for 85 unique electrodes. We used the same ratio of 41![[thin space (1/6-em)]](https://www.rsc.org/images/entities/char_2009.gif) :
:![[thin space (1/6-em)]](https://www.rsc.org/images/entities/char_2009.gif) 18
18![[thin space (1/6-em)]](https://www.rsc.org/images/entities/char_2009.gif) :
:![[thin space (1/6-em)]](https://www.rsc.org/images/entities/char_2009.gif) 26 for training
26 for training![[thin space (1/6-em)]](https://www.rsc.org/images/entities/char_2009.gif) :
:![[thin space (1/6-em)]](https://www.rsc.org/images/entities/char_2009.gif) validation
validation![[thin space (1/6-em)]](https://www.rsc.org/images/entities/char_2009.gif) :
:![[thin space (1/6-em)]](https://www.rsc.org/images/entities/char_2009.gif) testing in all the experiments. Before the data splitting, the whole dataset was randomly shuffled to remove artificial patterns. Binary cross entropy and Adam were selected as the cost function and the optimizer for CNN, respectively.
testing in all the experiments. Before the data splitting, the whole dataset was randomly shuffled to remove artificial patterns. Binary cross entropy and Adam were selected as the cost function and the optimizer for CNN, respectively.
2.5 Quantification of the model performance
We assumed that the RDE method contained two essential steps: the preparation of electrodes and the electrochemical measurement. The performance of the model in assisting the high-quality electrochemical experimentation is evaluated by calculating the time required for the entire experimental process. The time for each step is denoted as t1 and t2, respectively. Because electrodes are prepared with varying quality, we assume the high-quality experimentation is only achievable in good electrode samples. Assuming the possibility to prepare a good electrode sample is p0, the time for high-quality experimentation is increased by | (8) |
The implementation of artificial intelligence prior to the electrochemical experimentation determines positive samples, either true positive (TP) and false positive (FP), to conduct the experiments. The time for high-quality experimentation is increased by
 | (9) |
 | (10) |
3 Results
3.1 Qualitative analysis of the microscopic images
Three examples of catalyst-coated glassy carbon electrodes are shown in the insert of Fig. 3a. Despite the same procedure being used to prepare these electrodes, the microscopic images reveal clear differences in the uniformity of the gray area, which represents the deposited platinum-based metal nanoparticles. Sample 1 exhibited a highly non-uniform coating, while samples 2 and 3 showed better uniformity. The variation of the uniformity resulted in appreciably different sweep voltammograms. At 0.3 V vs. RHE, the current delivered by sample 3 was 11% higher than that of sample 1 (Fig. 3a). The quantitative coating uniformity was assessed by measuring the current densities at different rotating rates and fitting the KL-slope (eqn (3), Fig. 3b). The calculated θKL revealed an increase of the coverage of the catalyst layer on the glass carbon electrode from 87.7% to 91.8% and 96.4% for samples 1–3, respectively (Fig. 3b). Such an agreement confirmed that there was a quantitative correlation between the quality of the as-prepared RDE electrode and the microscopic information.We extended our study to include a total of 85 electrodes by varying the choices of catalyst powders, loadings, amounts of ionomer, and solvents. The same protocol was used to prepare the electrode and executed by the same experienced researcher. Despite the efforts to alleviate the difference caused by sample preparation, the electrode quality displayed a large variation (Fig. 3c). None of the electrodes showed a perfect coating, with the highest and smallest θKL in a skewed Gaussian-like distribution being 98.8% and 87.0%, respectively. On average, the θKL was 93.6% with a standard deviation of 2.8%.
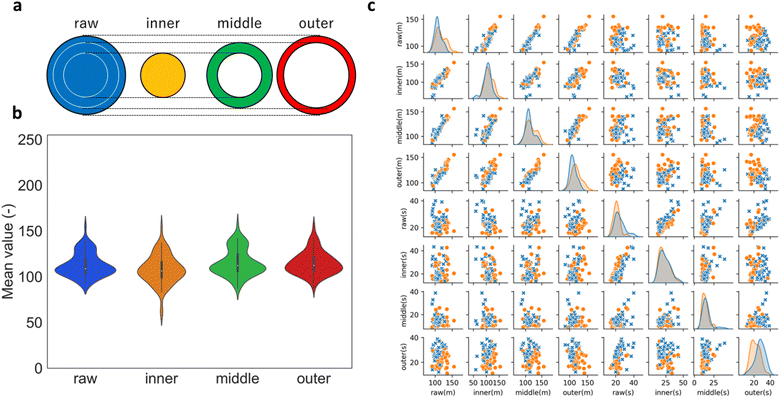
We examined whether the sample preparation protocol applied in the current study created a non-uniform distribution of catalysts at a specific location of the disk electrode. The electrode was segmented into three regions with equal areas: the inner, middle, and outer part of the disk (Fig. 4a). In the microscopic images, a low (high) pixel value indicates more (less) regions with a black color, or equivalently, more (less) bare-electrode surface in the sample image. As shown in Fig. 4b, the averaged image pixels did not show any clear difference except for the two samples with low-valued pixels in the inner region, indicating the distribution of catalyst is largely non-variant in different regions. This conclusion is further confirmed by the weak correlation between θKL and the mean and standard deviation of the pixels in the three regions, as shown in Fig. 4c. The observation that the mean of the pixels cannot be directly correlated to the coverage on the electrode surface highlights the need for a more quantitative method to establish the actual coverage from the electrode photo, despite the instructive clues about the sample quality from the visual inspection of the microscopic photo.36,37
We then employed a convolutional neural network to directly correlate the θKL information to the microscopic photo of the disk electrode (Fig. 5a). Our model was designed as a classification method that identified electrodes with good and poor qualities.38 We set the averaged θKL, 93.6%, as the threshold to create balanced positive and negative examples. A coverage higher than 93.6% is tagged as a good electrode and vice versa. The classification model could effectively distinguish electrodes with good quality for subsequent examinations. While it would be possible to predict the value of θKL directly, we did not pursue this approach in the current work, as knowledge of the coverage ratio did not provide extra benefit in deciding whether to continue the experiment.
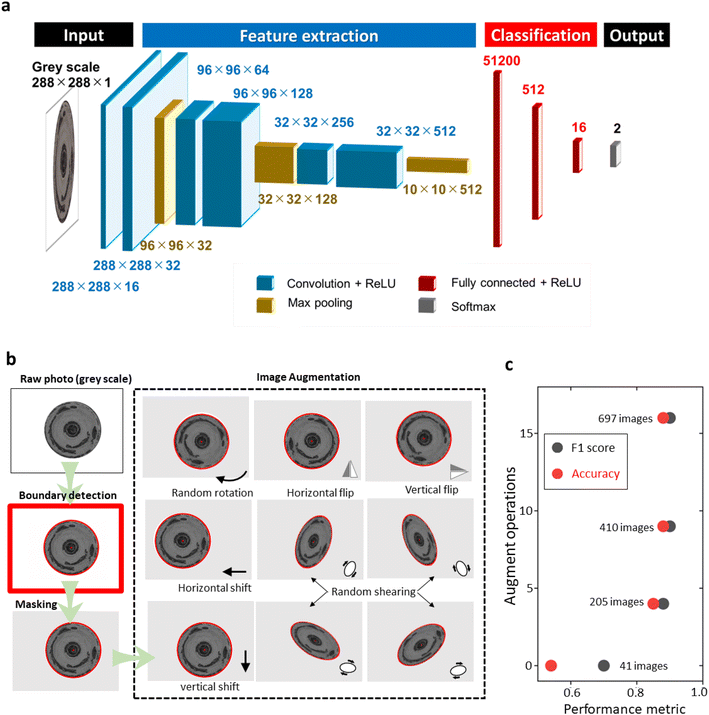 | ||
| Fig. 5 Machine learning model. (a) Architecture of the convolutional neural network model. (b) Image augmentation process. (c) Influence of data size on the model performance. | ||
As a data-driven technique, the performance of machine learning algorithms is strongly influenced by the size and quality of the training dataset. The more data fed to the model usually brings better predicting capability.39 The convolutional neural network is especially known to be highly data-dependent.40 However, the augmentation of a large dataset through continuously repeated experiments is time-consuming and expensive. We used an image preprocessing procedure to artificially increase the dataset (Fig. 5b). The procedure involved converting the raw microscopic image to grayscale, applying a Hough transformation to identify the edge of the disk electrode, and segmenting the region of interest accordingly. We then applied four types of elementary operations (rotating, flipping, shifting, and shearing) to create artificial images. The augmentation of the dataset allowed us to create a larger and more diverse training dataset. Fig. 5c shows the effect of data augmentation on the CNN-model performance. Without data augmentation, the accuracy of the model was only 54% on the testing set, indicating that the CNN model barely discovered any patterns beyond random guessing. After creating four and nine artificial images for each electrode photo, the accuracy rapidly increased to 85% and 88%, respectively. Further increasing the number of artificial images marginally affected the accuracy of the model. To balance the performance and computational cost, we decided to use nine random operations for data augmentation in the following studies.
Table 1 summarizes the performance of the CNN-model in a set of statistical metrics, including accuracy, precision, recall, and F1 score for 10 random training-testing splitting. Among these, the accuracy estimates the percentage of correct predictions (true positive and true negative) in all predictions, while the F1 score takes into account both the precision and recall of the classification in the harmonic mean. Both these two values were above 80%, respectively, indicating the good classification of sample quality on the testing datasets. We also trained a support vector machine (SVM) model on the same task as the baseline comparison. The input of the SVM-model was the mean and standard deviation of pixel values in the microscopic images. On average, the accuracy of the SVM model was only 0.59, indicating the classification was only better than a random guess (accuracy 0.5). The accuracy was improved to 0.73 if the preprocessed means and standard deviations in the outer, middle, and inner regions of the electrodes were used as the input, but still significantly lower than that from the CNN classifier. The improved performance demonstrated the better capability of CNN to process image-type information and handle the complex pattern in correlation with the final properties.
| Training-testing splitting | Accuracy | Precision | Recall | F1 score |
|---|---|---|---|---|
| 1 | 0.88 | 1.00 | 0.75 | 0.86 |
| 2 | 0.73 | 0.75 | 0.69 | 0.72 |
| 3 | 0.88 | 0.82 | 1.00 | 0.90 |
| 4 | 0.88 | 1.00 | 0.80 | 0.89 |
| 5 | 0.77 | 0.73 | 0.85 | 0.79 |
| 6 | 0.85 | 0.75 | 1.00 | 0.86 |
| 7 | 0.77 | 0.65 | 1.00 | 0.79 |
| 8 | 0.85 | 0.80 | 0.80 | 0.80 |
| 9 | 0.73 | 0.69 | 0.75 | 0.72 |
| 10 | 0.73 | 1.00 | 0.59 | 0.74 |
| Average | 0.81 ± 0.06 | 0.82 ± 0.13 | 0.82 ± 0.13 | 0.81 ± 0.06 |
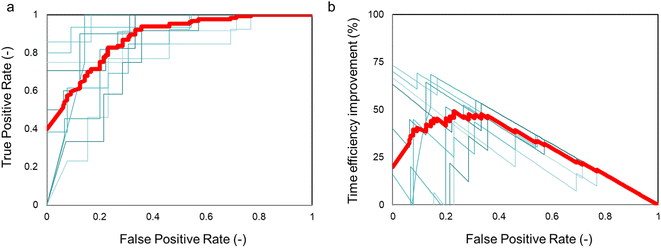
To further verify the performance of our method, we constructed the receiver operating characteristic curve (ROC) for each model.39 The ROC curve plots the true positive rate (TPR), also known as recall, as a function of the false positive rate (FPR). The TPR is calculated as the percentage of positive cases correctly categorized as positive out of actual positive cases, while the FPR is calculated as the percentage of negative cases wrongly categorized as positive out of actual negative cases. The ROC curve is obtained by varying the threshold that separates the positive and negative samples. The area under the curve (AUC) serves as a quantitative measure of model quality, with a perfect classification having an AUC of 1 and a model randomly selecting two states having an AUC of 0.5. As shown in Fig. 6a, the average AUC of the 10 CNN-models was 0.88 ± 0.07, further confirming that the CNN method effectively distinguished electrode samples of good and bad qualities from their microscopic photos.
Our CNN-model provided a rapid and non-destructive method for evaluating the quality of electrodes before performing the RDE experiments. The knowledge of sample quality can be directly utilized to determine whether the subsequent experiment should be continued or not, thereby ensuring the high-quality of electrochemical experimentation. An important function enabled by the CNN evaluation is the ability to avoid misinterpretation of experimental data caused by poor quality sample preparation. Samples with poor quality but misclassified for subsequent experimentation are false positive predictions. Therefore, it is essential to evaluate the false positive score to assess the ability of the machine learning model to remove bad samples from further experimentation. Without the machine learning classification, all samples will be considered as good electrodes, thereby giving a false positive rate of 0.5. Another important metric to assess the impact of the CNN-evaluation is the improved efficiency of the RDE experimentation. Fig. 6b shows the time efficiency to collect high-quality data with the assistance of CNN-evaluation. Assuming a reasonable time of 1 hour for electrode preparation and 4 hours for the RDE experimentation in a manual experiment, the average η% was ∼50%. Importantly, such an improvement seemed to plateau at a low false positive rate of ∼0.15–0.35, a significant reduction from the original 0.50 without CNN-evaluation. Under this range of the false positive rate, the true positive rate was around 70–90% (Fig. 6a). These results suggested the model could be implemented to remove the majority of bad electrodes while still keeping a large number of good electrodes for subsequent experimentation. It should be noted that the actual efficiency improvement will depend on the specific experimental task and conditions, and the values reported here are only estimations based on reasonable assumptions. For instance, assuming a fully automated sample preparation time of 0.25 hours, the η% was estimated to be ∼80%. Nevertheless, our results clearly demonstrate that the CNN-evaluation significantly enhances the efficiency of the high-quality electrochemical experimentation by avoiding the effort and time wasted on low-quality samples.
4 Conclusions
In summary, in the current study we propose and demonstrate a simple, easy-to-execute and non-destructive method for high-quality electrochemical experimentation. Our approach combines a microscopy imaging process and artificial intelligence-based decision-making process to remove non-valuable samples before electrochemical testing to ensure the subsequent high-quality experimentation of the rotating disk electrode tests. We demonstrate the entire pipeline, from data collection, augmentation to model construction and evaluation, in the analysis of oxygen reduction reaction electrodes. Our results achieved an accuracy of over 80% to correctly identify electrodes with good and bad quality and the method was estimated to improve the efficiency of the entire electrochemical experiments by ∼50%. We believe that this method can be transferred to other electrochemical reactions and eliminate the discrepancy caused by the uncertainty of sample qualities. Moreover, our proposed method provides the direct means of quality control without human intervention, a critical step towards the implementation of fully automated experimentation. It is therefore believed that our model case could pave the way toward fully automated material experimentation in the future.Data and code availability
The code and data developed and expanded upon in this work can be found at GitHub – chemistryannarbor/Computer-Vision-Enabled-High-quality-Electrochemical-Experimentation (https://github.com/chemistryannarbor/Computer-Vision-Enabled-High-quality-Electrochemical-Experimentation).Conflicts of interest
A patent application is pending for the technology reported in the current work.Acknowledgements
The authors wish to thank Debasish Banerjee and Ryuta Sugiura from Toyota Research Institute of North America, Masazumi Kikuchi, Shinichi Saito, Takashi Miyanohara, and Yoshiyuki Takeda from Toyota Motor Corporation for their support and suggestions.References
- T. Yoshizumi, H. Kubo and M. Okumura, in SAE Technical Paper Series, SAE International, 400 Commonwealth Drive, Warrendale, PA, United States, 2021 Search PubMed.
- Y. Wang, D. F. Ruiz Diaz, K. S. Chen, Z. Wang and X. C. Adroher, Mater. Today, 2020, 32, 178–203 CrossRef CAS.
- K. Jiao, J. Xuan, Q. Du, Z. Bao, B. Xie, B. Wang, Y. Zhao, L. Fan, H. Wang, Z. Hou, S. Huo, N. P. Brandon, Y. Yin and M. D. Guiver, Nature, 2021, 595, 361–369 CrossRef CAS PubMed.
- S. Shiva Kumar and V. Himabindu, Mater. Sci. Energy Technol., 2019, 2, 442–454 Search PubMed.
- H. A. Miller, K. Bouzek, J. Hnat, S. Loos, C. I. Bernäcker, T. Weißgärber, L. Röntzsch and J. Meier-Haack, Sustainable Energy Fuels, 2020, 4, 2114–2133 RSC.
- G. Wang, J. Chen, Y. Ding, P. Cai, L. Yi, Y. Li, C. Tu, Y. Hou, Z. Wen and L. Dai, Chem. Soc. Rev., 2021, 50, 4993–5061 RSC.
- G. Qing, R. Ghazfar, S. T. Jackowski, F. Habibzadeh, M. M. Ashtiani, C.-P. Chen, M. R. Smith III and T. W. Hamann, Chem. Rev., 2020, 120, 5437–5516 CrossRef CAS PubMed.
- T. A. A. Batchelor, J. K. Pedersen, S. H. Winther, I. E. Castelli, K. W. Jacobsen and J. Rossmeisl, Joule, 2019, 3, 834–845 CrossRef CAS.
- S. Wang, H. Lin, Y. Wakabayashi, L. Q. Zhou, C. A. Roberts, D. Banerjee, H. Jia and C. Ling, J. Energy Chem., 2023, 80, 744–757 CrossRef CAS.
- B. Burger, P. M. Maffettone, V. V. Gusev, C. M. Aitchison, Y. Bai, X. Wang, X. Li, B. M. Alston, B. Li, R. Clowes, N. Rankin, B. Harris, R. S. Sprick and A. I. Cooper, Nature, 2020, 583, 237–241 CrossRef CAS PubMed.
- K. J. J. Mayrhofer, D. Strmcnik, B. B. Blizanac, V. Stamenkovic, M. Arenz and N. M. Markovic, Electrochim. Acta, 2008, 53, 3181–3188 CrossRef CAS.
- G. Chen, M. Li, K. A. Kuttiyiel, K. Sasaki, F. Kong, C. Du, Y. Gao, G. Yin and R. R. Adzic, Electrocatalysis, 2016, 7, 305–316 CrossRef CAS.
- S. S. Kocha, K. Shinozaki, J. W. Zack, D. J. Myers, N. N. Kariuki, T. Nowicki, V. Stamenkovic, Y. Kang, D. Li and D. Papageorgopoulos, Electrocatalysis, 2017, 8, 366–374 CrossRef CAS.
- H. Iden and A. R. Kucernak, J. Electroanal. Chem., 2014, 734, 61–69 CrossRef CAS.
- K. Okubo, J. Ohyama and A. Satsuma, Chem. Commun., 2019, 55, 3101–3104 RSC.
- J. Ohyama, K. Okubo, K. Ishikawa, T. Saida, Y. Yamamoto, S. Arai and A. Satsuma, ACS Appl. Energy Mater., 2020, 3, 1854–1859 CrossRef CAS.
- H. Lin, Z. Hu, K. H. Lim, S. Wang, L. Q. Zhou, L. Wang, G. Zhu, K. Okubo, C. Ling, Y. S. Kim and H. Jia, ACS Catal., 2023, 13, 5635–5642 CrossRef CAS.
- G. W. Sievers, A. W. Jensen, J. Quinson, A. Zana, F. Bizzotto, M. Oezaslan, A. Dworzak, J. J. K. Kirkensgaard, T. E. L. Smitshuysen, S. Kadkhodazadeh, M. Juelsholt, K. M. Ø. Jensen, K. Anklam, H. Wan, J. Schäfer, K. Čépe, M. Escudero-Escribano, J. Rossmeisl, A. Quade, V. Brüser and M. Arenz, Nat. Mater., 2021, 20, 208–213 CrossRef CAS PubMed.
- Y. Yuan, J. Wang, S. Adimi, H. Shen, T. Thomas, R. Ma, J. P. Attfield and M. Yang, Nat. Mater., 2020, 19, 282–286 CrossRef CAS PubMed.
- R. Chattot, O. Le Bacq, V. Beermann, S. Kühl, J. Herranz, S. Henning, L. Kühn, T. Asset, L. Guétaz, G. Renou, J. Drnec, P. Bordet, A. Pasturel, A. Eychmüller, T. J. Schmidt, P. Strasser, L. Dubau and F. Maillard, Nat. Mater., 2018, 17, 827–833 CrossRef CAS PubMed.
- T. Ioroi, T. Nagai, Z. Siroma and K. Yasuda, Int. J. Hydrogen Energy, 2022, 47, 38506–38516 CrossRef CAS.
- A. Hartig-Weiss, M. F. Tovini, H. A. Gasteiger and H. A. El-Sayed, ACS Appl. Energy Mater., 2020, 3, 10323–10327 CrossRef CAS.
- K. Ishikawa, J. Ohyama, K. Okubo, K. Murata and A. Satsuma, ACS Appl. Mater. Interfaces, 2020, 12, 22771–22777 CrossRef CAS PubMed.
- J. Durst, A. Siebel, C. Simon, F. Hasché, J. Herranz and H. A. Gasteiger, Energy Environ. Sci., 2014, 7, 2255–2260 RSC.
- Y. Li, H. S. Pillai, T. Wang, S. Hwang, Y. Zhao, Z. Qiao, Q. Mu, S. Karakalos, M. Chen, J. Yang, D. Su, H. Xin, Y. Yan and G. Wu, Energy Environ. Sci., 2021, 14, 1449–1460 RSC.
- V. Vedharathinam and G. G. Botte, Electrochim. Acta, 2012, 81, 292–300 CrossRef CAS.
- A. Velázquez-Palenzuela, F. Centellas, J. A. Garrido, C. Arias, R. M. Rodríguez, E. Brillas and P. -L. Cabot, J. Power Sources, 2011, 196, 3503–3512 CrossRef.
- M. H. Seo, S. M. Choi, J. K. Seo, S. H. Noh, W. B. Kim and B. Han, Appl. Catal., B, 2013, 129, 163–171 CrossRef CAS.
- O. A. Baturina, Q. Lu, M. A. Padilla, L. Xin, W. Li, A. Serov, K. Artyushkova, P. Atanassov, F. Xu, A. Epshteyn, T. Brintlinger, M. Schuette and G. E. Collins, ACS Catal., 2014, 4, 3682–3695 CrossRef CAS.
- A. Kaliyaraj Selva Kumar, Y. Zhang, D. Li and R. G. Compton, Electrochem. Commun., 2020, 121, 106867 CrossRef CAS.
- Y. Garsany, I. L. Singer and K. E. Swider-Lyons, J. Electroanal. Chem., 2011, 662, 396–406 CrossRef CAS.
- M. Inaba, Y. Kamitaka and K. Kodama, J. Electroanal. Chem., 2021, 886, 115115 CrossRef CAS.
- K. Shinozaki, J. W. Zack, S. Pylypenko, B. S. Pivovar and S. S. Kocha, J. Electrochem. Soc., 2015, 162, F1384–F1396 CrossRef CAS.
- Y. Zhang, J. Li, Q. Peng, P. Yang, Q. Fu, X. Zhu and Q. Liao, Electrochim. Acta, 2022, 429, 140953 CrossRef CAS.
- Y. Garsany, O. A. Baturina, K. E. Swider-Lyons and S. S. Kocha, Anal. Chem., 2010, 82, 6321–6328 CrossRef CAS PubMed.
- A. D. Sendek, Q. Yang, E. D. Cubuk, K.-A. N. Duerloo, Y. Cui and E. J. Reed, Energy Environ. Sci., 2017, 10, 306–320 RSC.
- C. Ling, npj Comput. Mater., 2022, 8, 33 CrossRef.
- Y. Zhang and C. Ling, npj Comput. Mater., 2018, 4, 25 CrossRef.
- L. Huang and C. Ling, J. Appl. Phys., 2020, 128, 124901 CrossRef CAS.
- L. Huang and C. Ling, J. Chem. Inf. Model., 2021, 61, 4200–4209 CrossRef CAS PubMed.
| This journal is © The Royal Society of Chemistry 2024 |

