
 Open Access Article
 This Open Access Article is licensed under a Creative Commons Attribution-Non Commercial 3.0 Unported Licence
Machine learning for analyzing atomic force microscopy (AFM) images generated from polymer blends†
Aanish
Paruchuri
a,
Yunfei
Wang
 b,
Xiaodan
Gu
b and
Arthi
Jayaraman
*cde
b,
Xiaodan
Gu
b and
Arthi
Jayaraman
*cde
aMaster of Science in Data Science Program, University of Delaware, Newark, DE 19713, USA
bSchool of Polymer Science and Engineering, University of Southern Mississippi, 118 College Drive, #5050, Hattiesburg, MS 39406, USA
cDepartment of Chemical and Biomolecular Engineering, University of Delaware, 150 Academy St, Newark, DE 19713, USA. E-mail: arthij@udel.edu
dDepartment of Materials Science and Engineering, University of Delaware, Newark, DE 19713, USA
eData Science Institute, University of Delaware, Newark, DE 19713, USA
First published on 21st October 2024
Abstract
In this paper, we present a new machine learning (ML) workflow with unsupervised learning techniques to identify domains within atomic force microscopy (AFM) images obtained from polymer films. The goal of the workflow is to (i) identify the spatial location of two types of polymer domains with little to no manual intervention (Task 1) and (ii) calculate the domain size distributions, which in turn can help qualify the phase separated state of the material as macrophase or microphase ordered/disordered domains (Task 2). We briefly review existing approaches used in other fields – computer vision and signal processing – that can be applicable to the above tasks frequently encountered in the field of polymer science and engineering. We then test these approaches from computer vision and signal processing on the AFM image dataset to identify the strengths and limitations of each of these approaches for our first task. For our first domain segmentation task, we found that the workflow using discrete Fourier transform (DFT) or discrete cosine transform (DCT) with variance statistics as the feature works the best. The popular ResNet50 deep learning approach from the computer vision field exhibited relatively poorer performance in the domain segmentation task for our AFM images as compared to the DFT and DCT based workflows. For the second task, for each of the 144 input AFM images, we then used an existing Porespy Python package to calculate the domain size distribution from the output of that image from the DFT-based workflow. The information and open-source codes we share in this paper can serve as a guide for researchers in the fields of polymers and soft materials who need ML modeling and workflows for automated analyses of AFM images from polymer samples that may have crystalline/amorphous domains, sharp/rough interfaces between domains, or micro- or macro-phase separated domains.
1. Introduction
Researchers working with macromolecular materials (e.g., block copolymers,1–6 polymer blends,7,8 and polymer nanocomposites9–21) rely on various characterization techniques to understand the multiscale structural arrangements these soft materials exhibit for various designs (polymer chemistry, architecture, and molecular mass) and processing conditions (thermal annealing temperature, processing techniques, and solvents). Unlike crystalline inorganic materials or precisely structured proteins, most synthetic polymers and soft materials exhibit a rich diversity of ordered and disordered structure(s) at various length scales, and in many cases with dispersity in the structural dimensions. The hierarchy and the distribution of structural dimensions together dictate the performance and effectiveness of the material in its eventual application or function. To gain an understanding of the structural hierarchy, polymer researchers often turn towards one or more microscopy techniques such as scanning electron microscopy (SEM), transmission electron microscopy (TEM), scanning transmission electron microscopy (STEM), cryo-TEM, and atomic force microscopy (AFM), together with other scattering and spectroscopy tools. The types of data obtained from these microscopy techniques are typically two-dimensional (2D) images that convey the intended physical information about the structure of the sample being probed (e.g., chemical differences between various regions or domains, shapes and sizes of various domains, orientation of microdomains, softness/hardness of the regions, and physical roughness in the form of height maps). Traditionally, these images from microscopy measurements are manually interpreted, aided by, in most cases, proprietary software packages that are linked to the microscopy instrument. Such manual analyses and interpretations are subject to human biases, errors, and subjectivity; one can expect the errors and biases to grow with increasing sizes of the datasets and less time spent on analyzing each image. With the recent shift towards high-throughput experimentation and characterization and open science, there is a critical need to shift away from manual interpretation of the images or manual intervention during computational interpretation with proprietary software. Instead, there is a strong justification to move towards fast and objective automated open-source computational and machine learning (ML) workflows. Despite the many successes of ML workflows for structural characterization in inorganic and small-molecule organic materials fields,22–36 the analogous development and use of ML approaches customized for polymers and soft materials37–39 are still relatively less prevalent. In this paper, we present one such new ML-based workflow for objective interpretation of AFM images from polymer films, with minimal manual intervention.For readers less familiar with AFM techniques, we briefly describe AFM techniques' application in the context of soft materials and polymers. AFM is used to map the surface topography as well as the mechanical response (phase image) of soft materials by measuring the spatial variations in interactions between the instrument tip and the surface (see perspective article, ref. 40). AFM is an effective tool for detecting the nanometer-scale 2D morphology of self-assembled polymers, which is essential for designing materials for specific applications such as high-resolution etch masks, microelectronics, optics, and solar cells (see for example papers on the self-assembly of block copolymers in previous reviews41,42). AFM is also utilized to measure the thickness and roughness of polymer materials by constructing three-dimensional (3D) mappings.43,44 However, the complexity of surface morphologies—such as diversity of morphologies, dispersity of length scales in polymer phase separation, presence of defects, and noise from the instrument—makes manual analysis of AFM images challenging, subjective, and sometimes inaccurate. Consequently, there is a critical need for ML workflows that can automate the analysis of AFM characterization of polymer films.
In general, ML workflows for polymers/soft materials' characterization results can be classified as being ‘predictive’ or ‘generative’ in nature. While ‘predictive’ ML models project material properties or classify materials based on their structural characterization, ‘generative’ ML models create synthetic forms of the characterization data; both of these enable downstream discovery of new materials with desired properties. There are many noteworthy studies showing predictive ML models used on AFM images for detecting or classifying features of interest,45–48 detecting defects,49 classifying structural information,50 and understanding morphology.51 There are also studies showing use of generative ML models for increasing resolution52,53 and denoising of AFM data.54 Generative models have also been used to convert one form of experimental characterization to another form55–57 to address limited/disparate access to instrumentation resources and differences in the interpretability of the two forms of characterization. Despite the promising solutions enabled by ML models, one major challenge that exists in the training of ML models is the need for manual labeling for supervised ML models. Supervised ML models leverage (manually) labeled data to learn patterns and relationships in the dataset. Manual labeling of experimental data for training the ML model is a time-consuming process and not always objective or error-free. To overcome the need for manual labeling, researchers have developed self-supervised learning techniques (e.g., see ref. 58 for how self-supervised learning can be used in microscopy image analysis). Self-supervised learning techniques use unlabeled data to learn the pretext of the task without requiring extensive manually labeled data; however, this process requires extensive data ranging from thousands to millions of data points depending on the task and some steps in training still require manual input. In contrast to supervised and self-supervised ML models, in unsupervised ML approaches,59,60 the model learns the patterns in the data by identifying relationships and organizing data into meaningful groups without requiring labeled data. The main challenge one would face with unsupervised learning is formulating the problem in an efficient manner that would enable unsupervised ML algorithms to effectively uncover hidden patterns and structures within the data. Unlike supervised learning, where the task is clearly defined by labeled examples, unsupervised ML often requires careful engineering of how to represent the data.
Another challenge for training ML models for microscopy image analysis in the field of polymer science and engineering is insufficient experimental data for training the model. In many cases, it is not viable to have large experimental datasets due to limited availability and access to the instrument or insufficient time or limited material availability for sample preparation for the measurement. In such situations, one way to generate additional relevant data for training the ML models is through the use of synthetic (i.e., simulated) data that have features like typical experimental measurement data (see for example ref. 57 where such simulated data were used to train an ML model). One can also use an augmented data set combining simulated and experimentally measured data to train ML models. We note a particular benefit of most unsupervised ML methods that the dataset size is less of a constraint as compared to supervised ML models, making unsupervised ML models more suitable for our task at hand.
In this paper, we develop an ML workflow with unsupervised learning techniques to identify domains within this AFM image dataset obtained from films of supramolecular block copolymers. As supramolecular block polymers are formed from the association of two types of homopolymers, we expect to see morphologies varying from large macro-phase separated (large) domains to ordered/disordered bicontinuous microphase separated (smaller) domains (Fig. 1). Through the developed ML workflow with unsupervised learning techniques, we successfully identify the light and dark polymer domains in the input AFM images and then quantify domain size distributions with little to no manual intervention. Fig. 2 describes the entire workflow.
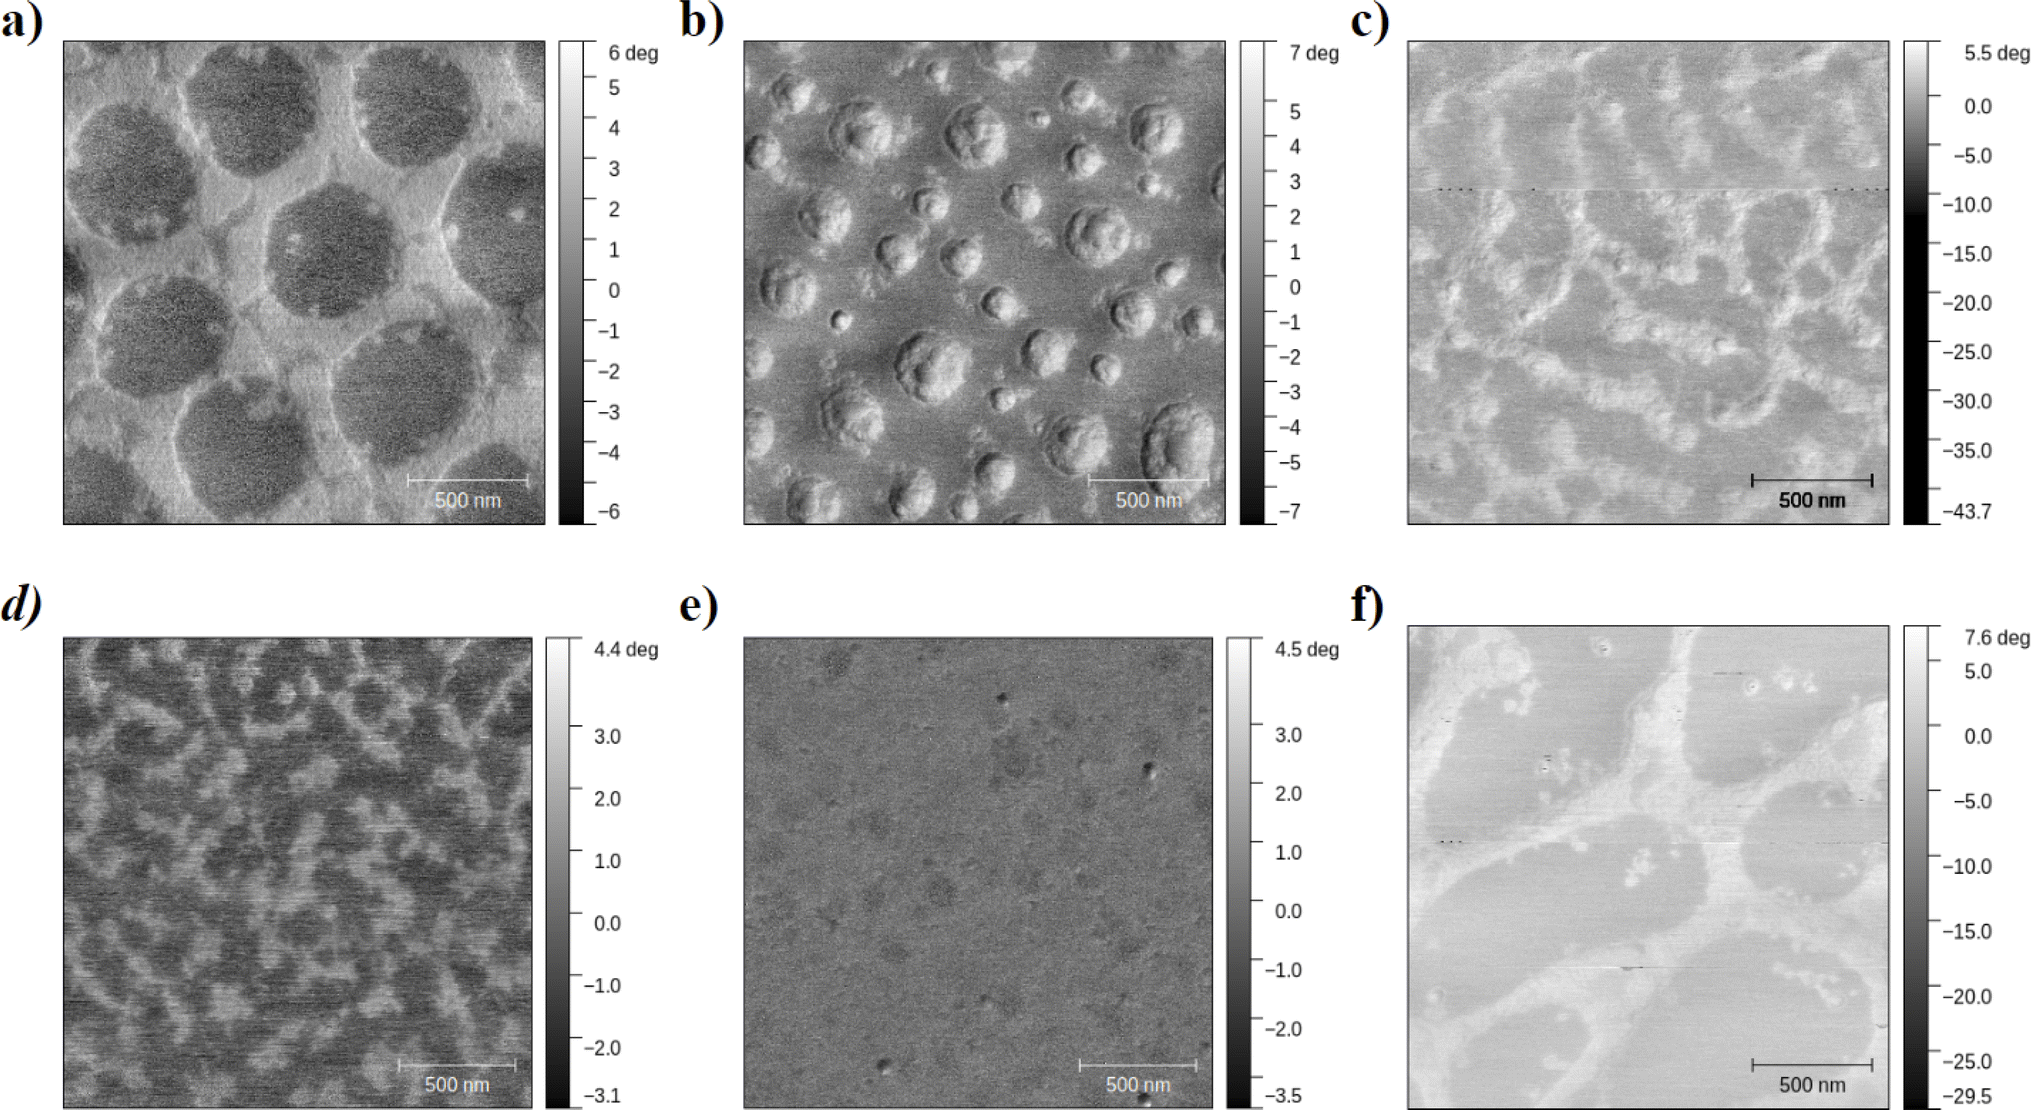 | ||
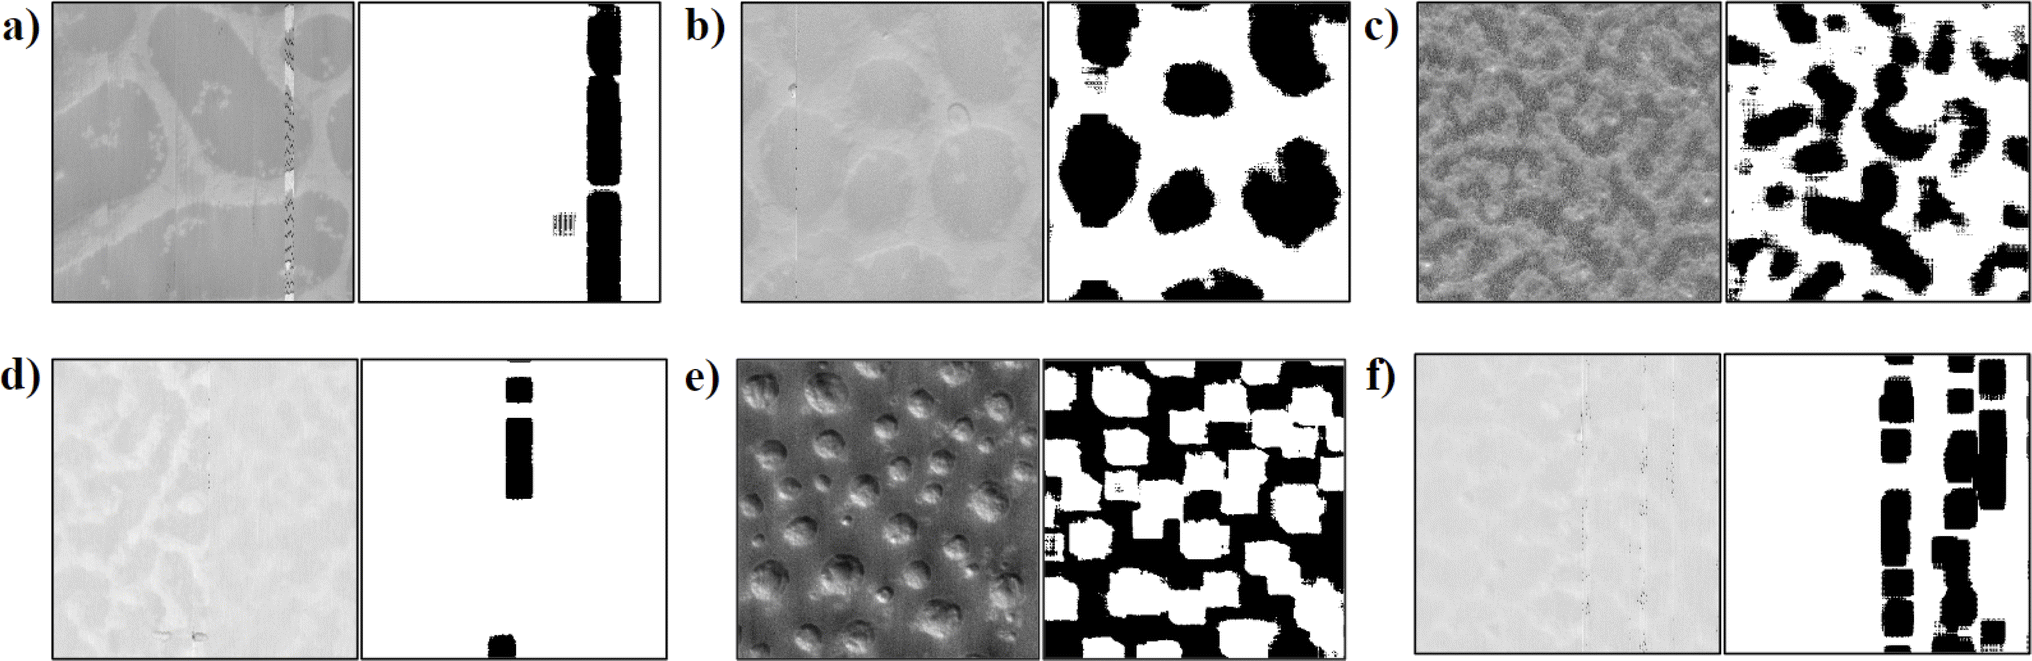
| Fig. 1 (a–f) Examples of AFM phase images from the dataset of thin films of POEGMA-sb-PS spin-cast onto silicon wafers. Details of the sample preparation and AFM imaging are presented in Section 3. | ||
 | ||
| Fig. 2 Workflow for analyzing AFM images. We first denoise the raw AFM phase image, apply machine learning techniques to denoised AFM phase images (part (a) is an example of a phase retrace denoised image and phase retrace raw image) and identify the positions of light and dark domains. The output is then two binary images, one for dark domains (top of part (b)) and one for light domains (bottom of part (b)). After the domains are identified, we use existing computational methods for domain size quantification to calculate the domain size distribution for light and dark domains (part (c)). | ||
Prior to showing the reader our developed workflow for identifying domains and quantifying the domain sizes, we first review (briefly) existing approaches in other fields – computer vision and signal processing – that are applicable to our task that researchers in the polymer field frequently need to do during material characterization. We test many of these computer vision and signal processing approaches for our intended AFM image analysis tasks and identify the strengths and limitations of each of these approaches for various AFM image analysis tasks for polymer samples. Even though we demonstrate the workflow only on the AFM images from polymer films composed of blends of two associating homopolymers, we believe that the information and open-source code we present in this paper should serve as a guide to polymer researchers who need ML modeling for analyses of AFM images from other polymer samples that may have crystalline/amorphous domains, sharp/rough interfaces between domains, or micro- or macro-phase separated domains, as long as there is height or phase contrast.
2. Computational methods for AFM image analyses
AFM images consist of a grid of data points that represent the height or phase value obtained by the probe tip as it scans across the sample surface. This grid of data points in AFM images is similar to a grid of pixels in any everyday photo/image we capture, where each pixel in the image holds the light intensity values of the object or scene that is photographed. Essentially both the grids represent visually perceivable features and characteristics of the scanned surface or scene. Consequently, techniques used for image segmentation (defined as outlining object boundaries) and feature extraction in RGB (red, green, and blue) and grayscale images45,46,50,52 can be extended to AFM images. These techniques can elucidate surface texture, which in turn could be used to distinguish materials' composition and structural arrangement at certain length scales. Texture refers to the visual patterns and structures (i.e., roughness, smoothness, and regularity in patterns). Texture analysis tasks involve quantifying patterns and extracting features to identify regions in an image. Various computational methods have been developed for texture analysis, including statistics-based,61,62 transform-based,63–65 and more recently convolutional neural networks (CNNs).66,67 We understand some of these methods' strengths and limitations before we test their applicability to our specific task of AFM image analysis for polymer films' domain sizes and shapes (Fig. 1 and 2).The first category of methods includes wavelet,68 Fourier,69 and Radon70 transforms, which the field of signal processing relies on heavily. Typically, transforms are applied to convert the information from the input domain to a more favorable domain for easier analysis. The relevance of transforms to analysis of microscopy images arises from considering images from any microscopy measurement as a two-dimensional signal that can then be transformed into other easier-to-analyze forms. We describe the strengths and limitations of discrete Fourier transform, discrete cosine transform, two variants of discrete wavelet transform, and Radon transform in Section 2.1.
The second category of models and methods for automated image analysis comes from the field of computer vision. For automated image analysis, various ML models have been used to successfully identify and understand objects and people in stationary images and movies/videos.71 For example, deep neural networks (DNNs) including U-net,67 FastFCN72 and Deeplab73 are used for segmentation tasks in images. These models perform well on everyday images (of dogs, cats, furniture, etc.), but perform poorly when applied to field-specific (e.g., materials science and biomedical diagnostics) microscopy images. As these models are not trained on field-specific data, which for our paper are polymer film AFM images, the application of such models to analyze these AFM images is not an option. One can take DNN models trained on generic everyday objects and re-train a few layers of the neural network model to learn relevant features of the field-specific images; this is called transfer learning.74 While transfer learning has been successful in many applications,75,76 in most cases of transfer learning the re-training is done in a supervised manner with manual labeling, which is subjective and time-consuming. To be able to make an ML model plug-and-play for experimentalists, it is important to keep the nature of the solution unsupervised. Before we present the details of and results from unsupervised ML approaches that perform well for our specific task of AFM image analysis for polymer films' domain sizes and shapes, we present a brief review of the deep learning and cluster analyses, both of which are relevant for our AFM image analysis tasks, in Sections 2.2 and 2.3, respectively. We also present the key parameters of these models and how to tune them to get desired analysis results.
2.1. Domain transforms
In image analysis, domain transforms play a pivotal role in facilitating the conversion of images from spatial domains (in real space) to another domain (e.g., frequency space), which offers a more powerful means of extracting meaningful information pertaining to regions of interest from images that may not be easily apparent in the original (real space) spatial domain. For instance, in real space, the AFM images contain noise emanating from the sample measurements, which is visible alongside the useful information. As a result, performing segmentation correctly in the spatial domain with thresholding techniques becomes a challenge (see examples in ESI Fig. S2†). In contrast, if we convert the image to another domain, like the spatial frequency domain, it better isolates the frequencies pertaining to noise vs. those pertaining to the actual information we wish to capture. A list of terms used in context of domain transforms are defined in Table 1.| Term | Definition |
|---|---|
| Pixel | The smallest unit of the image (single point in a grid) that holds intensity values |
| Tile | Subsection of the image on which domain transforms or DNN methods are applied to extract features |
| Win factor | A factor that controls the size of tiles. It is defined as the ratio of input image size to tile size. Values of the win factor lie in the range (0,1) where the tile size increases with an increase in the win factor |
| Texture | Visual patterns in an image |
| Feature | Characteristics of data that are used to represent the pattern or structure in images |
| Padding | A practice of adding extra layers around the image to preserve spatial dimensions |
| RGB | A digital image that represents color using red, green, and blue channels, where each pixel holds the values of these three channels |
| Wavelet | A mathematical function used to decompose data into their frequency components |
| Natural image | A photograph or digital image that captures objects from the real world (e.g. cars, furniture, animals, etc.) |
| Domain transform | Operations that convert data from one representation to another |
| K-means | Unsupervised ML method that clusters data based on similarity |
| Index map | 2D matrix that signifies the spatial position of domains |
| Domains | Space or representation of data in which it is analyzed (e.g. time, frequency, spatial, etc.). For the task at hand, images are mainly transformed into their spatial frequencies |
| Spatial domain | Representation of data where values are organized based on their spatial position |
| Segmentation | A task of partitioning data in groups of distinct regions |
To effectively utilize domain transforms for the task at hand, we define a workflow, which is a sequence of operations executed on input AFM images to identify different domains in it. The workflow takes an AFM image as input and gives out two binary images each, which signify the location of light and dark domains, as illustrated in Fig. 2. The operations in this workflow include preprocessing, tiling, domain transform, post-processing, and clustering, described briefly next.
For preprocessing, we perform denoising and image normalization. Denoising techniques help reduce noise inherent in the AFM data and normalization is performed to scale the phase values which are obtained in degrees from the AFM experiment to quantize them into a fixed range comparable to natural images (0–255 intensity scale). See examples of images obtained before pre-processing and after denoising in ESI Section S.I.† Next, for the tiling stage, we define a region surrounding each pixel in the AFM image as a tile. A tile serves as a localized subset of the image, encompassing a neighborhood of pixels centered around each pixel. The advantages to analyzing tiles of each pixel in an AFM image are that they represent the spatial relationships and patterns within neighboring pixels, which allows for the tile to be robust to noise and effective in representing the variability in individual pixel values. The size of the neighborhood or the size of the tile is controlled by the win factor. The tile size is the win-factor multiplied by the AFM image size; the tile size is a critical parameter as it directly influences the granularity of analysis and the level of detail captured within each tile. For more details about how to choose a tile size, we direct the reader to ESI Section S.II.† Due to the nature of tiles, it is not possible to formulate tiles for pixels in the boundary region, as there may be no neighboring pixels in a tile. To prevent the loss of resolution, a common technique used in CNNs is padding. In padding, boundary pixels can be added to the AFM image to prevent the loss of resolution; however, doing so would introduce inconsistencies in texture. Therefore, we exclude boundary pixels from analysis in our workflow.
After generating tiles, domain transforms are applied to the pixel tiles within the AFM image. Each domain transform operates uniquely, resulting in varying output structures and each output structure has a unique meaning of what it represents. Therefore, the feature extraction from the transforms is specific to the transform used. The feature extraction is, in general, guided by how to compress and quantify the information from the domain transform output. Such compression is required because the transforms mostly output large two-dimensional (2D) matrices, which are computationally intensive to work with. Statistical metrics, like max, mean, variance, skew, and kurtosis of transform outputs, provide a compact representation of texture and are representable as low dimensional vectors, which are computationally easier to work with. In short, the mean, variance, skew, and kurtosis of the transformed tile are used to represent the textural information of the pixel's tile. Collating each of the pixel's statistics would result in a three-dimensional (3D) grid of vectors, replacing the phase value with the calculated transform's statistics vector in the AFM image. We call such 3D grids as a “feature cube” (inspired by the 3D grid shape). After formulating the feature cube, we proceed with post-processing. Since the generated feature cube contains values spanning various ranges and scales of the statistical metrics, normalization becomes crucial to standardize the analysis, particularly for subsequent clustering processes. The workflow until creating the (normalized) final feature cube is illustrated in Fig. 3.
 | ||
| Fig. 3 Domain transform workflow. (a) The preprocessed AFM phase image is broken down into (b) tiles, on which domain transforms are applied. The domain transforms yield transformed representations of the tile, which are easier for feature extraction. Statistical parameters, like mean, variance, skew, and kurtosis, are used to reduce dimensionality and quantify textural features. These statistics are collated into (c) a feature cube, which undergoes normalization in post-processing yielding (d) a post-processed feature cube. | ||
Next, we will discuss the viability of the use of different domain transforms – discrete Fourier, discrete cosine, discrete wavelet, and Radon transforms – for our task of identifying phase separated polymer domains in AFM images taken from supramolecular block copolymer films.
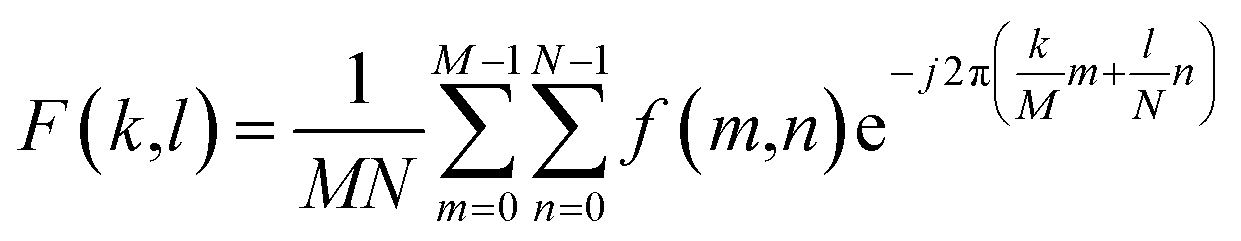 | (1) |
The 2D DFT yields a complex 2D matrix, where the real part holds amplitude information and the complex part holds the phase information. Recent work64 has shown that amplitude information from the transform contains high potential to capture texture. This is because image texture is often characterized by repetitive patterns, which correspond to specific frequency components in the Fourier domain and these components are visible in the amplitude matrix. Therefore, applying statistics (mean, variance, skew, and kurtosis) helps us quantify the texture and provides a low dimensional representation, which makes it easy for computing similarity or other desired metrics.
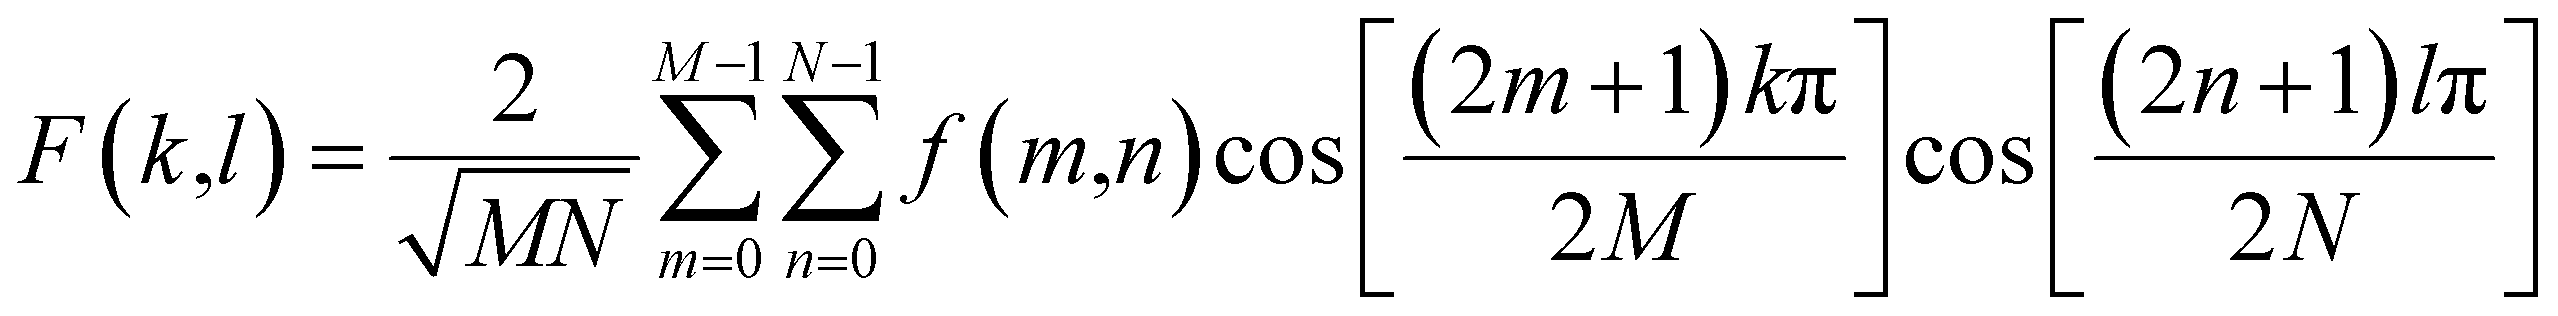 | (2) |
Both DCT and DFT work on the frequency domain and have similar characteristics of decomposition as explained above. Therefore, one could anticipate that the information on texture extracted from the two transforms could be similar; our results, as described later, confirm that this is the case.
 | ||
| Fig. 4 Haar wavelet transform applied to the pre-processed AFM phase image shown in part (a). With one level of decomposition, we obtain the (lo_1) low frequency coefficient, (hi_vr_1) vertical high frequency, (hi_hr_1) horizontal high frequency, and (hi_di_1) diagonal high frequency coefficient, which are collated into one image in part (b). With decomposition level two, the (lo_1) previous low frequency coefficient from part (b) is decomposed further into 4 further sub-images and all of them are collated in a similar fashion to part (b), yielding the (lo_2) low frequency coefficient, (hi_vr_2) vertical high frequency, (hi_hr_2) horizontal high frequency, and (hi_di_2) diagonal high frequency coefficient, which are grouped into the image shown in part (c). Note that the low frequency coefficients in (c) hold minimal details and are approaching a stale state. | ||
Performing one level of decomposition on an image (Fig. 4a) with DWT yields 4 sub-images, namely low frequency coefficient, vertical high frequency, horizontal high frequency, and diagonal high frequency (Fig. 4b). The size of these sub-images is half that of the input image, because of which they could be collated as depicted in Fig. 4b.
We note that multiple levels of decomposition could be performed where the low frequency image is further decomposed iteratively with DWT (Fig. 4c). The number of iterations in the decomposition process is referred to as the level of decomposition. The level of decomposition starts from 1 and goes to a value where the low frequency coefficients become stale. For the task at hand, a level of decomposition greater than 3 leads to stale low frequency coefficients. Unlike DFT and DCT, wavelets have complicated outputs with subsections in the matrix depicting various frequency coefficients. Therefore, it would be counterproductive to apply statistics to the entire output image. Instead, it is more advantageous to apply statistics to individual subsections of the output. By doing so, the mean, variance, skew and kurtosis quantify and capture the frequency patterns, which depict the properties of image texture with higher efficiency.
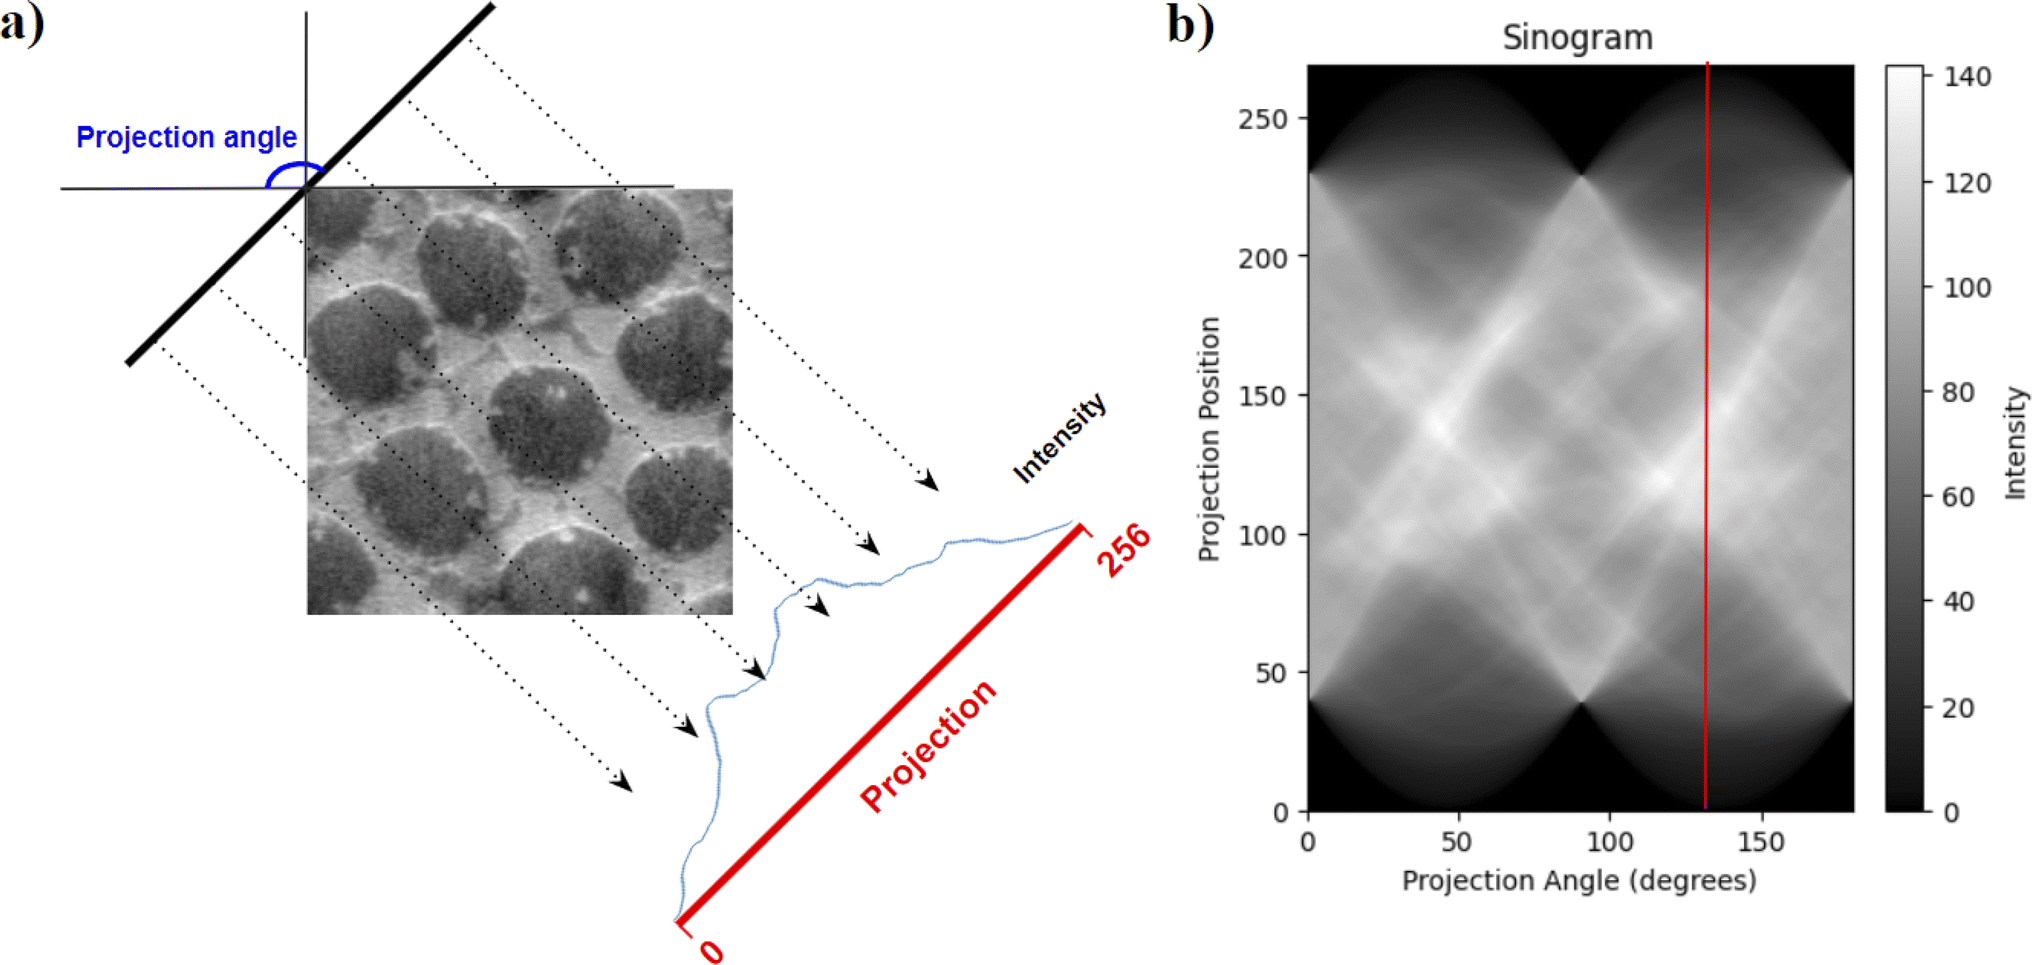 | ||
| Fig. 5 Radon transform and visualization of the sinogram. The transform takes in the pre-processed AFM phase image (a) and calculates the integral of intensity values in the image along (dotted arrows) rays emanating from a projection angle with the AFM image. The projection angle varies from 0° to 180° and the integral of the rays is captured and stacked horizontally to form an image called the sinogram (b). | ||
The sinogram, due to its integral information of intensities at various angles, tends to capture orientation and directional features from an image, which could be quantified with the help of statistics mean, variance, skew, and kurtosis to extract textural features like directionality and regularity. Statistics also give a low dimensional representation of the sinogram, making it easy for similarity calculations in clustering algorithms.
2.2. Deep learning (DL) ResNet50
Convolutional Neural Networks (CNNs) represent a deep learning method that is widely regarded as one of the most advanced approaches for image texture analysis and prediction. CNNs have multiple convolutional layers that are designed to learn and extract features from images. These layers contain multiple learnable filters which, when convoluted over the input, detect features like patterns, edges, and corners, aggregating this information into a feature map. The learnable filters in CNN must be optimized to detect texture. This is done by training the model over millions of images with labels, where it tries to correctly predict the image. CNN model training is supervised and a time and effort intensive process requiring large amounts of labeled data, which often are not available in the soft material characterization data. Therefore, if one wants to avoid training CNN models from scratch themselves, they could use a pre-trained network that is trained on some task-specific image data or general image dataset and see how applicable that model is for their own task. One such pre-trained CNN is ResNet50, which was trained on a large dataset of images called ImageNet86 consisting of 14 million images of various day to day objects; ResNet50 was trained to classify images with these objects. Recent work has shown that one could utilize various convolutional layers from models trained on ImageNet data to extract features from images.66 Therefore, we could leverage ResNet50's ability to extract textural features from images (tiles in our workflow) and substitute domain transform with the ResNet50 model in the workflow. The resulting workflow is illustrated in Fig. 6 and terminology used in the context of deep learning is defined in Table 2.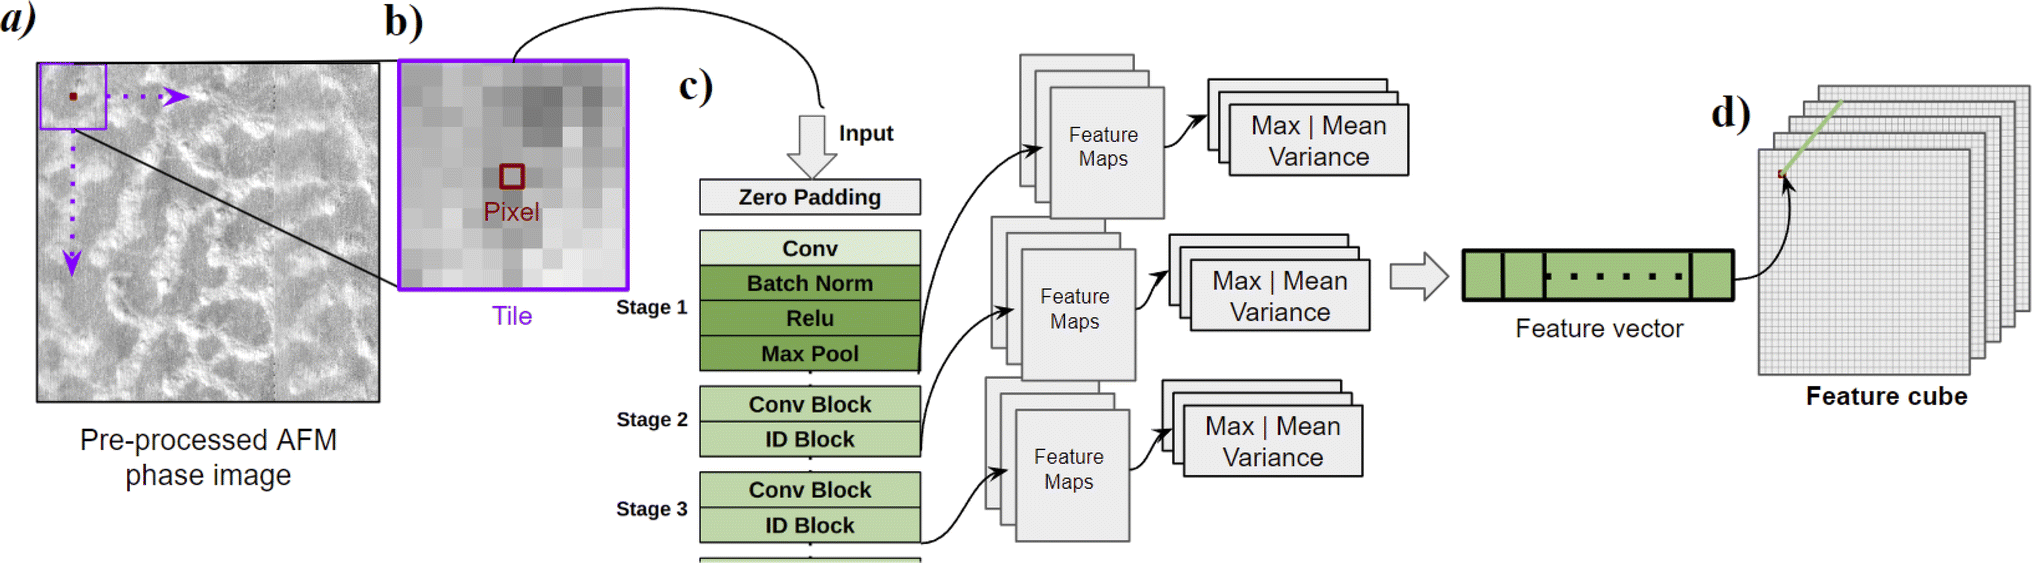 | ||
| Fig. 6 Schematic representation of the ResNet50 workflow for domain segmentation till feature cube generation. (a) The pre-processed AFM phase image is divided into (b) tiles. The tiles are fed into (c) the ResNet50 model, which in turn generates feature maps. Statistical parameters – mean, max, and variance – are used to reduce the dimensions of the feature maps and these statistics are horizontally stacked in a feature vector. Repeating this process for all the tiles and stacking the feature vectors in spatial order result in (d) a feature cube. | ||
| Term | Definition |
|---|---|
| Feature extraction | Process of transforming data into a set of more meaningful information or features |
| Convolution | Mathematical operation used to either extract features or filter images |
| Filter | Mathematical operation used on images to suppress or enhance desirable components |
| Classification | Task of categorizing input data |
| Index map | 2D matrix with indices (0 or 1) which signify the presence of a domain (light or dark) |
| Transfer learning | ML technique where knowledge gained from a training task is fine tuned to solve another task |
| Unsupervised learning | Category of ML algorithms that extract patterns in data without the need for manual supervision |
| Deep learning (DL) | A branch of ML where models contain multiple layers (deep) of neural networks |
| Feature maps | Groups of 2D matrices obtained from the output of ResNet50 network stages |
| ResNet50 | A pretrained DL model used for feature extraction |
ResNet50 consists of multiple sets of convolutional layers where the level of understanding of features keeps reducing as we go deeper into the network. For the task at hand, we work with the output of the first 3 sets of convolutional layers to extract feature maps. The feature maps extracted have different sizes and represent textural information. Statistical parameters – mean, max, and variance – are calculated from the feature maps and are used to represent feature maps. Effectively this converts the feature map which is a 2D matrix to a vector of length 3. Grouping these vectors for each feature map gives us a feature vector which is collated to form the feature cube. Unlike in domain transform workflows, the feature cube is not normalized because CNNs inherently work on normalized data; as a result, the scale of values in the feature cube remains constant. It is important to note that despite the effectiveness of ResNet50, it still has limitations, one of which is the minimum input size that is restricted to 32 × 32 pixels; this restricts the granularity of analysis and the ability of the network to capture small scale features.
2.3. Clustering
From the domain transforms and deep learning workflow, we typically obtain a three-dimensional feature cube. The first and second dimensions of the feature cube denote the spatial position on the raw image, while the third dimension contains the feature vector representing the textural information of the neighborhood surrounding that spatial coordinate (tile) indicated by the first two dimensions.An approach commonly used to classify regions from the feature vector involves training a supervised ML model.45,46,66 However, supervised ML models need manual labeling of data for training the ML model. Furthermore, it makes them data specific models, limiting the generalizability of the solution to other AFM images and workflows. To overcome this challenge, we chose an unsupervised approach to quantify the similarity of feature vectors within a feature cube and group them together using a process commonly known as clustering. Clustering, being an unsupervised ML technique, requires no labeled data or training. While numerous clustering techniques exist, each of their performance is data specific. A common and widely used clustering technique is k-means clustering.87 K-means clustering works by partitioning all the feature vectors into clusters by iteratively assigning each feature vector to the nearest center of a cluster and updating the center of the clusters based on the mean of the feature vector assigned. The Euclidean distance is calculated between feature vectors to assess the distance between feature vectors in this process. Upon completion of the clustering process, ideally the feature vectors in each cluster would have similar textures. The number of clusters in k-means is a hyper-parameter, and for the task at hand, it was observed that two clusters best represent the light and dark domains for the pairs of described domain transforms and statistics from Sections 2.1 and 2.2. One may also note that based on the nature of the problem and transforms, multiple clusters may be observed to represent a single texture; in this case, the multiple indices must group as one. By replacing the feature vectors in the feature cube by indices, which signify light or dark domains, we have a binary 2D matrix (index map) signifying the position of the domains on the raw image (Fig. 7). This 2D matrix (index map) is then used to calculate the domain size distribution (Fig. 8).
 | ||
| Fig. 7 Schematics of clustering. Domain transforms or deep learning workflows operate on (a) pre-processed AFM phase images to generate (b) the post-processed feature cube. Subsequently, the K-means clustering algorithm is applied to the post-processed feature cube to predict two distinct clusters. The resulting output from clustering is (c) a 2D image, wherein each point is the index of a domain. | ||
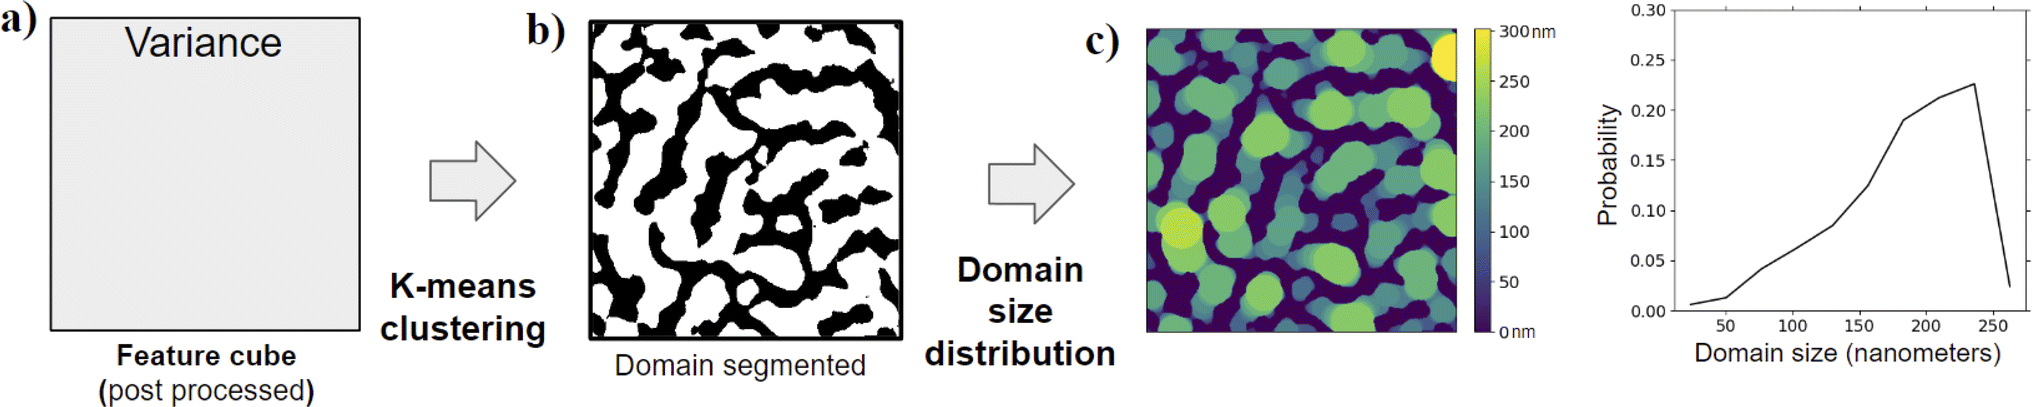 | ||
| Fig. 8 K-means clustering is applied to (a) the feature cube resulting from DFT (the best transform for the specific goal of this paper) and variance statistics (as shown in Fig. 3). This results in (b) an index map that represents the spatial position of domains within the image. We then use preexisting algorithms for domain size distribution88 on the (b) index map for light domains to generate (c) a heat map that depicts the radius of the largest circle that could overlap that pixel. Also, in the heat map, the pixels of the dark domain are zero when calculating on the light domain. We repeat the process for the index map of the dark domain too. Using the scale bar in the metadata associated with the AFM image, from the heat map, we calculate the domain size distribution in the appropriate distance units (nm for the AFM images we use). | ||
2.4. Metrics used for evaluating the model's performance
Performance metrics are key to quantitatively measuring the accuracy and efficacy of any workflow. The most widely used performance metrics for image segmentation problems include accuracy, the Dice coefficient, and the intersection of union (IoU).Accuracy quantifies the correctness of the index map and is defined as the fraction of the number of correct index predictions divided by the total number of indices in the index map.
The Dice similarity coefficient89 is a useful metric used to measure the spatial overlap of domains from the predicted and ground truth images. The Dice score for one domain is calculated as twice the number of pixels with a common index (of the observing domain) in both the predicted and manually segmented images, divided by the total number of predicted and manually segmented pixels containing the index of the observing domain.
The overall Dice score for the complete workflow is defined as the weighted average of Dice scores for each domain calculated as
 | (3) |
The Jaccard index or intersection of union (IoU),83 like Dice, measures the spatial overlap of domains from the predicted and ground truth images. The IoU for the entire workflow is calculated as the weighted average of IoU calculated for each domain, where the IoU of a domain is calculated as shown below:
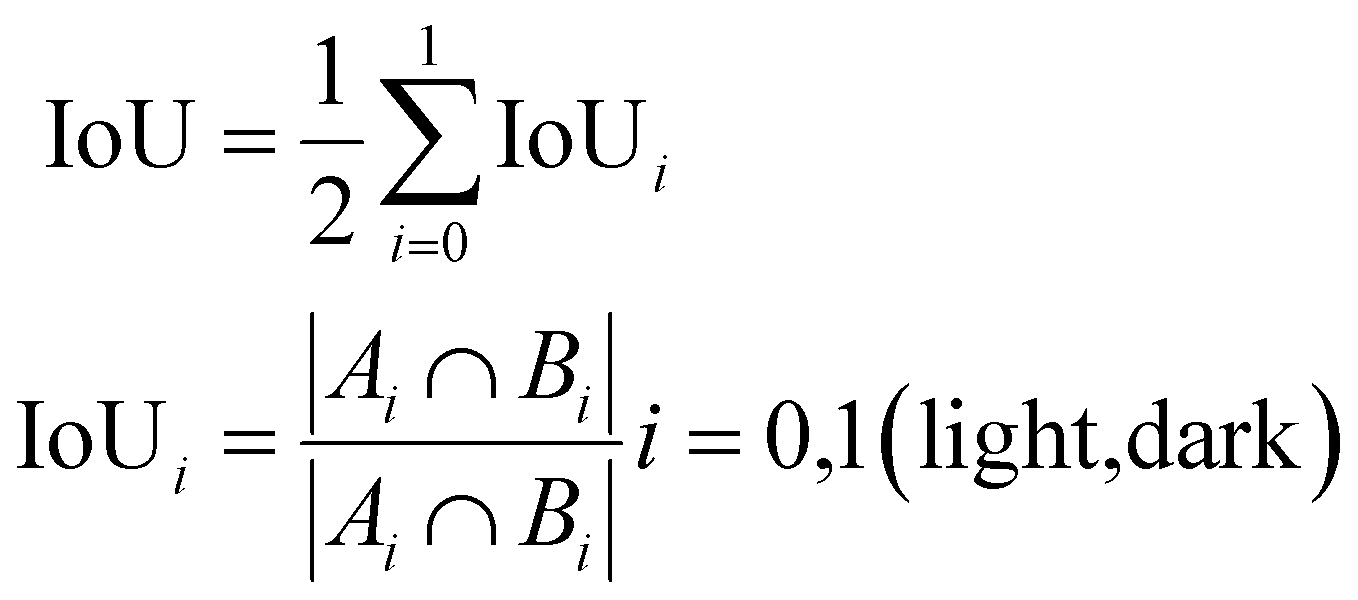 | (4) |
3. Experimentally obtained AFM image datasets
The supramolecular block copolymer poly(oligo(ethylene glycol) methyl ether methacrylate)-sb-polystyrene (POEGMA-sb-PS) was fabricated by blending two types of homopolymers: the first homopolymer is diaminotriazine (DAT) functional POEGMA (POEGMA-DAT) and the second homopolymer is thymine (Thy) functional PS (PS-Thy). As the focus of this paper is on the machine learning workflow development, we do not present any details of the synthesis of these homopolymers, which Gu and coworkers will present in a future publication focused on the synthesis of these molecules. Homopolymers POEGMA-DAT and PS-Thy in a 1![[thin space (1/6-em)]](https://www.rsc.org/images/entities/char_2009.gif) :1 molar ratio were dissolved in anhydrous toluene at room temperature to achieve a solution with a polymer concentration of 20 mg ml−1; the two homopolymers can associate to form the supramolecular block copolymer POEGMA-sb-PS. By using varying molecular weights of POEGMA-DAT and PS-Thy homopolymers, we achieved supramolecular block copolymers POEGMA-sb-PS with varying total chain lengths and block ratios.
:1 molar ratio were dissolved in anhydrous toluene at room temperature to achieve a solution with a polymer concentration of 20 mg ml−1; the two homopolymers can associate to form the supramolecular block copolymer POEGMA-sb-PS. By using varying molecular weights of POEGMA-DAT and PS-Thy homopolymers, we achieved supramolecular block copolymers POEGMA-sb-PS with varying total chain lengths and block ratios.
Finally, thin films of POEGMA-sb-PS were spin-cast onto silicon wafers at 2000 rpm for one minute for characterization. The AFM images of the films of POEGMA-sb-PS were acquired on an Asylum Jupiter AFM microscope in AC-air mode. The dataset we use for the development of the machine learning workflow has 144 AFM images in total, imaged from 16 samples of POEGMA-sb-PS obtained by using 7 K and 10 K Da PS blocks and 5 K, 8 K, 12 K, 14 K, 16 K, 20 K, 23 K and 26 K Da POEGMA blocks. Within each sample, the domains have relatively similar shapes. Across samples, the domains vary drastically in size and shape.
Each of the 144 AFM images contains distinct texture/domain patches of varying sizes and shapes, as depicted with representative images shown in Fig. 1. These images in their raw form present phase angles, which are quantized to intensity values for pixels and have dimensions of 384 pixels × 384 pixels in each image. Additionally, metadata is extracted from AFM images. The metadata contains details on measurement settings and length scales, where the latter is helpful in mapping a pixel in an AFM image to its length in real space (in nanometers). Visually the different texture patches in AFM images could be perceived as relatively light and dark regions, representing the two different domains. The AFM images in our dataset inherit noise stemming from environmental factors and experimental conditions. The prevalent types of noise observed include line, random, and scar noise.90 Utilizing prebuilt denoising algorithms tailored for AFM images enables effective noise reduction, yet some residual defects remain post-denoising (see examples in ESI Section S.I.†). We note that our workflow can accommodate and tolerate these remaining imperfections.
4. Results
We first assess the domain segmentation workflow with various transforms and ResNet to evaluate their performance in terms of accuracy, consistency, and robustness handling our AFM image data. We do not assess the effectiveness of the domain size quantification methods, as we are using existing approaches (Porespy Python package) for this step.88 In principle, the user could choose to develop their own in-house codes for any other desired domain quantification (e.g., percolation and tortuosity) after the domain segmentation task on the AFM image is complete.4.1. Assessment of various transforms and ResNet for domain segmentation
In Fig. 9, we present representative results of domain segmentation conducted with all transforms (described in Section 2.1) and ResNet50 (described in Section 2.2). Visually, the results of domain segmentation from discrete Fourier transform (DFT), discrete cosine transform (DCT), and Radon transform show the best match to the original AFM image. As described in Section 2.1, the similarity between DFT and DCT leads to their workflows having similar domain segmentation outputs. Additionally, we see similarity in the output of the Radon transform workflow and the results from DFT and DCT. However, there are minor differences in prediction between the Radon transform and DFT, which are illustrated in ESI Fig. S7.†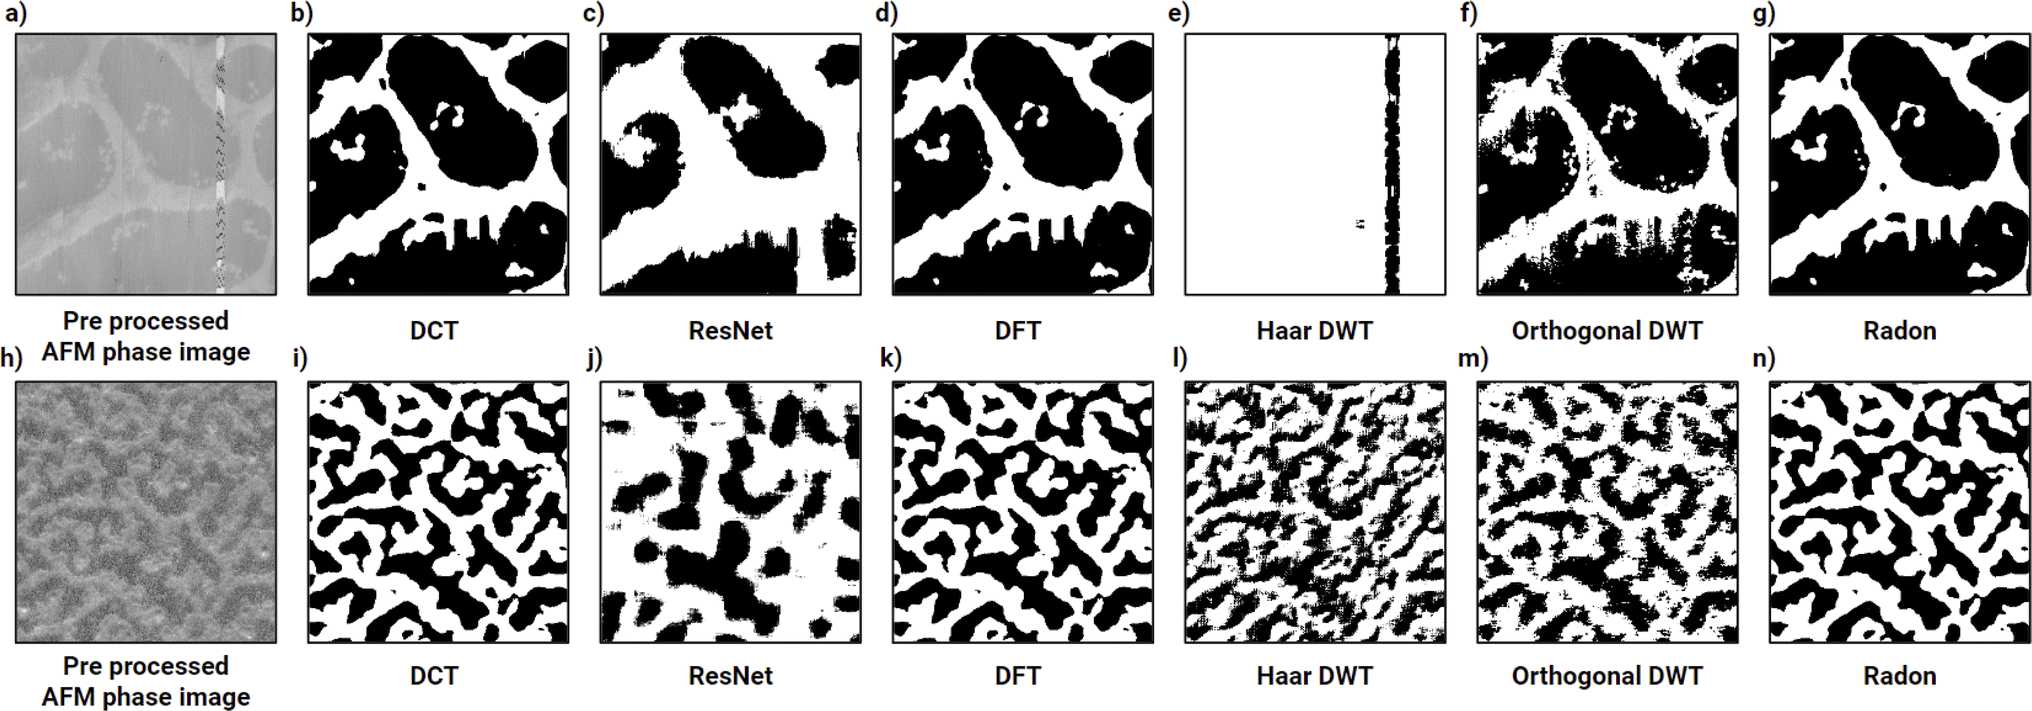 | ||
| Fig. 9 For two representative AFM images in parts (a and h), the results of domain segmentation from various transforms and ResNet50 (deep learning model) are shown in parts (b–g) and (i–n), respectively. The type of approach is denoted in the text below the images. Visually we can see that DFT, DCT, and Radon workflows perform the best by producing a binary image that is most similar in pattern to the original pre-processed AFM phase image. | ||
In the next few sub-sections, we will describe results from the DFT workflow in more detail and we direct the reader to take these discussions on the DFT workflow to be representative of DCT workflows as well. For results from DWT (Haar and bi-orthogonal wavelets), we direct the reader to ESI Section S.III.†
Before we discuss the DFT results in more detail, we briefly describe the performance of ResNet50 because such deep learning workflows are widely regarded as state of the art in image segmentation. From Fig. 9c and j, we observe that the domain segmentation using the ResNet50-based workflow does not perform as well as the DFT workflow for our AFM images. We provide additional examples of poor domain segmentation results from the ResNet50 model in Fig. 10. The overall poor performance of ResNet50 for the domain segmentation task as hand could be attributed to two factors: the choice of tile size and the need for transfer learning.
 | ||
| Fig. 10 (a–f, right) Pairs of domain segmented images, corresponding to (a–f, left) preprocessed AFM phase images when processed through the ResNet50 workflow. The results exhibit noise (a, d, and f) and the accuracy of predictions in domain segmentation is moderate (d, c, and e). | ||
The reader may recall that the tile size is controlled using the win factor, which is an important parameter that regulates the transforms or deep learning models like ResNet50 to look for textural features of a particular spatial size. We found a win factor of 0.03 to work best for our dataset (see ESI Section S.II†). This win factor yields a tile size of 12 pixels × 12 pixels, whereas ResNet50 has a fixed minimum of 32 pixels × 32 pixels. This causes the ResNet workflow segmentation resolution to be low (Fig. 10b, c and 10e) and makes the predictions prone to noise (Fig. 10a, d and 10f). Second, the poor domain segmentation with higher sensitivity to noise as compared to DFT results suggests that we need to improve the ResNet50 workflow. In ESI Section S.V,† we present additional steps that we took as we experimented with improving the ResNet50 performance. As we did not see significant improvement with ResNet50 or other domain transforms, we declared DFT and DCT workflows the best of all the approaches we tested here.
Fig. 11 shows a few more examples that demonstrate visually that the DFT workflow captures the domain segmentation for six more AFM images correctly even in the presence of noise (see the presence of a line in Fig. 11e, dots in Fig. 11f and blur in Fig. 11b and c). The DFT workflow also offers a high computational speed and low memory usage, with processing speeds of 7 images per minute benchmarked on an Intel i9-12900H CPU and 16 GB of DDR5 RAM.
 | ||
| Fig. 11 Segmentation results from the DFT workflow: in each of the six parts of this figure, we show the (a–f, left) preprocessed AFM phase images and (a–f, right) the completed domain segmentation from the DFT workflow with variance statistics. If the spatial organization of the dark or white regions in the right images corresponds to the patterns in the AFM image, then that would be a successful prediction. | ||
4.2. Analyzing the statistical features in the DFT workflow for best feature extraction
For the DFT workflow, of all the statistical features – mean, variance, skewness, kurtosis – we find that the variance is the best metric for dimensionality reduction as it distinctly represents the two domains from the feature map. Fig. 12 presents comparisons for the domain segmentation results when using the various statistical features for dimensionality reduction. For input AFM images in Fig. 12a and d, we see domain segmented images when DFT was applied using all statistical features – mean, variance, skew, and kurtosis – in Fig. 12b and e, respectively. In Fig. 12b, we see that the algorithm identifies the domain boundaries but not the domains themselves, whereas Fig. 12e tries to predict the bulk of the domain. In contrast, when DFT was applied only using the variance (Fig. 12c and f), the domain segmented images correctly captured the domains in the original AFM images.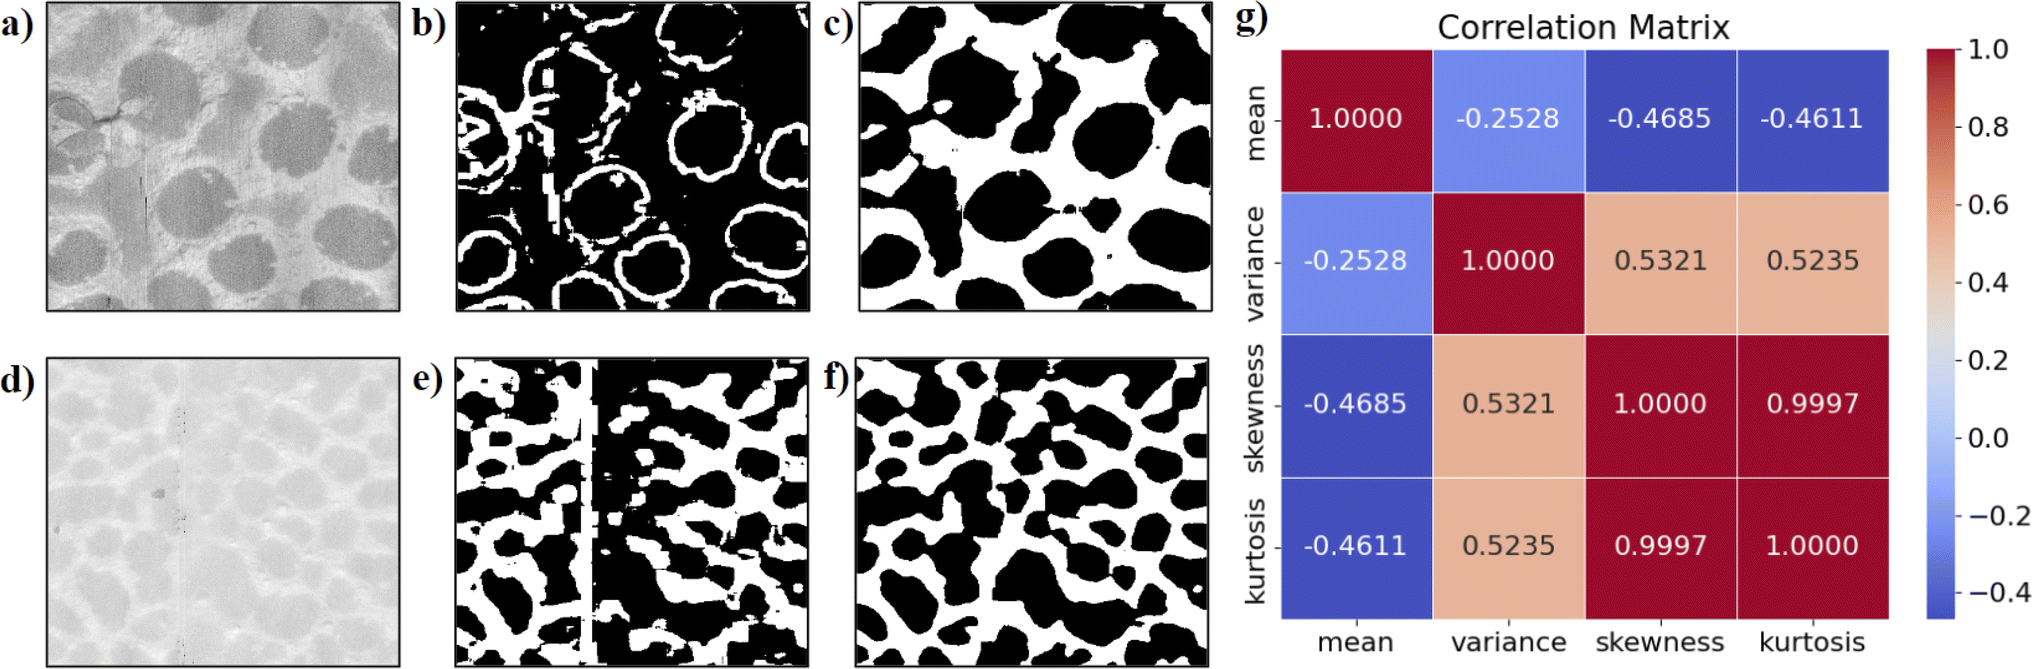 | ||
| Fig. 12 Analysis of statistics used in the DFT workflow. (a and d) Two preprocessed AFM phase images used for the DFT workflow. (b) and (e) The domain segmented images when DFT was applied using all statistical features – mean, variance, skew, and kurtosis – for images in parts (a) and (d), respectively. (c) and (f) The domain segmented images when DFT was applied using only one statistical feature variance for images in parts (a) and (d), respectively. (g) The correlation matrices of the 4 statistics that show the mean, skewness, and kurtosis are highly correlated amongst themselves in all images from the dataset, and variance is mostly independent from the rest. | ||
Upon analyzing the correlation between the statistics (Fig. 12g), we find that the kurtosis and skewness are highly correlated, and a lack of correlation of variance with any of the other three statistical features. These correlations among other features or lack thereof in the case of variance warranted us to declare variance as the best metric to uniquely identify both domains.
4.3. Quantitative analysis of the segmentation performance of the DFT workflow with variance statistics
So far, our assessment of the DFT workflow with variance statistics has been purely qualitative using our visual sense. To quantify the performance of the DFT workflow that visually looked superior to other methods, we created a test dataset selecting 15 raw AFM images from the dataset with unique textural patterns arising from different polymer systems. To analyze the performance of domain segmentation, we manually segmented the test dataset images with an image annotation tool91 to generate a (manually) annotated index map. Using various performance metrics (as defined in Section 2.4), we compare the manually annotated index map to the predicted index map from the DFT workflow using variance as a feature (Fig. 13). | ||
| Fig. 13 Results of AFM image segmentation using the DFT workflow with variance statistics. For six preprocessed AFM phase images (a–f, left) from the testing dataset, we provide the Acc (accuracy) and Dice score for the comparison of domain segmentations using the DFT workflow with variance statistics (a–f, right panel) versus ‘ground truth’ manual segmentation (a–f, middle panel). | ||
Before we discuss the results of this quantified performance, it is critical for us to highlight the limitations of evaluating the predicted data in this manner. First, manual annotations have a precision vs. time tradeoff where higher precision in annotations consumes more time to annotate even for a small test dataset. Balancing precision and time leads to some compromise in precision, which makes the process prone to errors in the boundary regions of domains. Second, manual annotations are subjective (i.e., person's perspective), leading to inconsistencies especially when two domains look similar to one person but different to another person. Therefore, the similarity metric calculated from the manual annotations is a good representation to measure the bulk of the workflow's performance but does not give us an accurate quantitative metric for each prediction as the manual annotations themselves could be flawed due to manual segmentation.
For all the metrics described in Section 2.4, namely, accuracy, Dice coefficient and IoU, the value ranges from 0 to 1, where 1 is the most accurate and 0 is the least. In Table 3, we present the metrics of similarity between the predicted domain segmentation with the manual segmentation of all AFM images in the test dataset for the ‘best’ workflow (i.e. DFT workflow + variance statistics + k-means clustering). From the results for specific images in Fig. 13 and the collective performance metrics in Table 3, we are able to show that the presented workflow using DFT with variance statistics and k-means clustering performs quite well.
| Metric | DCT | ResNet | DFT | Haar DWT | Orthogonal DWT | Radon | Otsu |
|---|---|---|---|---|---|---|---|
| Accuracy | 0.813 | 0.676 | 0.815 | 0.647 | 0.736 | 0.811 | 0.679 |
| Jaccard similarity | 0.744 | 0.676 | 0.761 | 0.591 | 0.654 | 0.742 | 0.506 |
| Dice coefficient | 0.850 | 0.799 | 0.854 | 0.732 | 0.786 | 0.849 | 0.665 |
4.4. Calculated domain size information from the segmented AFM images.
In ESI Fig. S12,† we present the distributions of light and dark domain sizes for 15 selected AFM images in our dataset of 144 images. We observe that the quantitative predictions of domain sizes are consistent with human interpretation of the domain sizes (comparing with the help of the scale bar present in the image). In ESI Fig. S13,† we present cumulative results of all AFM images from the various polymer films along with the average, standard deviation, maximum, and minimum of light and dark domain sizes observed in the films. These statistics are calculated based on the average of domain sizes observed in AFM images captured across a polymer film sample. Thus, these statistics collate the information of domain sizes observed in a film, which helps us draw various conclusions on the workflow's performance and how the composition affects domain sizes in the polymer films. For instance, the small standard deviation of domain sizes from multiple AFM images captured from different regions of the same polymer film show that the domain size distribution across the sample is similar; this also indicates the workflow's consistency in predictions. Furthermore, the light and dark domain sizes do not have a linear nor an inverse relationship (in other words, we cannot guess the light domains' sizes from the dark domains' sizes); therefore, it is essential to analyze both the light and dark domain sizes, independently. We also found a non-monotonic trend in the light and dark domain sizes for PS-Thy 7 K and PS-Thy 10 K with increasing molecular weight of POEGMA blocks. In a future publication, Gu and coworkers will describe the fundamental insights into these trends in detail.5. Conclusion
Analysis of the features of AFM images with polymer blends has traditionally been a time intensive manual task, which inherits inconsistencies, biases, and errors. Our ML based workflow automates the identification and quantification of domain sizes in AFM images of polymer blends. Our workflow comprising DFT or DCT domain transforms with variance statistics and k-means clustering worked best in segmenting AFM images containing two types of domains from phase separating polymers. Besides visual evaluation, we quantified the performance of our workflow by calculating the overlap in our workflow prediction against the manually annotated images for a small test dataset. We found high accuracy in overlap captured by a Dice coefficient of ∼0.85 on average on all of the test datasets. Further, the prediction accuracy is consistent across domains of different shapes and textures, which proves the generalizability of the solution.This paper also shows that efficient problem formulation enables the nature of the workflow to remain unsupervised, which significantly reduces the traditional labor-intensive and subjective nature of manual interpretation of AFM images in soft materials science. As a result, it speeds up the development process and brings uniformity to analysis.
Lastly, our paper is meant to serve as a guide for readers in polymer science and soft materials who may wish to extend the discussed methods to other microscopy images captured from soft materials. To transfer the knowledge in a precise manner, we present a short summary of the various transforms and ML approaches we tested along with our experiences as we tested them for the task we had at hand (Table 4).
| Approach | Our experience | Parameters that the user selects |
|---|---|---|
| Haar wavelet | • Light on computational intensity | • Level of decomposition |
| • Works on gray scale images | • Window size | |
| • Can adjust the level of decomposition | • Number of clusters or classes | |
| • Requires no training | ||
| • Emphasizes gradients | ||
| • Explains and quantifies features | ||
| • Works well on small tile sizes | ||
| Biorthogonal wavelet | • Light on computational intensity | • Type of wavelet |
| • Works on gray scale images | • Window size | |
| • Can adjust the level of decomposition | • Start level of decomposition | |
| • Requires no training | • Level of decomposition | |
| • Works well on small tile sizes | • Number of clusters or classes | |
| Fourier transform | • Light on computational intensity | • Window size |
| • Works on gray scale images | • Number of clusters or classes | |
| • Requires no training | ||
| • Explains high vs. low frequencies | ||
| • Works well on small tile sizes | ||
| Radon transform | • Light on computational intensity | |
| • Works on gray scale images | • Window size | |
| • Easy to extract directional features and orientations | ||
| • Requires no training | ||
| • Works well on small tile sizes | • Number of clusters or classes | |
| Deep learning ResNet50 | • Able to generate large dimensional features | • Window size minimum 32 pixels × 32 pixels |
| • Able to classify complex details | • Layer selection for feature extraction | |
| • Works on RGB images | • Selection of weights for the model | |
| • Requires no training if using as proposed | • Number of clusters or classes | |
| • Compute relatively slowly | ||
| • Minimum tile size of 32 pixels × 32 pixels | ||
| • Features are not explainable due to black box implementation | ||
| • Highly susceptible to noise | ||
| • Inputs must be normalized |
Code availability
We have made the Python program files open-source and public on the following website: ZENODO DOI: https://doi.org/10.5281/zenodo.13840376 GITHUB: https://github.com/arthijayaraman-lab/Automated-Atomic-Force-Microscopy-Image-Analysis.Data availability
We have uploaded the AFM images we have used for this paper on the Zenodo website: https://zenodo.org/doi/10.5281/zenodo.111798743.Conflicts of interest
There are no conflicts to declare.Acknowledgements
A. J. and A. P. are grateful for financial support from the Multi University Research Initiative (MURI) from the Army Research Office, Award Number W911NF2310260. Y. W. and X. G. are grateful for financial support from the Department of Energy under the award number of DE-SC0024432. A portion of this work was done at the Molecular Foundry, which is supported by the Office of Science, Office of Basic Energy Sciences, of the U.S. Department of Energy under Contract No. DE-AC02-05CH11231.References
- M. R. Bockstaller, R. A. Mickiewicz and E. L. Thomas, Block copolymer nanocomposites: perspectives for tailored functional materials, Adv. Mater., 2005, 17(11), 1331–1349 CrossRef CAS PubMed
.
- M. C. Orilall and U. Wiesner, Block copolymer based composition and morphology control in nanostructured hybrid materials for energy conversion and storage: solar cells, batteries, and fuel cells, Chem. Soc. Rev., 2011, 40(2), 520–535 RSC
- B. Sarkar and P. Alexandridis, Block copolymer–nanoparticle composites: Structure, functional properties, and processing, Prog. Polym. Sci., 2015, 40, 33–62 CrossRef CAS
- G. S. Doerk and K. G. Yager, Beyond native block copolymer morphologies, Mol. Syst. Des. Eng., 2017, 2(5), 518–538 RSC
- M. J. Fasolka and A. M. Mayes, Block copolymer thin films: Physics and applications, Annu. Rev. Mater. Res., 2001, 31(1), 323–355 CrossRef CAS
- I. Hamley, Ordering in thin films of block copolymers: Fundamentals to potential applications, Prog. Polym. Sci., 2009, 34(11), 1161–1210 CrossRef CAS
- L. Yu, K. Dean and L. Li, Polymer blends and composites from renewable resources, Prog. Polym. Sci., 2006, 31(6), 576–602 CrossRef CAS
- A. Sionkowska, Current research on the blends of natural and synthetic polymers as new biomaterials, Prog. Polym. Sci., 2011, 36(9), 1254–1276 CrossRef CAS
- A. C. Balazs, T. Emrick and T. P. Russell, Nanoparticle polymer composites: Where two small worlds meet, Science, 2006, 314(5802), 1107–1110, DOI:10.1126/science.1130557
- M. Moniruzzaman and K. I. Winey, Polymer nanocomposites containing carbon nanotubes, Macromolecules, 2006, 39(16), 5194–5205, DOI:10.1021/ma060733p
- R. A. Vaia and J. F. Maguire, Polymer nanocomposites with prescribed morphology: going beyond nanoparticle-filled polymers, Chem. Mater., 2007, 19(11), 2736–2751 CrossRef CAS
- Q. H. Zeng, A. B. Yu and G. Q. Lu, Multiscale modeling and simulation of polymer nanocomposites, Prog. Polym. Sci., 2008, 33(2), 191–269, DOI:10.1016/j.progpolymsci.2007.09.002
- J. Jancar, J. F. Douglas, F. W. Starr, S. K. Kumar, P. Cassagnau, A. J. Lesser, S. S. Sternstein and M. J. Buehler, Current issues in research on structure-property relationships in polymer nanocomposites, Polymer, 2010, 51(15), 3321–3343, DOI:10.1016/j.polymer.2010.04.074
- S. K. Kumar and R. Krishnamoorti, Nanocomposites: Structure, phase behavior, and properties, Annu. Rev. Chem. Biomol. Eng., 2010, 1, 37–58, DOI:10.1146/annurev-chembioeng-073009-100856
- M. J. A. Hore and R. J. Composto, Functional polymer nanocomposites enhanced by nanorods, Macromolecules, 2014, 47(3), 875–887, DOI:10.1021/ma402179w
- V. Ganesan and A. Jayaraman, Theory and simulation studies of effective interactions, phase behavior and morphology in polymer nanocomposites, Soft Matter, 2014, 10(1), 13–38, 10.1039/c3sm51864g
- M. Liu, Z. Jia, D. Jia and C. Zhou, Recent advance in research on halloysite nanotubes-polymer nanocomposite, Prog. Polym. Sci., 2014, 39(8), 1498–1525 CrossRef CAS
- M. Kotal and A. K. Bhowmick, Polymer nanocomposites from modified clays: Recent advances and challenges, Prog. Polym. Sci., 2015, 51, 127–187 CrossRef CAS
- S. K. Kumar, V. Ganesan and R. A. Riggleman, Perspective: Outstanding theoretical questions in polymer-nanoparticle hybrids, J. Chem. Phys., 2017, 147(2), 020901, DOI:10.1063/1.4990501
- T. E. Gartner and A. Jayaraman, Modeling and Simulations of Polymers: A Roadmap, Macromolecules, 2019, 52(3), 755–786, DOI:10.1021/acs.macromol.8b01836
- J. Li, X. Liu, Y. Feng and J. Yin, Recent progress in polymer/two-dimensional nanosheets composites with novel performances, Prog. Polym. Sci., 2022, 126, 101505 CrossRef CAS
- D. Morgan and R. Jacobs, Opportunities and challenges for machine learning in materials science, Annu. Rev. Mater. Res., 2020, 50, 71–103 CrossRef CAS
- S. Kadulkar, Z. M. Sherman, V. Ganesan and T. M. Truskett, Machine Learning–Assisted Design of Material Properties, Annu. Rev. Chem. Biomol. Eng., 2022, 13, 235–254 CrossRef CAS PubMed
- C. Duan, A. Nandy and H. J. Kulik, Machine learning for the discovery, design, and engineering of materials, Annu. Rev. Chem. Biomol. Eng., 2022, 13, 405–429 CrossRef CAS PubMed
- K. Choudhary, B. DeCost, C. Chen, A. Jain, F. Tavazza, R. Cohn, C. W. Park, A. Choudhary, A. Agrawal and S. J. Billinge, Recent advances and applications of deep learning methods in materials science, npj Comput. Mater., 2022, 8(1), 59 CrossRef
- M. Ge, F. Su, Z. Zhao and D. Su, Deep learning analysis on microscopic imaging in materials science, Mater. Today Nano, 2020, 11, 100087, DOI:10.1016/j.mtnano.2020.100087
- S. R. Spurgeon, C. Ophus, L. Jones, A. Petford-Long, S. V. Kalinin, M. J. Olszta, R. E. Dunin-Borkowski, N. Salmon, K. Hattar and W.-C. D. Yang, Towards data-driven next-generation transmission electron microscopy, Nat. Mater., 2021, 20(3), 274–279 CrossRef CAS PubMed
- S. V. Kalinin, M. Ziatdinov, J. Hinkle, S. Jesse, A. Ghosh, K. P. Kelley, A. R. Lupini, B. G. Sumpter and R. K. Vasudevan, Automated and autonomous experiments in electron and scanning probe microscopy, ACS Nano, 2021, 15(8), 12604–12627 CrossRef CAS PubMed
- A. Baskaran, E. J. Kautz, A. Chowdhary, W. Ma, B. Yener and D. J. Lewis, Adoption of Image-Driven Machine Learning for Microstructure Characterization and Materials Design: A Perspective, JOM, 2021, 73(11), 3639–3657 CrossRef
- K. P. Treder, C. Huang, J. S. Kim and A. I. Kirkland, Applications of deep learning in electron microscopy, Microscopy, 2022, 71(1), i100–i115 CrossRef CAS PubMed
- L. Zhang and S. Shao, Image-based machine learning for materials science, J. Appl. Phys., 2022, 132(10), 100701 CrossRef CAS
- M. Botifoll, I. Pinto-Huguet and J. Arbiol, Machine learning in electron microscopy for advanced nanocharacterization: current developments, available tools and future outlook, Nanoscale Horiz., 2022, 7, 1427–1477, 10.1039/D2NH00377E
- S. V. Kalinin, D. Mukherjee, K. Roccapriore, B. J. Blaiszik, A. Ghosh, M. A. Ziatdinov, A. Al-Najjar, C. Doty, S. Akers and N. S. Rao,
et al., Machine learning for automated experimentation in scanning transmission electron microscopy, npj Comput. Mater., 2023, 9(1), 227, DOI:10.1038/s41524-023-01142-0
- Z. Chen, N. Andrejevic, N. C. Drucker, T. Nguyen, R. P. Xian, T. Smidt, Y. Wang, R. Ernstorfer, D. A. Tennant, M. Chan and M. Li, Machine learning on neutron and x-ray scattering and spectroscopies, Chem. Phys. Rev., 2021, 2(3), 031301, DOI:10.1063/5.0049111
- K. G. Yager, P. W. Majewski, M. M. Noack and M. Fukuto, Autonomous x-ray scattering, Nanotechnology, 2023, 34(32), 322001 CrossRef PubMed
- A. S. Anker, K. T. Butler, R. Selvan and K. M. Ø. Jensen, Machine learning for analysis of experimental scattering and spectroscopy data in materials chemistry, Chem. Sci., 2023, 14(48), 14003–14019, 10.1039/D3SC05081E
- P. Xu, H. Chen, M. Li and W. Lu, New Opportunity: Machine Learning for Polymer Materials Design and Discovery, Adv. Theory Simul., 2022, 5(5), 2100565, DOI:10.1002/adts.202100565
- Y.-Q. Li, Y. Jiang, L.-Q. Wang and J.-F. Li, Data and Machine Learning in Polymer Science, Chin. J. Polym. Sci., 2023, 41(9), 1371–1376, DOI:10.1007/s10118-022-2868-0
- S. Lu and A. Jayaraman, Machine learning for analyses and automation of structural characterization of polymer materials, Prog. Polym. Sci., 2024, 153, 101828, DOI:10.1016/j.progpolymsci.2024.101828
- D. Wang and T. P. Russell, Advances in Atomic Force Microscopy for Probing Polymer Structure and Properties, Macromolecules, 2018, 51(1), 3–24, DOI:10.1021/acs.macromol.7b01459
- S. B. Darling, Directing the self-assembly of block copolymers, Prog. Polym. Sci., 2007, 32(10), 1152–1204, DOI:10.1016/j.progpolymsci.2007.05.004
- Y. Mai and A. Eisenberg, Self-assembly of block copolymers, Chem. Soc. Rev., 2012, 41(18), 5969–5985, 10.1039/C2CS35115C
- Y. Wang, S. Zhang, G. Freychet, Z. Li, K.-L. Chen, C.-T. Liu, Z. Cao, Y.-C. Chiu, W. Xia and X. Gu, Highly Deformable Rigid Glassy Conjugated Polymeric Thin Films, Adv. Funct. Mater., 2023, 33(50), 2306576, DOI:10.1002/adfm.202306576
- M. Mooney, A. Nyayachavadi, A. Awada, E. Iakovidis, Y. Wang, M.-N. Chen, Y. Liu, J. Xu, Y.-C. Chiu, X. Gu and S. Rondeau-Gagné, Asymmetric side-chain engineering in semiconducting polymers: a platform for greener processing and post-functionalization of organic electronics, Polym. Chem., 2023, 14(5), 562–572, 10.1039/D2PY01244H
- H. T. Bai and S. Wu, Nanowire Detection in AFM Images Using Deep Learning, Microsc. Microanal., 2021, 27(1), 54–64, DOI:10.1017/s143192762002468x
- H. T. Bai and S. Wu, Deep-learning-based nanowire detection in AFM images for automated nanomanipulation, Nanotechnol. Precis. Eng., 2021, 4(1), 013002, DOI:10.1063/10.0003218
- Y. X. Han, Y. H. Liu, B. Wang, Q. C. Chen, L. L. Song, L. Tong, C. B. Lai and A. Konagaya, A novel transfer learning for recognition of overlapping nano object, Neural Comput. Appl., 2022, 34(7), 5729–5741, DOI:10.1007/s00521-021-06731-y
- J. Carracedo-Cosme, C. Romero-Muñiz and R. Pérez, A Deep Learning Approach for Molecular Classification Based on AFM Images, Nanomaterials, 2021, 11(7), 1658, DOI:10.3390/nano11071658
-
J. T. Zhang, J. Ren and S. Q. Hu, Ieee. AFM Imaging Defect Detection and Classification with Artificial Intelligence and Deep Learning, in IEEE 23rd International Conference on Nanotechnology (NANO), Jeju, South Korea, Jul 02-05, 2023, 2023, pp. 447–452, DOI:10.1109/nano58406.2023.10231258
- D. Yablon, I. Chakraborty, H. Passino, K. Iyer, A. Doufas and M. Shivokhin, Deep learning to establish structure property relationships of impact copolymers from AFM phase images, MRS Commun., 2021, 11(6), 962–968, DOI:10.1557/s43579-021-00103-2
- Y. G. Chang, Z. Liu, Y. N. Wu and Y. C. Fang, Deep-Learning-Based Automated Morphology Analysis With Atomic Force Microscopy, IEEE Trans. Autom. Sci. Eng., 2023, 21, 7662–7673, DOI:10.1109/tase.2023.3346887
- Y. J. Kim, J. Lim and D. N. Kim, Accelerating AFM Characterization via Deep-Learning-Based Image Super-Resolution, Small, 2022, 18(3), 2103779, DOI:10.1002/smll.202103779
- Y. Liu, Q. Sun, W. Lu, H. Wang, Y. Sun, Z. Wang, X. Lu and K. Zeng, General Resolution Enhancement
Method in Atomic Force Microscopy Using Deep Learning, Adv. Theory Simul., 2019, 2(2), 1800137, DOI:10.1002/adts.201800137
- H. Jung, G. Han, S. J. Jung and S. W. Han, Comparative study of deep learning algorithms for atomic force microscopy image denoising, Micron, 2022, 161, 103332, DOI:10.1016/j.micron.2022.103332
- J. Jeong, T. Kim, B. J. Lee and J. Lee, Predicting Atomic Force Microscopy Topography from Optical Microscopes Using Deep Learning, Adv. Intell. Syst., 2023, 5(1), 2200317, DOI:10.1002/aisy.202200317
- S. Lu and A. Jayaraman, Pair-Variational Autoencoders for Linking and Cross-Reconstruction of Characterization Data from Complementary Structural Characterization Techniques, JACS Au, 2023, 3(9), 2510–2521, DOI:10.1021/jacsau.3c00275
- S. V. R. Akepati, N. Gupta and A. Jayaraman, Computational Reverse Engineering Analysis of the Scattering Experiment Method for Interpretation of 2D Small-Angle Scattering Profiles (CREASE-2D), JACS Au, 2024, 4, 1570–1582, DOI:10.1021/jacsau.4c00068
- S. Z. Lu, B. Montz, T. Emrick and A. Jayaraman, Semi-supervised machine learning workflow for analysis of nanowire morphologies from transmission electron microscopy images, Digital Discovery, 2022, 1(6), 816–833, 10.1039/d2dd00066k
- X. Xu, Q. Wei, H. Li, Y. Wang, Y. Chen and Y. Jiang, Recognition of polymer configurations by unsupervised learning, Phys. Rev. E, 2019, 99(4), 043307, DOI:10.1103/PhysRevE.99.043307
- R. A. Patel and M. A. Webb, Data-Driven Design of Polymer-Based Biomaterials: High-throughput Simulation, Experimentation, and Machine Learning, ACS Appl. Bio Mater., 2024, 7(2), 510–527, DOI:10.1021/acsabm.2c00962
- J. H. Lee, N. Illee and S. D. Kim, A Fast And Adaptive Method To Estimate Texture Statistics By The Spatial Gray Level Dependence Matrix (Sgldm) For Texture Image Segmentation, Pattern Recogn. Lett., 1992, 13(4), 291–303, DOI:10.1016/0167-8655(92)90079-f
- R. Muzzolini, Y. H. Yang and R. Pierson, Texture Characterization Using Robust Statistics, Pattern Recogn., 1994, 27(1), 119–134, DOI:10.1016/0031-3203(94)90022-1
- R. Zhang, Q. Wang and P. Zhang, Image Texture Feature Extraction Based on Gabor Transform, Rev. Tec. Fac. Ing., Univ. Zulia, 2016, 39(1), 237–244 Search PubMed
-
B. Verma, V. Muthukkumarasamy and C. He, Unsupervised clustering of texture features using SOM and Fourier transform, in Proceedings of the International Joint Conference on Neural Networks, 2003, IEEE, 2003, vol. 2, pp. 1237–1242 Search PubMed
- M. K. Bashar, T. Matsumoto and N. Ohnishi, Wavelet transform-based locally orderless images for texture segmentation, Pattern Recogn. Lett., 2003, 24(15), 2633–2650, DOI:10.1016/s0167-8655(03)00107-7
- P. Simon and V. Uma, Deep learning based feature extraction for texture classification, Procedia Comput. Sci., 2020, 171, 1680–1687 CrossRef
-
O. Ronneberger, P. Fischer and T. Brox, U-net: Convolutional networks for biomedical image segmentation, in Medical image computing and computer-assisted intervention–MICCAI 2015: 18th international conference, Munich, Germany, October 5-9, 2015, proceedings, part III, Springer, 2015, vol. 18, pp. 234–241 Search PubMed
-
S. Livens, P. Scheunders, G. van de Wouwer and D. Van Dyck, Wavelets for texture analysis, an overview, 1997 Sixth International Conference on Image Processing and Its Applications, Dublin, Ireland, 1997, vol. 2, pp. 581–585, DOI:10.1049/cp:19970958
-
Z. Feng, F. Ju Fu and S. Qing Yun, Texture feature based on local Fourier transform, in Proceedings 2001 International Conference on Image Processing, (Cat. No.01CH37205), 7-10 Oct. 2001, 2001, vol. 2, pp. 610–613 vol.612, DOI:10.1109/ICIP.2001.958567
- X. Song-Shan and W. Yong-Xing, Rotation-invariant texture analysis using Radon and Fourier transforms, J. Phys.: Conf. Ser., 2007, 48(1), 1459, DOI:10.1088/1742-6596/48/1/268
-
J. Redmon, S. Divvala, R. Girshick and A. Farhadi, You only look once: Unified, real-time object detection, in Proceedings of the IEEE conference on computer vision and pattern recognition, 2016, pp. 779–788 Search PubMed
- H. Wu, J. Zhang, K. Huang, K. Liang and Y. Yu: Rethinking dilated convolution in the backbone for semantic segmentation, arXiv, 2019, preprint, arXiv:1903.11816, DOI:10.48550/arXiv.1903.11816.
- L. C. Chen, G. Papandreou, I. Kokkinos, K. Murphy and A. L. Yuille, DeepLab: Semantic Image Segmentation with Deep Convolutional Nets, Atrous Convolution, and Fully Connected CRFs, IEEE Trans. Pattern Anal. Mach. Intell., 2018, 40(4), 834–848, DOI:10.1109/TPAMI.2017.2699184
- A. Hosna, E. Merry, J. Gyalmo, Z. Alom, Z. Aung and M. A. Azim, Transfer learning: a friendly introduction, Big Data, 2022, 9(1), 102, DOI:10.1186/s40537-022-00652-w
- D. S. Kermany, M. Goldbaum, W. J. Cai, C. C. S. Valentim, H. Y. Liang, S. L. Baxter, A. McKeown, G. Yang, X. K. Wu and F. B. Yan,
et al., Identifying Medical Diagnoses and Treatable Diseases by Image-Based Deep Learning, Cell, 2018, 172(5), 1122–1131, DOI:10.1016/j.cell.2018.02.010
- H. Yamada, C. Liu, S. Wu, Y. Koyama, S. H. Ju, J. Shiomi, J. Morikawa and R. Yoshida, Predicting Materials Properties with Little Data Using Shotgun Transfer Learning, ACS Cent. Sci., 2019, 5(10), 1717–1730, DOI:10.1021/acscentsci.9b00804
-
R. Gonzales and R. W. Digital, Image Processing, Addison-Wesley Publishing Company, 1992 Search PubMed
- N. Ahmed, T. Natarajan and K. R. Rao, Discrete Cosine Transform, IEEE Trans. Comput., 1974, C-23(1), 90–93, DOI:10.1109/T-C.1974.223784
-
C. M. Pun and H. M. Zhu, Textural Image Segmentation Using Discrete Cosine Transform, in 3rd International Conference on Communications and Information Technology, Vouliagmeni, GREECE, Dec 29-31, 2009, 2009, pp, 54-+ Search PubMed
-
(a)
T. Peters, Data-driven science and engineering: machine learning, dynamical systems, and control, S. L. Brunton and J. N. Kutz, Cambridge University Press, Cambridge, 2019, pp. 472, £ 49.99 (hardback), ISBN 9781108422093 Search PubMed
- G. Lee, R. Gommers, F. Waselewski and K. Wohlfahrt, Aaron PyWavelets: A Python package for wavelet analysis, J. Open Source Softw., 2019, 4, 1237, DOI:10.21105/joss.01237
-
K. T. Navya, F. H. Shaik and G. B. Reddy, Ieee. Segmentation of Lung Vessels Using Radon Transform, in 2nd International Conference on Circuits, Controls, and Communications (CCUBE), Bangalore, INDIA, Dec 15-16, 2017, 2017, pp. 121–124 Search PubMed
-
J. Bunk, J. H. Bappy, T. M. Mohammed, L. Nataraj, A. Flenner, B. S. Manjunath, S. Chandrasekaran, A. K. Roy-Chowdhury and L. Peterson, Ieee. Detection and Localization of Image Forgeries using Resampling Features and Deep Learning, in 2017 Ieee Conference On Computer Vision And Pattern Recognition Workshops (Cvprw), 2017 Search PubMed
- R. R. Hughes, B. W. Drinkwater and R. A. Smith, Characterisation of carbon fibre-reinforced polymer composites through radon-transform analysis of complex eddy-current data, Composites, Part B, 2018, 148, 252–259, DOI:10.1016/j.compositesb.2018.05.007
- K. Jafari-Khouzani and H. Soltanian-Zadeh, Radon transform orientation estimation for rotation invariant texture analysis, IEEE Trans. Pattern Anal. Mach. Intell., 2005, 27(6), 1004–1008, DOI:10.1109/TPAMI.2005.126
- O. Russakovsky, J. Deng, H. Su, J. Krause, S. Satheesh, S. Ma, Z. Huang, A. Karpathy, A. Khosla and M. Bernstein,
et al., ImageNet Large Scale Visual Recognition
Challenge, Int. J. Comput. Vis., 2015, 115(3), 211–252, DOI:10.1007/s11263-015-0816-y
-
C. M. Bishop, Pattern recognition and machine learning, Springer, google schola, 2006, vol. 2, pp. 645–678 Search PubMed
- J. T. Gostick, Z. A. Khan, T. G. Tranter, M. D. Kok, M. Agnaou, M. Sadeghi and R. Jervis, PoreSpy: A python toolkit for quantitative analysis of porous media images, J. Open Source Softw., 2019, 4(37), 1296 CrossRef
- D. Müller, I. Soto-Rey and F. Kramer, Towards a guideline for evaluation metrics in medical image segmentation, BMC Res. Notes, 2022, 15(1), 210 CrossRef PubMed
- D. Nečas and P. Klapetek, Gwyddion: an open-source software for SPM data analysis, Open Phys., 2012, 10(1), 181–188, DOI:10.2478/s11534-011-0096-2
-
T. Maxim, M. Mikhail, H. Andrey and L. Nikolai, Label Studio: Data labeling software, 2020 Search PubMed
Footnote |
| † Electronic supplementary information (ESI) available: S.I. Dataset, S.II. tiles and win factor, S.III. discrete wavelet transform, S.IV. Radon transform, S.V. methods experimented to improve ResNet50 performance, and S.VI. domain size distribution calculated using the Porespy package. See DOI: https://doi.org/10.1039/d4dd00215f |
| This journal is © The Royal Society of Chemistry 2024 |