 Open Access Article
Creative Commons Attribution 3.0 Unported Licence
Low-spin to low-spin valence tautomeric transition in cobalt bis-dioxolenes†
Max
Mörtel
a,
Stephen J.
Goodner
a,
Johannes
Oschwald
b,
Andreas
Scheurer
 a,
Thomas
Drewello
 b and
Marat M.
Khusniyarov
 *a
*a
aDepartment of Chemistry and Pharmacy, Friedrich-Alexander University Erlangen-Nürnberg (FAU), Egerlandstraße 1, 91058, Germany. E-mail: marat.khusniyarov@fau.de
bDepartment of Chemistry and Pharmacy, Friedrich-Alexander University Erlangen-Nürnberg (FAU), Egerlandstraße 3, 91058, Germany
First published on 24th January 2024
Abstract
Cobalt dioxolenes are a well-known class of switchable coordination compounds showing intramolecular electron transfer, which is always accompanied by a spin state change at the cobalt center. Here, we present the first example of thermally switchable cobalt bis-dioxolenes where intramolecular electron transfer seems to take place, but the spin state change is suppressed. This leads to the detection of thermal transition between a common ls-CoIII(SQ˙−)(Cat2−) and an extremely rare ls-CoII(SQ˙−)2 electronic state (hs – high-spin, ls – low-spin, SQ˙− – benzosemiquinonate(1−) radical and Cat2− – catecholate(2−)). Parallel to the present work, a similar work but on cobalt mono-dioxolenes has just appeared (Chem. Eur. J., 2023, 29, e202300091), suggesting thermal transition between ls-CoIII(Cat2−) and ls-CoII(SQ˙−) electronic states.
Introduction
Valence tautomeric (VT) metal complexes (redox-isomers) are a promising class of switchable or bistable coordination compounds (Scheme 1).1–3 Stimuli-induced intramolecular electron transfer between two redox-units in such species – a metal ion and a redox-active ligand – allows one to change and to control their electronic structure and thus to modulate their physical properties. VT cobalt dioxolenes are especially interesting because intramolecular electron transfer is always accompanied by a spin change (spin-crossover) at the cobalt center, resulting in larger modulation of magnetic properties and electrical conductivity,4–8 which is in turn highly attractive for emerging molecular electronics and spintronics.9,10 Krüger et al. reported a rare example of a cobalt mono-dioxolene system that does show a spin-crossover at the Co(II) center, but no intramolecular electron transfer between the cobalt and the single dioxolene ligand.11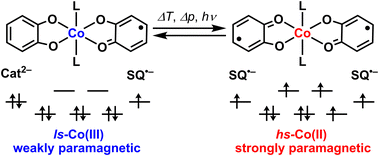 | ||
| Scheme 1 Switchable cobalt bis-dioxolenes; note that mono-dioxolenes contain only one redox-active dioxolene ligand per molecule. | ||
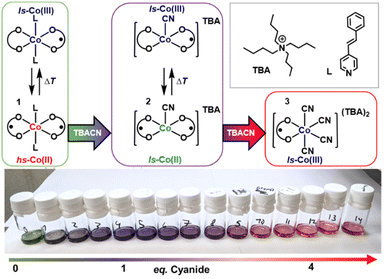
Recently, we suggested the working principles of liquid-phase chemosensors based on VT cobalt dioxolenes and demonstrated the first prototype system.12 When weakly bound trans-4-styrylpyridine (stypy) ligands in the prototype sensor [Co(diox)2(stypy)2] 1 (Scheme 2) were replaced by different analytes – weakly and strongly coordinating ligands – VT equilibrium between hs-CoII(SQ˙−)2 and ls-CoIII(SQ˙−)(Cat2−) redox-isomers in 1 was shifted, resulting in a significant colorimetric and magnetic response at room temperature (hs – high-spin, ls – low-spin, diox – dioxolene ligand of this work at an unspecified oxidation level, SQ˙− – benzosemiquinonate(1−) radical and Cat2− – catecholate(2−)).12
By expanding the scope of analytes in this work, we studied the sensing of cyanide anions by 1, which has brought unexpected and highly interesting results. Upon reaction of 1 with 1 eq. of cyanide, a unique ls-CoII(SQ˙−)2 species 2 has been generated in situ (Scheme 2). Complex 2 shows an extremely rare thermally driven VT transition between two ls states: ls-CoII(SQ˙−)2 ⇄ ls-CoIII(SQ˙−)(Cat2−). To the best of our knowledge, the transition between two ls states in cobalt dioxolenes has been just reported by Krüger et al. for the very first time.13 Based on extensive analysis of electronic absorption spectra, they suggested detecting ls-CoII(SQ˙−) ⇄ ls-CoIII(Cat2−) transition in a series of VT mono-dioxolene complexes featuring one dioxolene ligand per complex. We became aware of this work only during the referential process. In our work, we deal with a bis-dioxolene system featuring two dioxolene ligands and rely on magnetic measurements, IR and EPR spectroscopy. Our original data deposited to ChemRxiv before the current submission can be found online.14
Experimental section
All starting materials and solvents were utilized as received without further purification unless otherwise noted. Pure anhydrous solvents were collected from a Glass Contour solid-state solvent purification system (Irvine, CA). [Co(tBu-dioxolene)2]4 and [Co(tBu-dioxolene)(CN)4](TBA)2 (3) were prepared according to the literature methods.15,16 [Co(tBu-dioxolene)2(stypy)2] (1) was prepared according to the literature methods with minor modifications.17 Complex 1 was washed with hexanes and dried in vacuo (80 °C) overnight. Purity was confirmed by elemental analysis and solid-state magnetic measurements. Tetrabutylammonium cyanide (TBACN) was purchased from Sigma Aldrich®, dried in vacuo (3 days, 80 °C), and stored under nitrogen before use.NMR spectroscopy
NMR spectra were recorded at 298 K with a JEOL ECP 400 MHz in rotating 5 mm o.d. tubes with a J. Young valve and processed using Delta V4.0 software provided by JEOL Ltd. All solutions have been prepared under inert conditions. Melting point capillary tubes sealed with Weiton® wax were used as inner tubes in Evans NMR experiments. Experiments with temperatures above room temperature were conducted with sealed capillaries by melting. The magnetic susceptibility data were corrected for diamagnetism using an estimation χm, diamag = ½ Mw × 10−6 cm3 mol−1 with Mw being the molar mass of the complex.18 The χT product was fitted using the van't Hoff equation (eqn (1)) to give the enthalpy and entropy changes ΔH and ΔS for LS → HS conversion with χLT and χHT being the low- and high-temperature limits for molar magnetic susceptibility, respectively. | (1) |
Magnetism
Magnetic susceptibility data on solid samples were collected with a Quantum Design MPMS 3 magnetometer. DC susceptibility data were collected in the temperature range of 2–330 K for powder samples restrained with a polycarbonate gel capsule in an applied magnetic field of 0.1 T at a heating/cooling rate of 2 K min−1 and at 5 K intervals. The magnetic susceptibility data were corrected for diamagnetism using an estimation χm, diamag = ½ Mw × 10−6 cm3 mol−1 with Mw being the molar mass of the compound.18UV-vis-NIR spectroscopy
Electronic absorption spectra were recorded at 298 K in sealed custom-made Quartz SUPRASIL (QS) cells with a Shimadzu UV 3600 spectrophotometer and a Julabo F10C cryostat with a custom-made cooling attachment. Variable-temperature electronic absorption spectra were recorded with an Analytik Jena SPECORD S600 spectrophotometer and fitted using the van't Hoff eqn (2) to give the enthalpy and entropy changes ΔH and ΔS, respectively, for the ls-Co(III) → hs-Co(II) conversion, where ALT and AHT are low- and high-temperature limits for absorbance, respectively. | (2) |
All solutions have been prepared under inert conditions.
EPR spectroscopy
EPR spectra were recorded on a JEOL CW spectrometer JES-FA200 equipped with an X-band Gunn diode oscillator bridge, a cylindrical mode cavity, and a N2/He cryostat. The samples were measured in Quartz glass EPR tubes in solution (DCM, RT) or frozen solution (DCM, in inner quartz capillary, ∼100 K). Data analysis and simulations were performed using the programs eview and esim, written by the late Dr. Eckhard Bill (MPI CEC, Mülheim/Ruhr).Mass spectrometry
Mass spectrometry was performed with a micrOTOF-Q II orthogonal acceleration qToF mass spectrometer (Bruker Daltonics, Bremen, Germany) equipped with an ESI ion source. The instrumental settings were adjusted for the maximum signal intensity. The ion source parameters are as follows: heated nitrogen (200 °C) was used as the drying gas at a flux of 4 L min−1. Likewise, nitrogen was used as the nebulizing gas at a pressure of 0.4 bar. CID experiments were conducted with nitrogen as the collision gas. The solution was sprayed (180 μL h−1) using a syringe pump. The solution of 1![[thin space (1/6-em)]](https://www.rsc.org/images/entities/char_2009.gif) :
:![[thin space (1/6-em)]](https://www.rsc.org/images/entities/char_2009.gif) 1 DCM/toluene (v/v) with 1 × 10⁻⁵ mol L−11 and 0–1 × 10⁻⁵ mol L−1 TBACN (0–1 eq.) was prepared in a glove box and transferred to the instrument in a sealed container which was opened directly before the measurement, and the solution was transferred completely to a syringe. The use of DCM as a pure solvent was not possible, due to its low boiling point. Due to the restrictions of the experimental setup, complete exclusion of air was not possible. It has to be noted that the solution is somewhat problematic for the ESI, as cobalt deposition in the ESI needle can occur, especially in the negative ion mode. This can lead to obstruction of the ESI needle. To minimize the exposure to CN−, acquisition times were kept to a minimum. However, experiments were repeated to check reproducibility.
1 DCM/toluene (v/v) with 1 × 10⁻⁵ mol L−11 and 0–1 × 10⁻⁵ mol L−1 TBACN (0–1 eq.) was prepared in a glove box and transferred to the instrument in a sealed container which was opened directly before the measurement, and the solution was transferred completely to a syringe. The use of DCM as a pure solvent was not possible, due to its low boiling point. Due to the restrictions of the experimental setup, complete exclusion of air was not possible. It has to be noted that the solution is somewhat problematic for the ESI, as cobalt deposition in the ESI needle can occur, especially in the negative ion mode. This can lead to obstruction of the ESI needle. To minimize the exposure to CN−, acquisition times were kept to a minimum. However, experiments were repeated to check reproducibility.
IR spectroscopy
IR spectra were recorded on a Shimadzu IRTracer-100 Fourier transform infrared spectrophotometer. Sample solutions were measured in a custom Specac 1 mm liquid IR cell with 570 μm transparent NaCl windows, sealed with Teflon caps to exclude air. Data points were recorded in DCM (c = 2.5 × 10⁻³ M) with a background of neat DCM.Titrations
Unless otherwise stated, all titrations were carried out in an MBraun LABmaster dinitrogen-filled glovebox using dry, degassed solvents stored over activated 4 Å molecular sieves.Titration experiments monitored by UV-VIS-NIR spectroscopy, Evans NMR spectroscopy, and mass spectrometry were performed by keeping the initial concentration of the cobalt complex constant. A stock solution of the complex (c = 5 × 10⁻⁴ M) in DCM was prepared in a 50 mL volumetric flask. Another stock solution of the analyte salt (c = 3 × 10⁻² M) in MeCN was prepared separately. For each titration point, the necessary equivalents of the analyte solution required for 3 mL of the complex solution were transferred to a vial. The solvent was carefully removed in vacuo, leaving behind the neat salt. Then, 3 mL of complex solution was added using an Eppendorf® pipette to achieve a solution with the desired amounts of analyte equivalents. For Evans titration experiments a DCM![[thin space (1/6-em)]](https://www.rsc.org/images/entities/char_2009.gif) :
:![[thin space (1/6-em)]](https://www.rsc.org/images/entities/char_2009.gif) DCM-d2
DCM-d2![[thin space (1/6-em)]](https://www.rsc.org/images/entities/char_2009.gif) :
:![[thin space (1/6-em)]](https://www.rsc.org/images/entities/char_2009.gif) TMS = 10
TMS = 10![[thin space (1/6-em)]](https://www.rsc.org/images/entities/char_2009.gif) :
:![[thin space (1/6-em)]](https://www.rsc.org/images/entities/char_2009.gif) 2
2![[thin space (1/6-em)]](https://www.rsc.org/images/entities/char_2009.gif) :
:![[thin space (1/6-em)]](https://www.rsc.org/images/entities/char_2009.gif) 1 mixture was used. For each titration point, an individual reference was prepared, which contained the same amount of analyte as the complex solution under investigation. Consequently, the diamagnetic contribution of the analyte and the solvent mixture has been automatically corrected.
1 mixture was used. For each titration point, an individual reference was prepared, which contained the same amount of analyte as the complex solution under investigation. Consequently, the diamagnetic contribution of the analyte and the solvent mixture has been automatically corrected.
For both IR and EPR spectroscopy, a stock solution of the complex (c = 7.5 × 10⁻³ M) in DCM was prepared in a 50 mL volumetric flask. Another solution of the analyte salt TBACN (c = 9.0 × 10⁻² M) in DCM was prepared separately. The necessary aliquot of the analyte for each titration point was diluted with different aliquots of DCM, keeping both the concentration of the complex and the final volumes constant. The aliquot of the analyte was added dropwise to the solution of the complex and stirred slightly for 2–3 minutes. Samples for the reference complex (TBA)2[Co(tBu-dioxolene)(CN)4] were prepared by making a solution of the complex with the same concentration as the solutions for each data point (IR: c = 2.5 × 10⁻³ M; EPR: c = 1.0 × 10⁻³ M).
Attempts for the synthesis of 2
The synthesis and isolation of 2 have been attempted in dry, air-free MeCN or DCM using tetrameric [Co(tBu-dioxolene)2]4 or monomeric [Co(tBu-dioxolene)2(py)2]19 as starting materials. The solutions of 0.5 to 2 eq. of TBACN have been added to a starting material in bulk or by slow addition at RT to form the characteristic purple solution of 2. Precipitation by slow diffusion, low temperature or solvent evaporation only yielded crystalline thermodynamically stable species 3, often combined with the [Co(tBu-dioxolene)2]4 starting material. It was possible to precipitate 3 out of a solution with only 0.5 eq. of TBACN, during which the color of the solution changed from purple (the intrinsic color of 2) to dark-green – the characteristic color of [Co(tBu-dioxolene)2]4. Note that solutions of in situ generated 2 can be stored under strictly anaerobic conditions for weeks without detectable degradation. The in situ preparation of 2 was done following the general method for all titration experiments (vide supra).Theoretical calculations
The ORCA 5.0.2 program was used for all calculations.20 Geometry optimizations were performed on truncated models with all tert-butyl groups replaced by methyl groups, starting from available X-ray structures if possible. The OPBE functional was used for geometry optimization and energetics.21,22 We used the def2-TZVP basis set for Co, def2-TZVP(-f) basis sets for the first coordination sphere, and def2-SV(P) sets for the rest.23 To speed up the calculations, RI approximation with def2/J auxiliary basis sets24 was employed routinely. The conductor-like polarizable continuum model (C-PCM)25 was used routinely (solvent = dichloromethane). The true minima were confirmed by calculating vibrational frequencies showing no negative values. When calculating thermodynamic parameters, zero-point energy and thermal energy corrections (T = 298.15 K) were applied routinely.For time-dependent DFT, hybrid B3LYP26,27 was used. The same basis sets as for geometry optimization runs were used. The calculations were sped up by using RIJCOSX approximation with appropriate def2/J auxiliary basis sets.24 The first 100 excited states were calculated in each case.
To simulate the evolution of electronic absorption spectra upon titrations, we have calculated the electronic absorption spectra of complexes that should be present in solution at the starting and end points of titration and then calculated their weighted sum. Typical compositions correspond to ratios of 10![[thin space (1/6-em)]](https://www.rsc.org/images/entities/char_2009.gif) :
:![[thin space (1/6-em)]](https://www.rsc.org/images/entities/char_2009.gif) 0, 8
0, 8![[thin space (1/6-em)]](https://www.rsc.org/images/entities/char_2009.gif) :
:![[thin space (1/6-em)]](https://www.rsc.org/images/entities/char_2009.gif) 2, 6
2, 6![[thin space (1/6-em)]](https://www.rsc.org/images/entities/char_2009.gif) :
:![[thin space (1/6-em)]](https://www.rsc.org/images/entities/char_2009.gif) 4, 4
4, 4![[thin space (1/6-em)]](https://www.rsc.org/images/entities/char_2009.gif) :
:![[thin space (1/6-em)]](https://www.rsc.org/images/entities/char_2009.gif) 6, 2
6, 2![[thin space (1/6-em)]](https://www.rsc.org/images/entities/char_2009.gif) :
:![[thin space (1/6-em)]](https://www.rsc.org/images/entities/char_2009.gif) 8, and 0
8, and 0![[thin space (1/6-em)]](https://www.rsc.org/images/entities/char_2009.gif) :
:![[thin space (1/6-em)]](https://www.rsc.org/images/entities/char_2009.gif) 10 between two species. The calculated electronic spectra to simulate titrations were 3 = [Co(diox)(CN)4]2− dianion in the ls-CoIII(SQ˙−) state (S = 1/2) and 2five = [Co(diox)2(CN)]1− anion in the ls-CoII(SQ˙−)2 state (S = 3/2). Two cases were considered for parent 1. Since 1 presents as a mixture of states at RT, the electronic spectrum of 1 used for titration simulations was constructed as a weighted sum of a six-coordinate [Co(diox)2(stypy)2] in the ls-CoIII(SQ˙−)(Cat2−) state (S = 1/2, 37%) and a six-coordinate [Co(diox)2(stypy)2] in the hs-CoII(SQ˙−)2 state (S = 5/2, 63%). Since 1 is usually partially dissociated in solution at RT and the degree of dissociation in DCM at given concentrations is not known,17 we considered an alternative electronic absorption spectrum for 1 composed of the same six-coordinate [Co(diox)2(stypy)2] in the ls-CoIII(SQ˙−)(Cat2−) state (S = 1/2, 37%) and a five-coordinate [Co(diox)2(stypy)] in the hs-CoII(SQ˙−)2 state (S = 5/2, 63%). Both simulations provided similar results, whereas the simulation with five-coordinate species was slightly closer to the experimental data.
10 between two species. The calculated electronic spectra to simulate titrations were 3 = [Co(diox)(CN)4]2− dianion in the ls-CoIII(SQ˙−) state (S = 1/2) and 2five = [Co(diox)2(CN)]1− anion in the ls-CoII(SQ˙−)2 state (S = 3/2). Two cases were considered for parent 1. Since 1 presents as a mixture of states at RT, the electronic spectrum of 1 used for titration simulations was constructed as a weighted sum of a six-coordinate [Co(diox)2(stypy)2] in the ls-CoIII(SQ˙−)(Cat2−) state (S = 1/2, 37%) and a six-coordinate [Co(diox)2(stypy)2] in the hs-CoII(SQ˙−)2 state (S = 5/2, 63%). Since 1 is usually partially dissociated in solution at RT and the degree of dissociation in DCM at given concentrations is not known,17 we considered an alternative electronic absorption spectrum for 1 composed of the same six-coordinate [Co(diox)2(stypy)2] in the ls-CoIII(SQ˙−)(Cat2−) state (S = 1/2, 37%) and a five-coordinate [Co(diox)2(stypy)] in the hs-CoII(SQ˙−)2 state (S = 5/2, 63%). Both simulations provided similar results, whereas the simulation with five-coordinate species was slightly closer to the experimental data.
Molecular orbitals were visualized using Molekel.28 Calculated electronic absorption spectra were produced with orca_mapspc ORCA's tool by setting a constant linewidth of 1000 cm−1 for each transition.
Results and discussion
Electronic absorption spectroscopy and magnetochemistry
Upon titration of 1 with up to 1 eq. of tetrabutylammonium cyanide (TBACN), the color of the solution changes from vibrant green to purple, before changing to red with more than 2 eq. of TBACN. The close inspection of evolving absorption at 880 and 1330 nm shows distinct inflection/saddle points with 1 and 4 eq. (Fig. 1), which suggests two sequential reactions. The initial color change with 1 eq. of TBACN is accompanied by the appearance of intense absorption bands at 535 and 881 nm, while the broad band(s) in the short-wave infrared (SWIR) region between 1400 and 3000 nm disappears (Fig. 1, S2–S4†). The latter band is characteristic of ligand-to-ligand inter-valence charge transfer (LLIVCT) in a ligand mixed-valence ls-CoIII(SQ˙−)(Cat2−) state.17,29 Thus, the disappearance of the LLIVCT band suggests an identical oxidation level of two dioxolene ligands: both SQ˙− or both Cat2− in the species formed.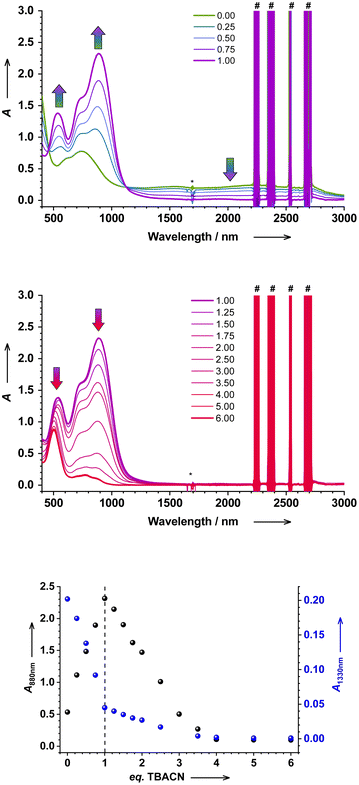 | ||
| Fig. 1 Electronic absorption spectrum of 1 in DCM (c = 5 × 10⁻⁴ M) titrated with TBACN (top: 0 to 1 eq., middle: 1 to 6 eq.); (*) is a spectrometer artefact, and (#) are due to solvent overtones. The evolution of absorption at given wavelengths (880 and 1330 nm) upon titration (bottom). See the ESI† for details. | ||
Since stypy ligands are weakly bound to the cobalt center in 1 (the first dissociation constant Kd,RT = Ka,RT−1 = 5.7(5) × 10−3 mol L−1) and therefore prone to substitution,12 we suggest the replacement of one stypy ligand by a strongly binding cyanide anion. Similar substitution reactions with other ligands have been observed previously.12 Distinct isosbestic points confirm a clear adduct-to-product conversion, suggesting the formation of a monocyanido species 2 in the first reaction. The absence of bands in the SWIR region points to its CoII(SQ˙−)2 electronic structure. Note that the fate of the second stypy ligand remains uncertain at this point.
As more TBACN is added (up to 4 eq.), the bands of 2 decrease in intensity, and the band at 535 nm becomes hypsochromically shifted to 505 nm, while the SWIR region remains featureless (Fig. 1). The gradual evolution of the spectrum provides no evidence for the formation of intermediate di/tricyanido species in any significant quantities. The spectra of solutions with >4 eq. are virtually identical, confirming that the second reaction is complete with 4 eq. of TBACN. Similarly, Wicholas et al. reported the exclusive formation of [ls-CoIII(SQ˙−)(CN)4]2− anions (accompanied by the loss of one dioxolene ligand) instead of a biscyanido complex, when the [hs-CoII(SQ˙−)2]4 tetramer was treated with 8 eq. of TBACN.16 We have independently synthesized this reference compound as the (TBA)2[ls-CoIII(SQ˙−)(CN)4] coordination salt 3. The electronic spectrum of 3 closely resembles the spectrum of 1 with 4 eq. of TBACN, which confirms the formation of 3 in the investigated solution (Fig. S8†). The apparent absence of particularly biscyanido species in this and previous16 work is surprising. With CN− showing both trans and cis effects in octahedral complexes, a single coordinated cyanide may activate the complex for subsequent substitution reactions.30,31
The magnetic properties of a solution of 1 upon titration with TBACN have been investigated by the Evans NMR method (Fig. 2). The χT product of 1 in DCM is 2.2(1) cm3 mol−1 K, which is in agreement with the co-presence of ls-CoIII(SQ˙−)(Cat2−) and hs-CoII(SQ˙−)2 redox-isomers: 37% and 63%, respectively. These numbers have been obtained using reference values of 0.357 and 3.25 cm3 mol−1 K for respective pure states, by fitting experimental data.17 Upon addition of TBACN, χT decreases and reaches a visible saddle point at 1.0(1) cm3 mol−1 K with 1 eq. of TBACN for in situ formed 2. More eq. of TBACN lead to a further drop of the χT value to 0.4(1) cm3 mol−1 K, which is in agreement with a spin-doublet state (S = 1/2) of tetracyanido species 3 (vide supra).
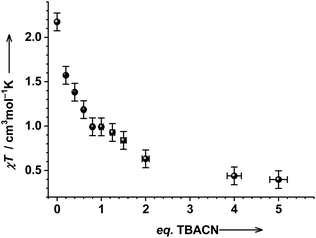 | ||
Fig. 2 Magnetic properties of 1 in DCM![[thin space (1/6-em)]](https://www.rsc.org/images/entities/char_2009.gif) : :![[thin space (1/6-em)]](https://www.rsc.org/images/entities/char_2009.gif) DCM-d2 DCM-d2![[thin space (1/6-em)]](https://www.rsc.org/images/entities/char_2009.gif) : :![[thin space (1/6-em)]](https://www.rsc.org/images/entities/char_2009.gif) TMS (10 TMS (10![[thin space (1/6-em)]](https://www.rsc.org/images/entities/char_2009.gif) : :![[thin space (1/6-em)]](https://www.rsc.org/images/entities/char_2009.gif) 2 2![[thin space (1/6-em)]](https://www.rsc.org/images/entities/char_2009.gif) : :![[thin space (1/6-em)]](https://www.rsc.org/images/entities/char_2009.gif) 1) (c = 5 × 10⁻⁴ M) with different eq. of TBACN. 1) (c = 5 × 10⁻⁴ M) with different eq. of TBACN. | ||
The value of 1.0(1) cm3 mol−1 K measured for in situ formed 2 can, in principle, be explained as follows: Scenario A: species 2 is a classical VT complex, showing the co-presence of ls-CoIII(SQ˙−)(Cat2−) and hs-CoII(SQ˙−)2 redox-isomers at RT in solution (78 and 22%, respectively). Note that the major isomer would be ls-CoIII(SQ˙−)(Cat2−) in this case. Scenario B: complex 2 is a very rare ls-Co(II) species with an ls-CoII(SQ˙−)2 electronic structure. In the spin-only approximation of essentially uncoupled at RT magnetic centers, the χT value of 1.125 cm3 mol−1 K is expected for such species (3 × 0.375 = 1.125), which is close to the experimentally observed value of 1.0(1) cm3 mol−1 K. Scenario A is unlikely due to the absence of the LLIVCT band in SWIR/NIR, which is further supported by variable-temperature measurements (vide infra).
As our numerous attempts to isolate intriguing species 2 were unsuccessful (it seems that 2 is thermodynamically stable only in solutions, but becomes converted into thermodynamically stable solids 1 and 3), further challenging studies have been performed on 2 prepared in situ by adding 1.0 eq. of TBACN to 1.
Variable-temperature electronic absorption spectroscopy in DCM and MeCN solutions of 2 reveals similar temperature-dependent evolution of the spectra (Fig. 3 and S12,† for the color change see Fig. S21†). Starting at RT and upon lowering the temperature, all bands in the visible region decrease in intensity, which is typical of the thermal switching to the ls-CoIII(SQ˙−)(Cat2−) state at low temperatures.17,29,32,33 Unfortunately, our variable-temperature set-up does not allow us to probe the SWIR region at low temperatures. The thermal switching was fully reversible. Importantly, we were not able to observe any significant changes in the spectra upon heating above RT. Thus, scenario A, which implies that ls-CoIII(SQ˙−)(Cat2−) ⇄ hs-CoII(SQ˙−)2 VT equilibrium with the major ls-CoIII(SQ˙−)(Cat2−) component at RT, can be excluded, since large spectral changes due to thermal switching to hs-CoII(SQ˙−)2 would be expected in this case. Thus, 2 should be a unique ls-Co(II) species with the ls-CoII(SQ˙−)2 electronic structure.
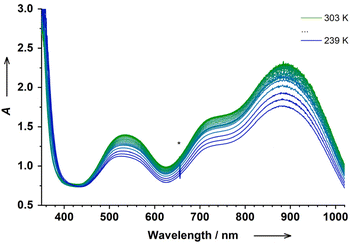 | ||
| Fig. 3 Temperature-dependent electronic absorption spectrum of in situ generated 2 in DCM (c = 5 × 10⁻⁴ M); (*) is a spectrometer artefact. | ||
The magnetic properties of 2 in solution have been investigated by the Evans NMR method at different temperatures. The χT product of 2 showed no significant changes upon heating from 298 to 313 K (Fig. S15†). This is in agreement with nearly unchanging UV-vis spectra at elevated temperatures (vide supra). Another sample of 2 was used for testing the low temperature region. The χT products of the two samples prepared independently are not identical at RT, which is, however, within the uncertainty of the method.
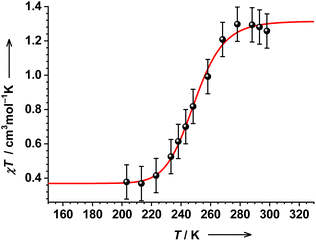
Upon lowering the temperature, the χT product of 1.25(10) cm3 mol−1 K at 298 K remains nearly constant up to 278 K, before falling sharply to 0.4(1) cm3 mol−1 K at 203 K (Fig. 4). The drop to 0.4(1) cm3 mol−1 K at low temperatures should be the thermal transition to a common ls-CoIII(SQ˙−)(Cat2−) state.34 Thus, 2 shows a unique VT transition between two different low-spin states, namely, ls-CoII(SQ˙−)2 ⇄ ls-CoIII(SQ˙−)(Cat2−). The thermodynamic parameters obtained by fitting available variable-temperature data are rather uncertain and slightly higher than those typically observed for classical VT cobalt-dioxolenes (see the caption to Fig. 4 and Table S1†).35 These deviations might be ascribed to the proposed unique electronic (and geometric) structure of 2 or might indicate some minor dissociation/association processes in solution.17,32 Thus, the determined parameters must be considered with care.
EPR spectroscopy
The electronic structure of in situ generated 2 has been further probed by EPR spectroscopy. Additionally, we re-measured reference complexes 1![[thin space (1/6-em)]](https://www.rsc.org/images/entities/char_2009.gif) 17 and 3
17 and 3![[thin space (1/6-em)]](https://www.rsc.org/images/entities/char_2009.gif) 16 under conditions similar to those of 2, as well as in situ generated 3 when reacting 1 with 4 eq. of TBACN.
16 under conditions similar to those of 2, as well as in situ generated 3 when reacting 1 with 4 eq. of TBACN.
At RT, the parent 1 shows an 8-line signal at giso = 2.007, which is due to a ligand-based radical ls-CoIII(SQ˙−)(Cat2−) (Fig. S18†).17,32 The corresponding hs-CoII(SQ˙−)2 isomer, which is present at RT as well, is EPR inactive due to rapid relaxation at RT. Under similar conditions, 3 shows a 16-line signal of an organic-based radical at giso = 2.009, which is due to coupling to one 59Co nucleus (I = 7/2) and one aromatic proton of the SQ˙− ligand (Fig. S19†).16
The solution of in situ generated 2 is practically EPR-silent at RT, showing only very weak signals at g ∼ 2.0, which should be due to small amounts of unknown EPR-active species (by-product(s)) and traces of the unreacted 1 and the end-product 3. This is also expected for 2 with its unique electronic structure ls-CoII(SQ˙−)2, which implies very fast relaxation due to a cobalt-centered spin. This confirms that the electronic structure of 2 is very different from reference species 1 and 3.
We postulated and confirmed by UV-vis-NIR spectroscopy that tetracyanido species 3 is formed when 1 is reacted with 4 eq. of TBACN (vide supra). Now, we can further confirm this by EPR spectroscopy. The EPR spectra of 1 with 4 eq. of TBACN and reference 3 are very similar at RT, confirming the formation of 3 (Fig. S20†). However, a minor component might be hidden underneath the major 16-line signal of in situ formed 3, as can be judged from the slight disturbance in the hyperfine pattern. The presence of an unknown minor species in solution is also confirmed by IR spectroscopy (vide infra).
EPR-active impurities, detected in solutions of in situ formed 2 and 3, are actually to be expected. This is because substitution reactions in metal complexes with ligand radicals never proceed quantitatively according to our experience.
At low temperatures (∼100 K), frozen solutions of 1 and 3 show similar broad signals at g ∼ 2.0 due to the essentially ligand-based radicals ls-CoIII(SQ˙−)(Cat2−) and ls-CoIII(SQ˙−), respectively, the only thermally populated states at low temperatures (Fig. S22 and S23†).17 The hyperfine coupling pattern was not resolved under the given conditions in both cases.
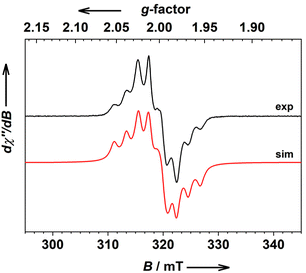
The frozen solution of 2 shows a signal at gav = 2.001 with well-resolved (super) hyperfine coupling to one 59Co nucleus (Fig. 5). This 8-line spectrum is characteristic of the ls-CoIII(SQ˙−)(Cat2−) state with weak coupling to one 59Co nucleus,17 which, in turn, further supports our hypothesis on unique thermal VT transition from the ls-CoII(SQ˙−)2 to ls-CoIII(SQ˙−)(Cat2−) state in 2 upon cooling.
The EPR spectrum of 1 titrated with 4 eq. of TBACN shows a low-temperature spectrum with poorly but resolved hyperfine coupling to one 59Co nucleus, which generally resembles the spectrum of reference 3, for which the coupling was, however, not resolved in our hands (Fig. S24†). This discrepancy might be associated with different polarities of these two solutions. It is also interesting to note that the coupling is notably stronger for 2 than for in situ formed 3 (Fig. S25†).
IR spectroscopy
We used IR spectroscopy to follow the reaction of 1 with cyanides as well. All measurements were performed in DCM solutions at RT (Fig. S26†). The most interesting and informative region of the spectrum is obviously the region of CN-stretching. Upon titration of 1 with up to 1 eq. of TBACN, an absorption band at 2120 cm−1 develops linearly with the added TBACN (Fig. 6 and S27†). We assign this band to cobalt-coordinated CN-stretching in 2 (calculated with OPBE-DFT: 2116 cm−1). Linear evolution of this band confirms very strong binding, which is to be expected and also in agreement with other methods (vide supra). The band appears to be strongly shifted to higher wavenumbers compared to the free TBACN reference (2111 cm−1), and slightly shifted to lower wavenumbers compared to tetracyanido reference cobalt complex 3 (2121 cm−1). Interestingly, the spectrum of the TBACN reference shows additional features (“satellites”) at 2160, 2140, and ∼2082 cm−1, which we assign to other CN-stretching modes in differently solvated/dissociated/associated salts in DCM solution.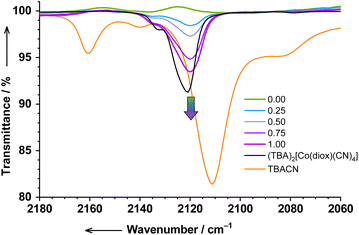 | ||
| Fig. 6 The evolution of the CN-stretching region of the IR spectrum of 1 titrated with TBACN (0…1 eq.) in DCM (c = 2.5 × 10⁻³ M). | ||
Further titration (1 to 4 eq. of TBACN) results in the complicated evolution of the spectrum (Fig. S28†). Although complete analysis is neither possible due to severe overlapping bands nor important for the goals of the present paper, we are able to make some conclusions. Firstly, the reaction 2 → 3 proceeds likely in several steps. The appearance of the band at 2110 cm−1, when 1.25 eq. of TBACN is added, suspiciously resembles the band of free TBACN (2111 cm−1), but is likely due to some other unknown species (vide infra). The spectrum with 4.0 eq. of TBACN resembles the spectrum of reference 3, however, with an additional band at 2112 cm−1. This indicates that unlike the clean 1 → 2 conversion, the subsequent 2 → 3 reaction probably competes with some other processes. All reactions are likely completed after 4 eq. of TBACN are added, since further addition of TBACN (5 and 6 eq.) results in the appearance of satellites of unreacted TBACN salt.
Mass spectrometry
Reaction of 1 with TBACN has been further elucidated by electrospray ionization mass spectrometry (ESI-MS). The composition and structures of the ions were confirmed by isotope pattern analysis and MS/MS. Positive ion mode MS of the solution of native 1 reveals two parent ions: Co(diox)(stypy)2+ and Co(diox)2(stypy)+, at m/z 641 and 680, respectively, which is in agreement with our previous studies on this system.12 Positive ion mode MS performed on a solution of 1 with 0.5 eq. of TBACN reveals the disappearance of the parent signals and the appearance of Co(diox)(stypy)(CN)3(TBA)2+ at m/z 1022 (Fig. 7). With 1 eq. of TBACN, a new signal at m/z 1109 appears, which corresponds to the tetracyanido species 3. Additionally, a very intense signal for TBA+ was observed for all solutions with TBACN.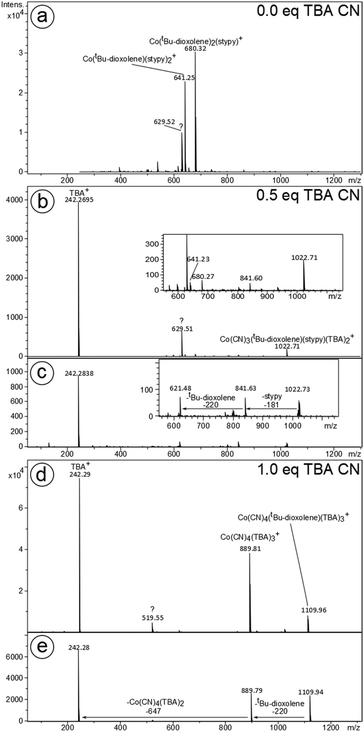 | ||
| Fig. 7 Positive ion mode MS of 1 with (a) 0.0, (b) 0.5 and (d) 1.0 eq. of TBACN and the MS/MS of the ions with (c) m/z 1022 and (e) m/z 1109. | ||
The positive-ion mode spectra obtained for the reference species (TBA)2[Co(tBu-dioxolene)(CN)4] (3) is remarkably similar to the experimental results for 1 with 1.0 eq. of TBACN (Fig. S30†). This suggests the complete conversion of postulated labile species 2 into thermodynamically stable 3 during the ESI process. This is also in agreement with our numerous unsuccessful attempts to isolate 2 (see the Experimental section): all attempts resulted in a change of color and isolation of 3 only.
The analysis of the reaction mixture in the negative ion mode was, unfortunately, not particularly informative. The solutions of 1 with 0.5 eq. of TBACN did not yield any major signals that can be attributed to cobalt-containing ions (Fig. S31†). With 1 eq. of TBACN, a set of singly charged cobalt species with 1 to 4 cyanido ligands have been detected at relatively low intensities (Fig. S32†). As in the positive ion mode, no cobalt species containing stypy ligands have been detected, which might suggest complete displacement of stypy ligands in 1 upon reaction with 1 eq. of TBACN. Thus, in situ formed 2 is more likely a five-coordinate (TBA)[ls-CoII(SQ˙−)2(CN)] 2five and less likely a six-coordinate analog (TBA)[ls-CoII(SQ˙−)2(CN)(stypy)] 2six.
Note that certain biases and restrictions of ESI-MS should be considered: (1) only charged species can be detected, (2) the formation of charge carriers occurs through a dynamic electrospray process, which does not necessarily reflect equilibria in solution. Moreover, the solutions used for ESI-MS have to be much more dilute compared to those studied by other methods, which makes comparing ESI-MS results with other methods difficult.
Theoretical calculations
In further attempts to determine whether 2 is a five- or six-coordinate species, spin energetics of these and reference systems have been examined by density functional theory (DFT) calculations. Three spin states: S = 1/2, 3/2, and 5/2 have been calculated for each species. Calculated energy differences between spin states in VT compounds (Δ, which are obviously small values) are not particularly reliable, since those values are highly dependent on the computational method.32,36,37 Therefore, we generally prefer to analyze the changes in energy differences, i.e. ΔΔ, which should be more reliable.12Upon substitution of one stypy ligand in 1 with the CN− anion as in a hypothetical six-coordinate 2six, both S = 5/2 and S = 3/2 states become destabilized relative to the S = 1/2 state by 8.9 and 2.6 kcal mol−1, respectively (Fig. 8, see the ESI† for details). Since 1 shows a VT equilibrium between S = 1/2 and S = 5/2 states and no evidence for the population of the S = 3/2 intermediate spin state is available,32 the stabilization of the S = 1/2 state over all other states in 2six makes the thermal population of the S = 3/2 state, i.e. ls-CoII(SQ˙−)2, in the hypothetical 2six unlikely.
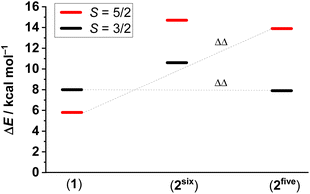 | ||
| Fig. 8 Relative energy differences between the S = 1/2 state (set as zero for each species) and the states of higher multiplicity: OPBE-DFT + zero-point energy and thermal energy corrections, see the Experimental section and ESI† for further details. | ||
However, when the given substitution is accompanied by the loss of the second stypy ligand, thus giving a five-coordinate species 2five, the S = 5/2 state becomes similarly destabilized by 8.1 kcal mol−1, but the S = 3/2 state becomes stabilized by 0.1 kcal mol−1. Obviously, the stabilization of the S = 3/2 state is nearly negligible. However, the destabilization of the S = 5/2 state together with the nearly unchanged (small) relative energy of the S = 3/2 state might provide exactly the mechanism for accessing the unique S = 3/2 state observed experimentally for 2. Thus, our calculations suggest that 2 is likely a five-coordinate species (TBA)[ls-CoII(SQ˙−)2(CN)], i.e.2five. This can also be expected, since the already weak Co–stypy bond in 1![[thin space (1/6-em)]](https://www.rsc.org/images/entities/char_2009.gif) 17 should be weakened further by the trans-effect of a newly introduced cyanido ligand in 2.31
17 should be weakened further by the trans-effect of a newly introduced cyanido ligand in 2.31
For consistency, we calculated the spin energetics for [ls-CoIII(SQ˙−)(CN)4]2− species 3. Strong destabilization of both S = 5/2 and 3/2 states by 60.5 and 23.4 kcal mol−1, respectively, implies that only the S = 1/2 state should be thermally accessible here, which is also observed experimentally (Fig. S16†).
Further confirmations are obtained using time-dependent DFT calculations. Thus, we have calculated electronic absorption spectra for parent 1 (S = 1/2, 5/2), postulated 2five (S = 3/2 and 1/2), and reference species 3 (S = 1/2) (see the ESI†). Furthermore, we simulated the changes in the calculated absorption spectra upon reaction 1 → 2five and subsequently 2five → 3. The evolution of calculated absorption spectra (Fig. 9 and 10) seems to be surprisingly similar to the changes observed experimentally (Fig. 1).
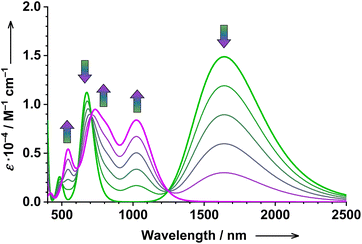 | ||
| Fig. 9 Simulated titration of 1 with TBACN (0…1 eq.): the evolution of the calculated electronic absorption spectrum upon the conversion of parent 1 (in green) to the postulated 2five (in purple). Method: TD-DFT, B3LYP, 1 = 37% ls-CoIII(SQ˙−)(Cat2−) + 63% hs-CoII(SQ˙−)2, and 2five = ls-CoII(SQ˙−)2, see the ESI† for further details. | ||
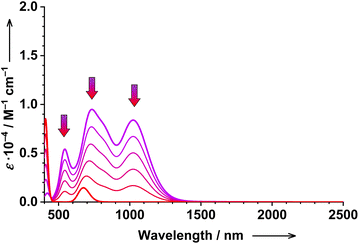 | ||
| Fig. 10 Simulated titration of 1 with TBACN (1…4 eqs.): the evolution of the calculated electronic absorption spectrum upon the conversion of the postulated 2five (in purple) to tetracyanido species 3. Method: TD-DFT, B3LYP, 2five = ls-CoII(SQ˙−)2, and 3 = ls-CoIII(SQ˙−), see the ESI† for further details. | ||
Upon the first reaction (1 → 2five), the broad intense LLIVCT band of 1 at 1641 nm vanishes, whereas absorption in visible and NIR regions increases significantly, showing the development of three well-defined bands at 1030, 734, and 543 nm (Fig. 9). A similar pattern can be seen in the experimental data (Fig. 1). By taking into account the fact that 1 is also partially dissociated in solution at room temperature17 as well as the spectral signature of this dissociated species, the agreement between the theory and experiment becomes even better (Fig. S51†).
Our calculations confirm that the broad absorption of 1 in the SWIR region is indeed an LLIVCT band, which is trivial (see Fig. S42† for molecular orbitals). Furthermore, we can also probe the nature of the prominent absorption bands of 2five, which unsurprisingly show strong charge transfer character (see the ESI†).
Upon the second reaction (2five → 3), the absorption in the visible and NIR region decreases significantly at nearly all wavelengths except for the 400 nm region (Fig. 10). Exactly the same pattern is observed experimentally (Fig. 1). Thus, 2five is a much stronger chromophore than end-product 3, which is responsible for (may be suspicious at first sight, but now confirmed using calculations) the decrease of absorption at nearly all monitored wavelengths.
Mechanism of formation of 2
After the combined theoretical–experimental studies altogether suggest that complex 2 is a five-coordinate species [Co(diox)2(CN)]1−, we can propose a very simple and obvious mechanism for its formation. Note, that parent 1 is partially dissociated in solution, since the monodentate stypy ligand is weakly bound to the cobalt center.17 Thus, the exact composition of the solution of 1 is an intact six-coordinate [Co(diox)2(stypy)2] in ls-CoIII(SQ˙−)(Cat2−) and hs-CoII(SQ˙−)2 states, and a five-coordinate [Co(diox)2(stypy)] in the hs-CoII(SQ˙−)2 state.17 Obviously, cyanide will first of all bind to the free coordination site in the five-coordinate [Co(diox)2(stypy)]. The already weak bond between stypy and Co will be further weakened by the introduced cyanide, resulting in the dissociation of the last stypy ligand. The consumption of the five-coordinate [Co(diox)2(stypy)] in the reaction with cyanides is then compensated by the dissociation of the parent complex 1, thus producing more five-coordinate species ready for reaction with cyanide. It might be interesting to support this plausible mechanism with, for instance, some kinetic studies, which is however beyond the scope of the current work.Finally, we would like to note that since all used methods confirm very strong binding of cyanide to 1 (at least the first eq.), thermally driven coordination/decoordination of cyanide in 2 can be safely excluded. However, the possibility of thermally driven coordination/decoordination of stypy ligands in the solution of 2 is difficult to exclude. Thus, the question whether the observed ls-CoII(SQ˙−) ⇌ ls-CoIII(Cat2−) VT transition is of pure molecular origin or (partially?) due to possibly coordinating stypy ligands remains open. In this context, we would like to mention that in a closely related recent publication by Krüger, a similar VT transition is of pure molecular origin.13
Conclusions
Upon titration of 1 with cyanido ligands, the formation of a new species 2 with 1 eq. of the cyanido ligand has been detected. The intriguing species 2 seems to be stable only in solution, which prevents us from its isolation as a solid material. Therefore, sophisticated experimental studies have been performed exclusively on solutions of in situ generated 2. These were supported by theoretical investigations. Relying on a combination of spectroscopic and magnetic studies and using reference materials, we suggest that 2 has a unique ls-CoII(SQ˙−)2 electronic structure. Although the molecular structure of 2 remains undetermined due to its lability, general considerations supported by theoretical calculations suggest that 2 is likely a five-coordinate species with one cyanido ligand attached. Species 2 reveals an extremely rare thermally-driven valence tautomeric transition between two low-spin cobalt redox-isomers: ls-CoII(SQ˙−)2 and ls-CoIII(SQ˙−)(Cat2−). A very similar thermal transition between ls-CoII(SQ˙−) and ls-CoIII(Cat2−) in a series of cobalt mono-dioxolenes has been just suggested by Krüger et al.,13 which indirectly support the correctness of our assignment of electronic states in our cobalt bis-dioxolene species 2.Conflicts of interest
There are no conflicts to declare.Acknowledgements
Dominik Fehn and Eva Körber are acknowledged for assistance with EPR measurements. A. S. thanks Prof. Karsten Meyer and the German Federal Ministry of Education and Research (BMBF Grants 03SF0502 and 03HY105I). M. M. K. thanks FAU Erlangen-Nürnberg and Prof. Karsten Meyer for providing access to spectroscopy facilities and continuous support. Prof. Hans-Jörg Krüger is acknowledged for a useful suggestion regarding EPR spectroscopy. The work was financially supported by Deutsche Forschungsgemeinschaft (DFG Research Grants KH 279/6-1 and 279/8-1). In memory of the late Dr. Eckhard Bill.References
- R. M. Buchanan and C. G. Pierpont, J. Am. Chem. Soc., 1980, 102, 4951–4957 CrossRef CAS
.
- D. N. Hendrickson and C. G. Pierpont, Top. Curr. Chem., 2004, 234, 63–95 CrossRef CAS
.
- V. L. Nadurata and C. Boskovic, Inorg. Chem. Front., 2021, 8, 1840–1864 RSC
.
- O. Drath and C. Boskovic, Coord. Chem. Rev., 2018, 375, 256–266 CrossRef CAS
.
- A. A. Starikova and V. I. Minkin, Russ. Chem. Rev., 2018, 87, 1049–1079 CrossRef CAS
.
- N. A. Vázquez-Mera, F. Novio, C. Roscini, C. Bellacanzone, M. Guardingo, J. Hernando and D. Ruiz-Molina, J. Mater. Chem. C, 2016, 4, 5879–5889 RSC
.
- O. Sato, A. L. Cui, R. Matsuda, J. Tao and S. Hayami, Acc. Chem. Res., 2007, 40, 361–369 CrossRef CAS PubMed
.
- A. Rajput, A. K. Sharma, S. K. Barman, A. Saha and R. Mukherjee, Coord. Chem. Rev., 2020, 414, 213240 CrossRef CAS
.
- E. Coronado, Nat. Rev. Mater., 2020, 5, 87–104 CrossRef
.
- M. M. Paquette, D. Plaul, A. Kurimoto, B. O. Patrick and N. L. Frank, J. Am. Chem. Soc., 2018, 140, 14990–15000 CrossRef CAS PubMed
.
- M. Graf, G. Wolmershäuser, H. Kelm, S. Demeschko, F. Meyer and H.-J. Krüger, Angew. Chem., Int. Ed., 2010, 49, 950–953 CrossRef CAS PubMed
.
- M. Mörtel, J. Oschwald, A. Scheurer, T. Drewello and M. M. Khusniyarov, Inorg. Chem., 2021, 60, 14230–14237 CrossRef PubMed
.
- C. Metzger, R. Dolai, S. Reh, H. Kelm, M. Schmitz, B. Oelkers, M. Sawall, K. Neymeyr and H.-J. Krüger, Chem. – Eur. J., 2023, 29, e202300091 CrossRef CAS PubMed
.
- M. Mörtel, J. Oschwald, A. Scheurer, T. Drewello and M. M. Khusniyarov, ChemRxiv, 10.04.2023, DOI:10.26434/chemrxiv-2023-wljnv.
- R. M. Buchanan, B. J. Fitzgerald and C. G. Pierpont, Inorg. Chem., 1979, 18, 3439–3444 CrossRef CAS
.
- S. Arzberger, J. Soper, O. P. Anderson, A. la Cour and M. Wicholas, Inorg. Chem., 1999, 38, 757–761 CrossRef CAS PubMed
.
- A. Witt, F. W. Heinemann and M. M. Khusniyarov, Chem. Sci., 2015, 6, 4599–4609 RSC
.
-
O. Kahn, Molecular Magnetism, VCH Publishers, New York, 1993 Search PubMed
.
- R. D. Schmidt, D. A. Shultz, J. D. Martin and P. D. Boyle, J. Am. Chem. Soc., 2010, 132, 6261–6273 CrossRef CAS PubMed
.
-
F. Neese, ORCA 5.0.2 - Ab Initio, DFT and semiempirical electronic structure package, Max-Planck-Institut für Kohlenforschung, Mülheim/Ruhr, Germany Search PubMed
.
- M. Swart, A. W. Ehlers and K. Lammertsma, Mol. Phys., 2004, 102, 2467–2474 CrossRef CAS
.
- M. Swart, A. R. Groenhof, A. W. Ehlers and K. Lammertsma, J. Phys. Chem. A, 2004, 108, 5479–5483 CrossRef CAS
.
- F. Weigend and R. Ahlrichs, Phys. Chem. Chem. Phys., 2005, 7, 3297–3305 RSC
.
- F. Weigend, Phys. Chem. Chem. Phys., 2006, 8, 1057–1065 RSC
.
- V. Barone and M. Cossi, J. Phys. Chem. A, 1998, 102, 1995–2001 CrossRef CAS
.
- C. T. Lee, W. T. Yang and R. G. Parr, Phys. Rev. B: Condens. Matter Mater. Phys., 1988, 37, 785–789 CrossRef CAS PubMed
.
- A. D. Becke, J. Chem. Phys., 1993, 98, 5648–5652 CrossRef CAS
.
-
S. Portmann, Molekel, version 4.3.win32, CSCS/UNI Geneva, Switzerland, 2002 Search PubMed
.
- O.-S. Jung and C. G. Pierpont, Inorg. Chem., 1994, 33, 2227–2235 CrossRef CAS
.
- F. R. Hartley, Chem. Soc. Rev., 1973, 2, 163–179 RSC
.
- B. J. Coe and S. J. Glenwright, Coord. Chem. Rev., 2000, 203, 5–80 CrossRef CAS
.
- A. Witt, F. W. Heinemann, S. Sproules and M. M. Khusniyarov, Chem. – Eur. J., 2014, 20, 11149–11162 CrossRef CAS PubMed
.
- M. Mörtel, M. Seller, F. W. Heinemann and M. M. Khusniyarov, Dalton Trans., 2020, 49, 17532–17536 RSC
.
- D. M. Adams and D. N. Hendrickson, J. Am. Chem. Soc., 1996, 118, 11515–11528 CrossRef CAS
.
- Y. Mulyana, G. Poneti, B. Moubaraki, K. S. Murray, B. F. Abrahams, L. Sorace and C. Boskovic, Dalton Trans., 2010, 39, 4757–4767 RSC
.
- J. T. Janetzki, F. Z. M. Zahir, R. W. Gable, W. Phonsri, K. S. Murray, L. Goerigk and C. Boskovic, Inorg. Chem., 2021, 60, 14475–14487 CrossRef CAS PubMed
.
- A. A. Starikova, M. G. Chegerev, A. G. Starikov and V. I. Minkin, Russ. J. Coord. Chem., 2022, 48, 233–241 CrossRef CAS
.
Footnote |
| † Electronic supplementary information (ESI) available: General experimental methods, computational details and additional spectroscopy data. See DOI: https://doi.org/10.1039/d3dt03935h |
| This journal is © The Royal Society of Chemistry 2024 |

