 Open Access Article
Creative Commons Attribution 3.0 Unported Licence
Spin crossover in dinuclear iron(II) complexes bridged by bis-bipyridine ligands: dimer effects on electronic structure, spectroscopic properties and spin-state switching†
Clara
Trommer
a,
Eike
Kuhlemann
a,
Tobias A.
Engesser
 a,
Marcel
Walter
b,
Sangeeta
Thakur
 b,
Wolfgang
Kuch
 *b and
Felix
Tuczek
 *a
*a
aInstitut für Anorganische Chemie, Christian-Albrechts-Universität zu Kiel, Max-Eyth-Straße 2, D-24118 Kiel, Germany. E-mail: ftuczek@ac.uni-kiel.de
bInstitut für Experimentalphysik, Freie Universität Berlin, Arnimallee 14, D-14195 Berlin, Germany. E-mail: kuch@physik.fu-berlin.de
First published on 23rd May 2024
Abstract
Inspired by the well-studied mononuclear spin crossover compound [Fe(H2B(pz)2)2(bipy)], the bipyridine-based bisbidentate ligands 1,2-di(2,2′-bipyridin-5-yl)ethyne (ac(bipy)2) and 1,4-di(2,2′-bipyridine-5-yl)-3,5-dimethoxybenzene (Ph(OMe)2(bipy)2) are used to bridge two [Fe(H2B(pz)2)2] units, leading to the charge-neutral dinuclear iron(II) compounds [{Fe(H2B(pz)2)2}2 μ-(ac(bipy)2)] (1) and [{Fe(H2B(pz)2)2}2 μ-(Ph(OMe)2(bipy)2)] (2), respectively. The spin-crossover properties of these molecules are investigated by temperature-dependent PPMS measurements, Mössbauer, vibrational and UV/Vis spectroscopy as well as X-ray absorption spectroscopy. While compound 1 undergoes complete SCO with T1/2 = 125 K, an incomplete spin transition is observed for 2 with an inflection point at 152 K and a remaining high-spin fraction of 40% below 65 K. The spin transitions of the dinuclear compounds are also more gradual than for the parent compound [Fe(H2B(pz)2)2(bipy)]. This is attributed to steric hindrance between the molecules, limiting intermolecular interactions such as π–π-stacking.
Introduction
Spin crossover (SCO) is a phenomenon whereby the spin state of a 3d metal complex changes between the low spin (LS) and the high spin (HS) state, made possible by a suitable ligand field splitting. This process can be stimulated by, e.g., temperature, light or pressure.1,2 Iron(II) compounds constitute a major field in SCO research, switching between the diamagnetic LS state with S = 0 and the paramagnetic HS state with S = 2.1–3 During the spin transition not only magnetic, but also electronic and optical properties of the molecule change, making these compounds promising candidates for applications in electronic devices, switching units or sensors.4,5If cooperative effects are present, the SCO becomes abrupt and may show hysteresis and thereby bistability. This is in general the case when the SCO centres are subject to intra- or intermolecular interactions.6–8 Notably, SCO also goes along with a change in Fe–N bond length that may force surrounding SCO centres into the same spin state. This is an important source of cooperativity in mononuclear spin-crossover compounds.9–11 In addition, strong cooperative effects are observed in polynuclear compounds or coordination networks.8,12,13 Bistability as a result of cooperativity is of particular interest regarding possible applications.4,14 In order to obtain insight into the emergence of cooperative effects we envisaged the synthesis of polynuclear iron(II) SCO complexes having 2,2′-bipyridine as bridging unit for the build-up of a linear chain wherein each 2,2′-bipyridine coordinates a charge-neutral [Fe(H2B(pz)2)2] (pz = 1H-pyrazole) unit. We chose [Fe(H2B(pz)2)2] as building block because of the well-studied SCO properties of a large number of compounds having the constitution [Fe(H2B(pz)2)2(L)], L = 2,2′-bipyridine (bipy) or other diamine ligands. The parent complex [Fe(H2B(pz)2)2(bipy)] exhibits an abrupt SCO with T1/2 = 161 K as shown by magnetic measurements as well as UV/Vis and vibrational spectroscopy, also allowing studies on LIESST.15,16 This complex and a large group of related compounds have not only been extensively investigated as bulk material, but could also be deposited as thin films to study surface-induced effects on the SCO behaviour.16–25 In particular, the development of cooperativity in ultrathin layers of [Fe(H2B(pz)2)2(bipy)] on a graphite surface has recently been investigated. Interestingly, the abrupt spin transition of [Fe(H2B(pz)2)2(bipy)] becomes more gradual as the film thickness decreases, indicating that intermolecular interactions, specifically π–π stacking between the aromatic systems of the bipyridine units, contribute to enhanced cooperativity in the bulk material.19 These findings make it promising to develop polynuclear SCO complexes for studies on cooperative effects.
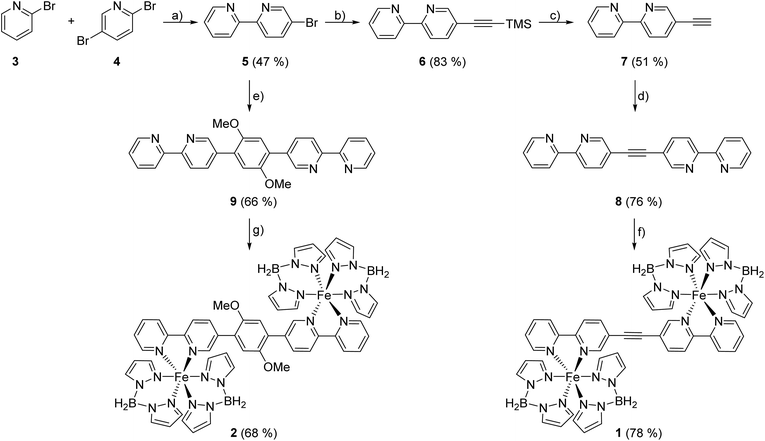
In the following, we describe the synthesis and characterization of the dinuclear SCO compounds [{Fe(H2B(pz)2)2}2 μ-(ac(bipy)2)] (1) and [{Fe(H2B(pz)2)2}2 μ-(Ph((OMe)2(bipy)2))] (2). In these systems the bipyridine units are connected either by an acetylene or a dimethoxyphenylene unit (Scheme 1). The chosen bridging ligands are synthetically well-established and commonly used for other metal centers like ruthenium.26–30 The SCO properties of 1 and 2 are investigated by PPMS measurements, Mössbauer spectroscopy and vibrational as well as UV/Vis spectroscopy, also allowing studies on the LIESST-effect for both compounds. Finally, the acetylene-bridged compound 1 is investigated by X-ray absorption spectroscopy.
Results and discussion
Syntheses and characterisation
The bisbidentate bridging ligands 1,2-di(2,2′-bipyridine-5-yl)-ethyne (8, ac(bipy)2) and 1,4-di(2,2′-bipyridine-5-yl)-3,5-dimethoxybenzene (9, Ph(OMe)2(bipy)2) are derived from 5-bromo-2,2′-bipyridine 5 which is synthesized by a Negishi cross-coupling reaction of 2,5-dibromopyridine (4) and 2-bromopyridine (3), following a general procedure of Luzung et al. for reactions of this type.31 Suzuki cross-coupling of 5 with 1,4-diiodo-2,5-dimethoxyphenol then leads to Ph(OMe)2(bipy)2 (9) while for synthesis of ac(bipy)2 (8) some more steps are needed. Following a modified procedure of Kim et al., bromobipyridine 5 is coupled with TMSA in a Sonogashira cross- coupling reaction to form 5-((trimethylsilyl)ethinyl)-2,2′-bipyridine (6) which is then deprotected to get the free acetylene 7, allowing Sonogashira cross-coupling with bromobipyridine 5 to give the desired acetylene-bridged bisbipyridine ligand 8 (Scheme 1).29 For preparation of the dinuclear complexes [Fe{(H2B(pz)2)2}2 μ-ac(bipy)2] (1) and [Fe{(H2B(pz)2)2}2 μ-Ph(OMe)2(bipy)2] (2) (displayed in Scheme 1, bottom) the precursor complex [Fe(H2B(pz)2)2(MeOH)2], the synthesis of which seems to need methanol as solvent,32 is prepared first, isolated and redissolved in tetrahydrofuran. Due to the poor solubility of the bridging ligands 8 and 9 in methanol they are added as solution (for 9) or suspension (for 8) in tetrahydrofuran.Both coordination compounds 1 and 2 form as green precipitates, whereby coordination of Ph(OMe)2(bipy)2 (9) seems to take longer than reaction with ac(bipy)2 (8). Hence, for 9 a longer reaction time is needed to get comparably good yields. This may originate from poorer coordination properties of this ligand due to steric hindrance of the methoxy groups.
The iron(II) compounds 1 and 2 have been characterized by elemental analysis (ESI†). Also, BH2 vibrations of the coordinated bispyrazolylborate in the IR spectra of 1 and 2 give strong evidence for the successful synthesis. On the other hand, 1 contains an acetylene group and therefore a perfect marker for vibrational spectroscopy. As expected for a molecule with a center of inversion, the symmetric stretching mode of the C![[triple bond, length as m-dash]](https://www.rsc.org/images/entities/char_e002.gif) C triple bond is not visible in the IR, but in the Raman spectrum, thus indicating the presence of a dinuclear complex (ESI, Fig. 1†).
C triple bond is not visible in the IR, but in the Raman spectrum, thus indicating the presence of a dinuclear complex (ESI, Fig. 1†).
Magnetic measurements
To investigate the magnetic properties of 1 and 2, PPMS measurements were performed. As shown in Fig. 1 complexes 1 and 2 exhibit χMT values of 6.74 cm3 K mol−1 and 5.99 cm3 K mol−1 at 300 K, respectively, which is in the expected range for dinuclear iron(II) complexes in the HS–HS state.33,34 The ethynyl-bridged bisbipyridine complex 1 shows a complete SCO (Fig. 1a). Upon lowering the temperature from 300 K, the transition starts at ca. 200 K and reaches a minimal χMT value of 0.35 cm3 K mol−1 at ca. 65 K. In contrast, 2 shows an incomplete SCO roughly between 270 K and 63 K, which is rather gradual and finishes at a minimum χMT value of ca. 2.5 cm3 K mol−1 (Fig. 1b). Below 20 K, both compounds exhibit a further decrease of χMT, likely due to zero-field splitting of the Fe(II) high spin ground state.21,35 Plotting the molar high spin fractions as a function of the temperature (Fig. 1c; black line) gives T1/2 = 125 K for 1. The incomplete SCO of 2 exhibits an inflection point at 152 K and ends at 42% high spin fraction below 65 K (Fig. 1c; dark grey line).Notably, the transition temperatures of the dinuclear compounds 1 and 2 are lower than for the related mononuclear complex [Fe(H2B(pz)2)2(bipy)], which shows T1/2 = 161 K (light grey line in Fig. 1c).15,16 This may be explained by a decreased nucleophilicity of the bisbipyridine ligands when coordinating two iron centres; i.e., the coordination of the first Fe(II) ion already withdraws electron density from the ligand, resulting in a weaker ligand field upon coordination of the second iron(II) center. Further, the dinuclear compounds 1 and 2 exhibit a more gradual and even incomplete SCO compared to the mononuclear parent compound [Fe(H2B(pz)2)2(bipy)]. This corresponds to a decrease of cooperative behaviour. Specifically, the π–π stacking between the aromatic systems of the bipyridine units, which contribute to enhanced cooperativity in the bulk material,19 might be hindered in the dinuclear compounds where the presence of two [Fe(H2B(pz)2)2] units in the dimers impedes closer packing.21,36
Mössbauer spectroscopy
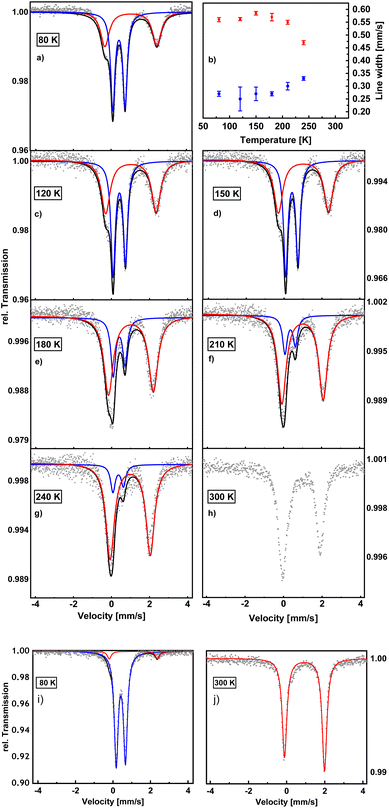
To complement the magnetic data, Mössbauer spectra of 1 and 2 were measured (Fig. 2). The spin-crossover behaviour of these compounds is clearly evident from the spectrum of 2 at 80 K which exhibits two doublets assignable to the HS and LS state (Fig. 2a). By contrast, the spectrum of 1 at 80 K (Fig. 2i) shows a dominant doublet typical for a Fe(II) LS–LS pair15 (δIS = 0.41 mm s−1; ΔEQ = 0.49 mm s−1) along with a low-intensity doublet (δIS = 1.08 mm s−1; ΔEQ = 2.56 mm s−1) from the remaining HS–HS fraction (6%). The 300 K spectrum of 1 (Fig. 2j) exhibits one doublet with a quadrupole splitting of ΔEQ = 2.10 mm s−1 and an isomer shift of δIS = 0.92 mm s−1, indicating the presence of a HS–HS pair. No subspectrum of the LS state is present, indicating γHS (1) = 1 at 300 K.The two doublets of the 80 K spectrum of 2 (Fig. 2a) have an intensity ratio of 43![[thin space (1/6-em)]](https://www.rsc.org/images/entities/char_2009.gif) :
:![[thin space (1/6-em)]](https://www.rsc.org/images/entities/char_2009.gif) 58 whereby the larger fraction corresponds to the LS (δIS = 0.42 mm s−1; ΔEQ = 0.65 mm s−1) and the smaller fraction to the HS state (δIS = 1.05 mm s−1; ΔEQ = 2.76 mm s−1). The slightly asymmetric appearance of both HS–HS doublets is caused by weak texture effects.15 More striking, however, is the fact that the line width of the HS doublet is much larger than for the LS state.
58 whereby the larger fraction corresponds to the LS (δIS = 0.42 mm s−1; ΔEQ = 0.65 mm s−1) and the smaller fraction to the HS state (δIS = 1.05 mm s−1; ΔEQ = 2.76 mm s−1). The slightly asymmetric appearance of both HS–HS doublets is caused by weak texture effects.15 More striking, however, is the fact that the line width of the HS doublet is much larger than for the LS state.
To investigate the temperature dependence of the linewidth, a series of spectra was measured for 2 at different temperatures between 300 K and 80 K. It turned out that the linewidths are more or less constant up to 200 K; i.e. no line-narrowing of the broad HS doublet occurs between 80 to 200 K (Fig. 2b; ESI Table 1†). This indicates that within this temperature range the broadening of the HS state is not due to relaxation, but rather represents an intrinsic property of this state. Above 200 K, the linewidth of the HS spectrum decreases and that of the LS spectrum increases, suggesting the onset of relaxation between HS and LS in this temperature range (see below).
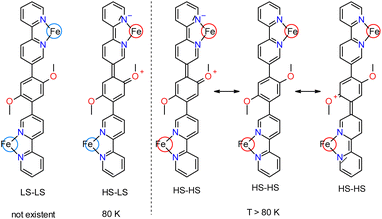
The magnetic and Mössbauer data can be interpreted by assuming that below 80 K compound 2 adopts a HS–LS configuration whereby one iron center is locked in the HS state. Presumably, the HS spectrum is broadened by mesomerism of the bridging dimethoxyphenylene group, distorting the ligand environment around the HS Fe-center, but leaving the ligand sphere of the LS center intact. In the HS–LS state present at 80 K, therefore, the LS-doublet is sharp, in contrast to the HS doublet (Scheme 2). If the temperature is increased, the LS center undergoes a spin transition to HS. In the formed HS–HS state, mesomerism from the dimethoxyphenylene group can now be directed into either one of the two HS iron centers, giving rise to a distortion of the ligand environment and corresponding line broadening of the respective HS iron center, whereas the geometry of the other HS iron center stays intact (Scheme 2). In a static limit the resulting Mössbauer spectrum therefore is a superposition of a broad and a narrow HS-doublet. There can be relaxation between the two configurations in that the distorted and undistorted iron sites dynamically exchange their position (cf.Scheme 2, right). However, as the linewidth of the HS state stays more or less constant between 80 and 200 K (see above), a situation is obviously not reached within this temperature range where rapid fluctuation leads to a time-averaged coordination environment of the two HS-centers, which would be evident from a line-narrowing with respect to a static low-temperature situation.
The 300 K Mössbauer spectrum of compound 2 (Fig. 2h) also shows a broad HS doublet, but now this doublet is markedly asymmetric (in contrast to the spectra at lower temperatures) and no distinct LS spectrum can be identified any more. As a matter of fact, this spectrum is typical of a situation where relaxation occurs between a (dominant) Fe(II) HS state and a residual Fe(II) LS-fraction on the Mössbauer time scale.37 Proper fitting of this spectrum requires the application of relaxation theory,37 which is not available to us. We therefore refrain from fitting this spectrum.
Integration of the doublets provides information on HS![[thin space (1/6-em)]](https://www.rsc.org/images/entities/char_2009.gif) :
:![[thin space (1/6-em)]](https://www.rsc.org/images/entities/char_2009.gif) LS ratio (cf. ESI†) and, thus, on the HS fraction. Due to the fact that no fit of the 300 K-spectrum is possible in the static limit, an estimate of γHS (2) at 300 K was obtained from a comparison of the corresponding magnetic susceptibilities of 1 and 2 and γHS (1) = 1 at 300 K (see above). Based on the χMT values of 6.74 cm3 K mol−1 for 1 and 5.99 cm3 K mol−1 for 2, it follows that γHS (2) = 0.89 at 300 K. The transition curves derived from Mössbauer spectroscopy and magnetic susceptibility measurements are compared in Fig. 3, showing overall agreement. Nevertheless, the thermal spin transition resulting from the Mössbauer data appears slightly steeper than that derived from the susceptibility data, and the inflection points of the corresponding curves differ by 4 K.
LS ratio (cf. ESI†) and, thus, on the HS fraction. Due to the fact that no fit of the 300 K-spectrum is possible in the static limit, an estimate of γHS (2) at 300 K was obtained from a comparison of the corresponding magnetic susceptibilities of 1 and 2 and γHS (1) = 1 at 300 K (see above). Based on the χMT values of 6.74 cm3 K mol−1 for 1 and 5.99 cm3 K mol−1 for 2, it follows that γHS (2) = 0.89 at 300 K. The transition curves derived from Mössbauer spectroscopy and magnetic susceptibility measurements are compared in Fig. 3, showing overall agreement. Nevertheless, the thermal spin transition resulting from the Mössbauer data appears slightly steeper than that derived from the susceptibility data, and the inflection points of the corresponding curves differ by 4 K.
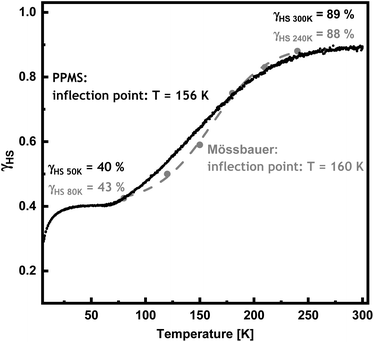 | ||
| Fig. 3 Temperature-dependent HS fraction of [{Fe(H2B(pz)2)2}2 μ-(Ph(OMe)2(bipy)2)] (2) derived from Mössbauer spectroscopy (grey dots with grey dashed line) and PPMS measurements (black). | ||
UV/Vis spectroscopy
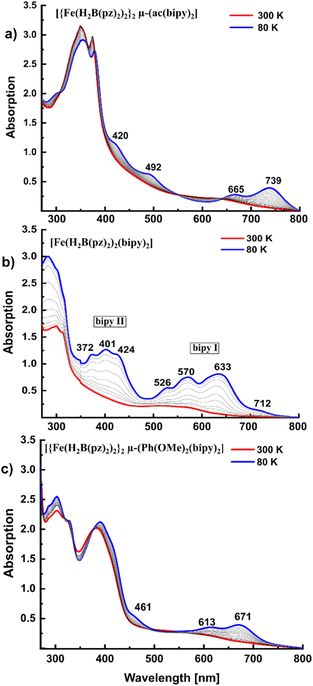
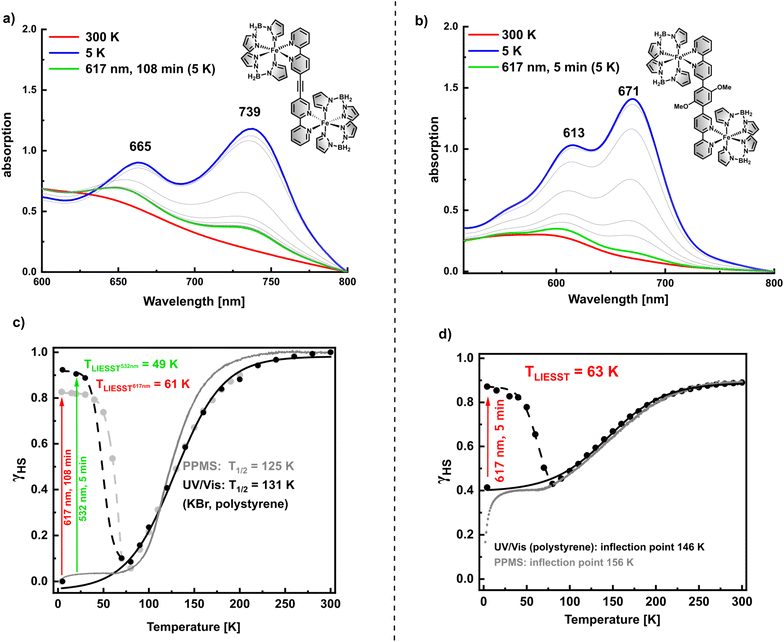
To obtain further insight into the electronic structures and the SCO properties of 1 and 2, both compounds were investigated by temperature-dependent UV/Vis spectroscopy. Fig. 4(a) shows UV/Vis spectra of 1 in KBr between 300 K and 80 K. The MLCT bands between 420 nm and 739 nm significantly increase in intensity upon cooling to 80 K, in agreement with the data obtained for the parent mononuclear complex [Fe(H2B(pz)2)2(bipy)] (Fig. 4b).16For 2 UV/Vis spectra could be obtained in KBr as well as in a polymer composite (polystyrene; cf. ESI†), which was not possible for 1 due to its poor solubility in any solvent. In both cases the 80 K spectra of 2 show significantly increased MLCT bands compared to the room temperature spectra (Fig. 4c), indicating SCO within this range. This is in good agreement with PPMS and Mössbauer data.
Temperature-dependent UV/Vis spectroscopy also allowed studies on the LIESST effect for 1 and 2. Illumination with 617 nm at 5 K induces population of the metastable HS state for both compounds (Fig. 5a and b). While absorption does not decrease anymore after 5 min for 2, it needs almost 2 h of illumination with 617 nm until conversion into the metastable high spin state is completed for 1. On the other hand, when illuminated with 532 nm, LIESST is complete after 5 min for 1 as well (cf. ESI Fig. 2†). This seems reasonable in view of the fact that LIESST proceeds through excitation in a MLCT state before relaxation into the HS state.38 There is no absorption band at 617 nm in the UV/Vis spectrum of 1 while 532 nm lies in the MCLT band with a first maximum at 492 nm (Fig. 4a).
For comparison with the magnetic susceptibility data of 1 the absorption at 739 nm was converted into molar high-spin fraction via the equation
 | (1) |
As shown by PPMS, SCO of 2 is incomplete at 5 K (see above). In order to get an impression of the spin transition obtained from UV/Vis spectroscopy, the absorption at 671 nm was converted into molar high spin fraction by eqn (1) employing γHS values of 0.43 at 80 K and 0.89 at 300 K (see above). Of course, there is no guarantee that SCO of compound 2 embedded in polystyrene exhibits the same γHSvs. T characteristics as the bulk material, but in this way LIESST efficiency can be approximately calculated and the UV/Vis and PPMS data become somewhat comparable.
As seen in Fig. 5d, LIESST also leads to a high-spin population of about 90% (532 nm). Thermal relaxation into the LS state proceeds at TLIESST = 61 K. The inflection point of thermal SCO at 148 K is quite close to the inflection point obtained from PPMS measurements with 152 K. TLIESST of the two dinuclear complexes 1 and 2 are close to values found for related mononuclear complexes [Fe(H2B(pz)2)2(L)] which are around 60 K.16,20,21
Notably, the MLCT bands of 1 and 2 are shifted by around 80–100 nm to lower energy compared to [Fe(H2B(pz)2)2(bipy)] (Fehler! Verweisquelle konnte nicht gefunden werden. b).16,18,21 By comparing the spectra of the dinuclear compounds 1 and 2 it can be seen that 1 shows absorption maxima at even higher wavelengths than 2. These shifts are explainable by considering the energies of the involved orbitals, in particular the bipyridine π* orbitals. As the bisbidentate bridging ligands have a significantly larger π-network and therefore a higher π-conjugation than one single bipyridine, lower lying π* orbitals are expected. Thus, the energy gap between metal and ligand π* orbitals is lower in the dinuclear compounds than in the mononuclear analogue and a shift of the MLCT bands to higher wavelengths is understandable.
The UV/vis spectrum of [Fe(bipy)3]2+ has intensively been studied by Gawelda et al.39 and others, explaining that it contains two sets of MLCT transitions into bipyridine orbitals around 350 nm (“bipy I”) and 500 nm (“bipy II”).40 The energy difference between these two bands roughly corresponds to the energy difference between the π* orbitals of bipyridine. Importantly, the UV/vis spectrum of [Fe(H2B(pz)2)2(bipy)] in the LS state is comparable to that of [Fe(bipy)3]2+, and the same band systems are observed (Fig. 4b). To identify the 3MLCT band centred around 520 nm, Gawelda et al. fitted the absorption spectrum of aqueous [Fe(bipy)3]2+ in the region of the 1MLCT band with a Franck–Condon progression of the high frequency skeleton mode of bipy at 1607 cm−1 (ν(C–N)/C–C), showing good agreement. For [Fe(H2B(pz)2)2(bipy)] this bipy skeleton mode is measured at an almost similar frequency (1595 cm−1),20,21,41 and the pattern is very similar to the 1MLCT transition in [Fe(bipy)3]2+. Additionally, the spectrum of [Fe(H2B(pz)2)2(bipy)] shows a shoulder at the low energy tail of the 1MLCT band (712 nm), which does not appear in the [Fe(bipy)3]2+ spectrum. Auböck et al. expect 3MLCT bands between 600 nm and 700 nm for [Fe(bipy)3]2+,40 so the shoulder at 712 nm could have its origin in a 3MLCT transition. In the better resolved 10 K spectrum there are even some bands visible in between the 1MLCT bands (555 nm, 607 nm, ESI Fig. 3†). Therefore, the bands centred around 570 nm are probably an overlap of progressions of 3MLCT and 1MLCT bands.
Vibrational spectroscopy
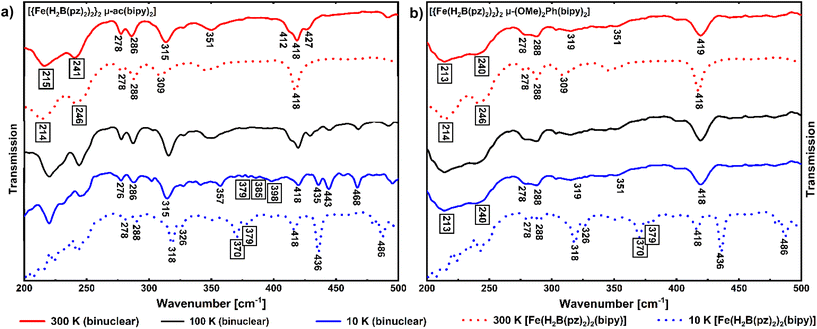
The Fe–N stretching modes should shift to higher wavenumbers from the HS to the LS state.42,43 That this is indeed the case has also been shown in studies of the parent complex [Fe(H2B(pz)2)2(bipy)] by comparing experimentally determined Fe–N stretching frequencies with theoretical ones. Thereby, characteristic HS bands have been identified at 214 cm−1 and 246 cm−1 as well as an intense band at 218 cm−1, whereas the LS spectra show Fe–N stretching vibrations at 370 cm−1 and 379 cm−1, along with less characteristic bands around 320 cm−1 and two intense bands at 436 cm−1 and 486 cm−1.35 Based on these data, a similar behavior of the dinuclear compounds 1 and 2 can be assumed, with spin-state-specific bands expected above 350 cm−1 in the spectrum for LS and below 250 cm−1 for HS. Indeed, the 300 K spectrum of compound 1 shows the same characteristic HS bands at 241 and 215 cm−1 (νas(Fe–N)) as reported for the mononuclear compound [Fe(H2B(pz)2)2(bipy)] in the HS state (Fig. 6a). Correspondingly, in the 10 K spectra, there are bands appearing in the region between 370 cm−1 and 400 cm−1 like in the mononuclear complex in the LS state.
While the spectra of compounds 1 and 2 and mononuclear [Fe(H2B(pz)2)2(bipy)] are nearly identical between 200 cm−1 and 350 cm−1, there are some differences at higher wavenumbers. e.g., due to more possible C–C vibrations in the bridging bisbipyridine ligand of the dinuclear compounds, the intense band at 418 cm−1 in the HS spectrum of [Fe(H2B(pz)2)2(bipy)] splits into three signals in the HS spectrum of 1 and develops into a broad signal for 2. Furthermore, a higher number of bands in the LS spectrum of 2 above 418 cm−1 is observed.
Resonance Raman
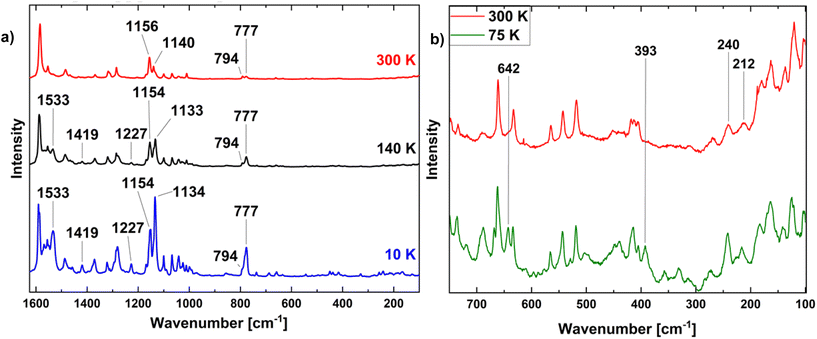
For further investigation of the vibrational characteristics, resonance Raman spectroscopy was applied.44,45 Based on its complete SCO behaviour, we focused on compound 1. Raman spectra recorded at 300, 140 and 10 K with an excitation wavelength of 532 nm are given in Fig. 7(a). The overview spectra primarily exhibit peaks in the region of intraligand modes whereas peaks below 750 cm−1 (which should be more sensitive to the spin state) are barely visible. Nevertheless, some spectroscopic changes can be observed, but these mainly correspond to variations of absolute or relative intensities. The latter, e.g., refers to the two peaks at 1140 and 1156 cm−1 (300 K) which shift to 1134 and 1154 cm−1 at 10 K. Conspicuously, also peaks at 777 and 1533 cm−1 become much more intense upon cooling, and new peaks at 1227 and 1429 cm−1 emerge.Magnification of the spectral region below 750 cm−1 is shown in Fig. 7(b) for 300 K (where HS should be present) and 75 K (where the LS should be dominant; additional data at 140 K and 10 K given in the ESI, Fig. 2†). Clearly, a peak at 393 cm−1 appears in the 75 K spectrum which is not present in the room-temperature spectrum. A peak at this position has been assigned to a Raman-active metal–ligand vibration of the LS state in [Fe(H2B(pz)2)2(phen)].46 Moreover, a new peak emerges at 642 cm−1 in the 75 K spectrum of 1; a peak at a similar position has been attributed to a LS vibration of [Fe(H2B(pz)2)2(phen)] as well.46 Comparing the 300 and 75 K spectra of compound 1, on the other hand, it is not easy to identify the Raman-active metal–ligand vibration(s) of the HS state which should appear between 200 and 250 cm−1 and vanish in the LS state (see above). The 10 K spectrum of 1, finally, contains peaks of the 300 K HS-spectrum (albeit with modified intensities) along with other peaks not present in the 300 K spectrum. It is probably affected by (at least partial) excitation of the molecules to the HS state through irradiation with the Raman laser (cf. ESI Fig. 4†).46 The presence of additional peaks might indicate a distortion of the complex at low temperatures. In the Raman spectra of 2 recorded at 300 K, 100 K and 10 K no significant differences can be identified (see ESI Fig. 5†). This, however, can be explained with the coexistence of both spin states at low temperatures, which is also indicated by the PPMS measurements (see above).
X-ray absorption spectroscopy
Compound 1 has further been examined by X-ray absorption spectroscopy (XAS). To determine the temperature-induced switching of 1, the sample was first cooled down to 10 K and heated up to 300 K again (Fig. 8a). The spectra in this Figure are recorded with the molecules in thermal equilibrium. The data reflect a spin-state switching of 1 by heating from 10 K to 300 K. The spectrum at 270 K with main peak at 706.5 eV shows primarily the HS state of the molecules, while at 50 K the main peak at 707.9 eV shows primarily the LS state of 1.22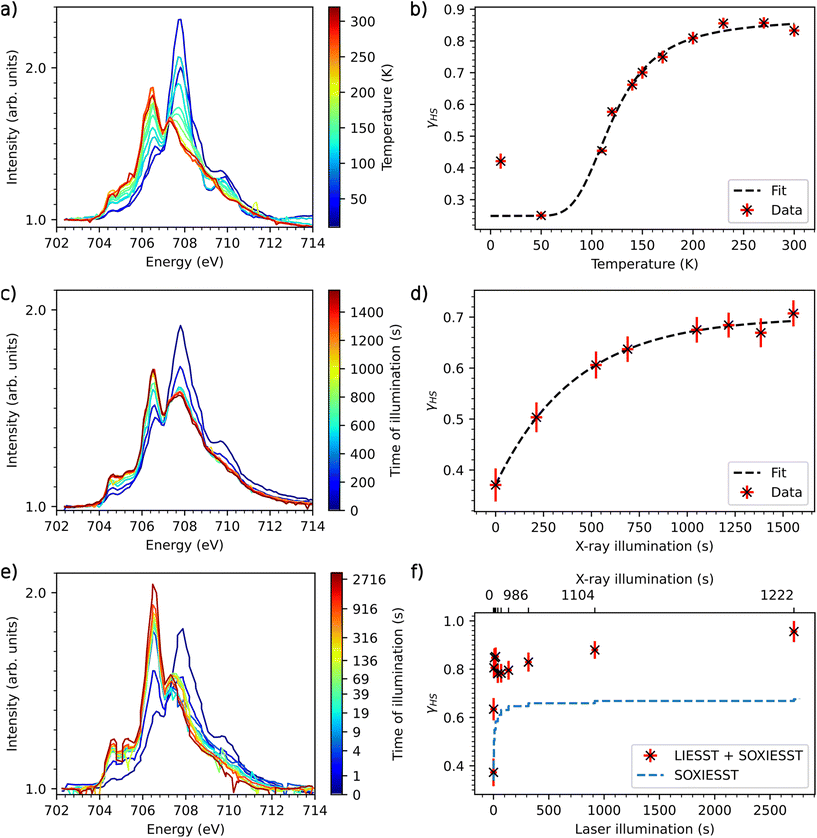 | ||
| Fig. 8 (a): XAS-spectra of 1, temperature-dependent measurement from 10 K to 300 K at the L3 edge of Fe. (b): γHS as function of temperature with fitted van't Hoff equation. (c) SOXIESST measurements at 10 K (d) γHS of 1 induced by X-ray illumination fitted with eqn (3). (e): XAS spectra of 1, LIESST measurements at a sample temperature of 10 K, illumination with 520 nm laser. (f): γHS light-induced at 10 K, SOXIESST overlay calculated using c, rx, k from SOXIESST and time of scan. | ||
A comparison of the XAS spectrum of 1 at 300 K with that of the parent mononuclear complex15 indicates that some fraction of molecules stays in the LS state. To calculate the HS fraction a least squares fit has been performed by taking the reference HS and LS spectra at 300 K and 75 K, respectively, of a 10 ML thin film of the mononuclear complex.19 The fit of the spectra at 300 K and 50 K shows that 87% of the complex is in the HS state at 300 K and around 25% of the complex is in the HS state at 50 K. Thus, 63% of the molecules are switching with temperature.
The high-spin fraction γHS for the thermal equilibrium between HS and LS can be calculated using the van't Hoff equation:9
| γHS = x + (1 − x)(exp(ΔH/RT − ΔS/R) + 1)−1 | (2) |
Notably, the thermodynamic parameters are similar to those of the parent molecule [Fe(H2B(pz)2)2(bipy)] with ΔH = 7.7 kJ mol−1, ΔS = 47.4 J K−1 mol−1 obtained by Moliner et al.15 This indicates that the interaction between the two iron centers is comparatively weak.
Importantly, the spectrum at 10 K reveals the SOXIESST effect (soft X-ray-induced excited spin-state trapping) on compound 1 which increases the HS fraction as compared to the 50 K spectrum.22 The increase in the γHS value below 80 K clearly indicates that the molecules are sensitive to X-rays. In order to quantify the rate for SOXIESST, compound 1 was measured at a sample temperature of 10 K under constant X-ray illumination (Fig. 8c). The illumination time is the accumulated scan time over the energy range of the Fe L3 edge. The data in Fig. 8d can be fitted with:
| γHS = c − exp(−tx × rx) × k | (3) |
Excitation to the LIESST state cannot be determined reliably because of the sensitivity of 1 to X-rays and the high flux of the beamline, the scanning time of ≈120 s per scan and the unknown SOXIESST relaxation rate at low temperatures. Qualitatively, however, it can be seen that the light-induced high-spin fraction comes close to 95% after about 2700 s while SOXIESST saturates at 69%, confirming that 1 is sensitive to photons with 520 nm wavelength. To obtain better data, further measurements with reduced X-ray flux will be carried out in our next possible beamtime experiment.
Conclusions
With the aim of analysing the effect of cooperativity, we connected two entities of the well-known and intensively examined complex [Fe(H2B(pz)2)2(bipy)] by two different linkers to obtain the dinuclear spin crossover (SCO) complexes [{Fe(H2B(pz)2)2}2μ-(ac(bipy)2)] (1) and [{Fe(H2B(pz)2)2}2μ-(Ph((OMe)2(bipy)2))] (2). The compounds and their spin-crossover properties were investigated through PPMS measurements, Mössbauer spectroscopy, vibrational as well as UV/Vis spectroscopy and X-ray absorption spectroscopy.Compound 1, bridged by an acetylene unit, exhibits a complete thermal SCO with a transition temperature (T1/2) of 125 K, while compound 2, with a bridging dimethoxyphenylene unit, shows an incomplete SCO with an inflection point at 152 K. The transition temperatures of these dinuclear compounds are lower than that of the mononuclear parent complex [Fe(H2B(pz)2)2(bipy)], suggesting a decreased of ligand-field strength of the terminal bipy units due to dimer formation.
Mössbauer spectroscopy confirms the presence of HS–HS pairs in both compounds at 300 K, with compound 2 also showing a small LS fraction. At 80 K, compound 1 exhibits a LS–LS state along with a minor HS–HS fraction, while compound 2 displays two doublets of comparable intensity corresponding to a HS–LS state. The observation of broad HS doublets in the Mössbauer spectra of 2 at all temperatures is attributed to a mesomeric (+M) effect of the dimethoxyphenylene group directed into one Fe(II) HS center.
UV/Vis spectroscopy provided further insights into the SCO properties of the compounds, showing an increased intensity of the MLCT bands at lower temperatures, consistent with the LS state. These results complemented the findings from PPMS and Mössbauer experiments, confirming the occurrence of SCO in the studied dinuclear compounds.
Far-infrared spectroscopy showed a shift of Fe–N stretching vibrations to higher wavenumbers at low temperatures for 1 while the spectra of 2 looked the same at all temperatures, also confirming the findings from PPMS measurements. The Raman spectra were less conclusive with respect to the presence of a spin transition. In any case, a peak at 393 cm−1 assignable to the low-spin state was detected for compound 1 at 75 K. Going to lower temperatures, the Raman spectra are probably affected by the LIESST effect, due to (at least partial) excitation to the metastable high-spin state in a thermal region where the low-spin state is expected.
Compound 1 was further examined by X-ray absorption spectroscopy (XAS), also showing a thermal SCO in bulk form. XAS studies on LIESST showed complete switching from LS to HS state at 10 K with light illumination, although there is significant contribution to the HS state due to the SOXIESST effect, which makes it challenging to determine the exact LIESST rate.
Overall, the data reflect a reduced cooperativity of the spin transitions exhibited by 1 and 2 with respect to the parent mononuclear complex [Fe(H2B(pz)2)2(bipy)]. While this may be surprising, it can be attributed to the steric hindrance, limiting closer packing and reducing intermolecular interactions such as π–π stacking which are important factors for the cooperative behaviour observed for the parent mononuclear complex.47
Conflicts of interest
There are no conflicts to declare.Acknowledgements
We gratefully acknowledge funding by the DFG under project numbers KU 1115/13-1 and TU 58/18-1.References
- P. Gütlich, A. Hauser and H. Spiering, Angew. Chem., Int. Ed. Engl., 1994, 33, 2024 CrossRef.
- P. Gütlich, A. B. Gaspar and Y. Garcia, Beilstein J. Org. Chem., 2013, 9, 342 CrossRef PubMed.
- J. A. Real, A. B. Gaspar and M. C. Muñoz, Dalton Trans., 2005, 34, 2062 RSC.
- O. Kahn and C. J. Martinez, Science, 1998, 279, 44 CrossRef CAS.
- E. Collet and P. Guionneau, C. R. Chim., 2018, 21, 1133 CrossRef CAS.
- J. A. Real, A. B. Gaspar, V. Niel and M. C. Muñoz, Coord. Chem. Rev., 2003, 236, 121 CrossRef CAS.
- K. S. Murray, Eur. J. Inorg. Chem., 2008, 2008, 3101–3121 CrossRef.
- J. R. Galán Mascarós, G. Aromí and M. Darawsheh, C. R. Chim., 2018, 21, 1209 CrossRef.
- A. Hauser, J. Jeftić, H. Romstedt, R. Hinek and H. Spiering, Coord. Chem. Rev., 1999, 190, 471 CrossRef.
- N. Willenbacher and H. Spiering, J. Phys. C: Solid State Phys., 1988, 21, 1423 CrossRef.
- H. Spiering, J. Linares and F. Varret, Phys. Rev. B: Condens. Matter Mater. Phys., 2004, 70, 184106 CrossRef.
- A. B. Gaspar, M. C. Muñoz and J. A. Real, J. Mater. Chem., 2006, 16, 2522 RSC.
- K. S. Murray and C. J. Kepert, Top. Curr. Chem., 2004, 233, 195 CrossRef CAS.
- O. Kahn, J. Kröber and C. Jay, Adv. Mater., 1992, 4, 718 CrossRef CAS.
- N. Moliner, L. Salmon, L. Capes, M. C. Muñoz, J.-F. Létard, A. Bousseksou, J.-P. Tuchagues, J. J. McGarvey, A. C. Dennis, M. Castro, R. Burriel and J. A. Real, J. Phys. Chem. B, 2002, 106, 4276 CrossRef CAS.
- H. Naggert, A. Bannwarth, S. Chemnitz, T. Von Hofe, E. Quandt and F. Tuczek, Dalton Trans., 2011, 40, 6364 RSC.
- S. Ossinger, H. Naggert, L. Kipgen, T. Jasper-Toennies, A. Rai, J. Rudnik, F. Nickel, L. M. Arruda, M. Bernien, W. Kuch, R. Berndt and F. Tuczek, J. Phys. Chem. C, 2017, 121, 1210 CrossRef CAS.
- M. Bernien, H. Naggert, L. M. Arruda, L. Kipgen, F. Nickel, J. Miguel, C. F. Hermanns, A. Krüger, D. Krüger, E. Schierle, E. Weschke, F. Tuczek and W. Kuch, ACS Nano, 2015, 9, 8960 CrossRef CAS PubMed.
- L. Kipgen, M. Bernien, S. Ossinger, F. Nickel, A. J. Britton, L. M. Arruda, H. Naggert, C. Luo, C. Lotze, H. Ryll, F. Radu, E. Schierle, E. Weschke, F. Tuczek and W. Kuch, Nat. Commun., 2018, 9, 2984 CrossRef PubMed.
- H. Naggert, J. Rudnik, L. Kipgen, M. Bernien, F. Nickel, L. M. Arruda, W. Kuch, C. Näther and F. Tuczek, J. Mater. Chem. C, 2015, 3, 7870 RSC.
- S. Ossinger, L. Kipgen, H. Naggert, M. Bernien, A. J. Britton, F. Nickel, L. M. Arruda, I. Kumberg, T. A. Engesser, E. Golias, C. Näther, F. Tuczek and W. Kuch, J. Phys.: Condens. Matter, 2020, 32, 114003 CrossRef CAS PubMed.
- L. Kipgen, M. Bernien, F. Nickel, H. Naggert, A. J. Britton, L. M. Arruda, E. Schierle, E. Weschke, F. Tuczek and W. Kuch, J. Phys.: Condens. Matter, 2017, 29, 394003 CrossRef PubMed.
- E. Ludwig, H. Naggert, M. Kalläne, S. Rohlf, E. Kröger, A. Bannwarth, A. Quer, K. Rossnagel, L. Kipp and F. Tuczek, Angew. Chem., Int. Ed., 2014, 53, 3019 CrossRef CAS PubMed.
- K. S. Kumar and M. Ruben, Angew. Chem., Int. Ed., 2021, 60, 7502 CrossRef CAS PubMed.
- V. Shalabaeva, S. Rat, M. D. Manrique-Juarez, A.-C. Bas, L. Vendier, L. Salmon and G. Molnár, J. Mater. Chem. C, 2017, 5, 4419 RSC.
- N. H. Damrauer, G. Cerullo, A. Yeh, T. R. Boussie, C. V. Shank and J. K. McCusker, Chemtracts, 1998, 11, 621 Search PubMed.
- V. Grosshenny, F. M. Romero and R. Ziessel, J. Org. Chem., 1997, 62, 1491 CrossRef CAS.
- Y. R. Choi, W. Lee, S. H. Yun, H. Lee, J. Tak, B. Park and B. H. Kim, Monatsh. Chem., 2017, 148, 2051 CrossRef CAS.
- M. Kim, C. H. Kang, S. Hong, W.-Y. Lee and B. H. Kim, Inorg. Chim. Acta, 2013, 395, 145 CrossRef CAS.
- N. Das, G. S. Bindra, A. Paul, J. G. Vos, M. Schulz and M. T. Pryce, Chem. – Eur. J., 2017, 23, 5330 CrossRef CAS PubMed.
- M. R. Luzung, J. S. Patel and J. Yin, J. Org. Chem., 2010, 75, 8330 CrossRef CAS PubMed.
- S. Ossinger, C. Näther and F. Tuczek, IUCrData, 2016, 1, x161252 CrossRef CAS.
- J. A. Real, I. Castro, A. Bousseksou, M. Verdaguer, R. Burriel, M. Castro, J. Linares and F. Varret, Inorg. Chem., 1997, 36, 455 CrossRef CAS.
- A. B. Gaspar, V. Ksenofontov, V. Martinez, M. C. Muñoz, J. A. Real and P. Gütlich, Eur. J. Inorg. Chem., 2004, 2004, 4770 CrossRef.
- S. Ossinger, H. Naggert, E. Bill, C. Näther and F. Tuczek, Inorg. Chem., 2019, 58, 12873 CrossRef CAS PubMed.
- S. Ossinger, C. Näther and F. Tuczek, J. Phys.: Condens. Matter, 2020, 32, 094001 CrossRef CAS PubMed.
- P. Adler, H. Spiering and P. Gütlich, Inorg. Chem., 1987, 26, 3845–3850 CrossRef.
- S. Decurtins, P. Gütlich, C. P. Köhler, H. Spiering and A. Hauser, Chem. Phys. Lett., 1984, 105, 1–4 CrossRef CAS.
- W. Gawelda, A. Cannizzo, V. T. Pham, F. Van Mourik, C. Bressler and M. Chergui, J. Am. Chem. Soc., 2007, 129, 8199 CrossRef CAS PubMed.
- G. Auböck and M. Chergui, Nat. Chem., 2015, 7, 629 CrossRef PubMed.
- J. A. Real, M. C. Muñoz, J. Faus and X. Solans, Inorg. Chem., 1997, 36, 3008 CrossRef CAS PubMed.
- J. H. Takemoto and B. Hutchinson, Inorg. Nucl. Chem. Lett., 1972, 8, 769 CrossRef CAS.
- J. H. Takemoto and B. Hutchinson, Inorg. Chem., 1973, 12, 705 CrossRef CAS.
- Z. G. Lada, Magnetochemistry, 2022, 8, 108 CrossRef CAS.
- C. Brady, P. L. Callaghan, Z. Ciunik, C. G. Coates, A. Døssing, A. Hazell, J. J. McGarvey, S. Schenker, H. Toftlund, A. X. Trautwein, H. Winkler and J. A. Wolny, Inorg. Chem., 2004, 43, 4289 CrossRef CAS PubMed.
- R. Sylvain, M. Mikolasek, J. Sánchez Costá, A. I. Chumakov, W. Nicolazzi, G. Molnár, L. Salmon and A. Bousseksou, Chem. Phys. Lett., 2016, 653, 131 CrossRef.
- S. Ossinger, C. Näther, A. Buchholz, M. Schmidtmann, S. Mangelsen, R. Beckhaus, W. Plass and F. Tuczek, Inorg. Chem., 2020, 59, 7966–7979 CrossRef CAS PubMed.
Footnote |
| † Electronic supplementary information (ESI) available: Including all experimental details and further spectroscopic information. See DOI: https://doi.org/10.1039/d4dt00707g |
| This journal is © The Royal Society of Chemistry 2024 |

