 Open Access Article
Creative Commons Attribution 3.0 Unported Licence
A combined theoretical and experimental approach to determine the right choice of co-ligand to impart spin crossover in Fe(II) complexes based on 1,3,4-oxadiazole ligands†
Sriram
Sundaresan
 a,
Julian
Eppelsheimer
a,
Esha
Gera
b,
Lukas
Wiener
a,
Luca M.
Carrella
a,
Julian
Eppelsheimer
a,
Esha
Gera
b,
Lukas
Wiener
a,
Luca M.
Carrella
 a,
Kuduva R.
Vignesh
 *b and
Eva
Rentschler
 *a
*a
aDepartment Chemie, Johannes-Gutenberg-Universität Mainz, Duesbergweg 10–14, 55128 Mainz, Germany. E-mail: rentschl@uni-mainz.de
bDepartment of Chemical Scienaces, Indian Institute of Science Education Research (IISER) Mohali, Sector-81, Knowledge City, S.A.S. Nagar, Mohali 140306, Punjab, India. E-mail: vigneshkuduvar@iisermohali.ac.in
First published on 30th May 2024
Abstract
We present the synthesis of two new novel tetradentate ligands based on 1,3,4-oxadiazole, 2-(2-pyridyl)-5-[N,N-bis(2-pyridylmethyl)aminomethyl]-1,3,4-oxadiazole (LTetraPy–ODA) and 2-(2-phenyl)-5-[N,N-bis(2-pyridylmethyl)aminomethyl]-1,3,4-oxadiazole (LTetraPh–ODA). The ligands were used to prepare six mononuclear complexes [FeII(LTetraPy–ODA)(NCE)] (C1–C3) and [FeII(LTetraPh–ODA)(NCE)] (C4–C6) where E = S, Se or BH3. In addition, the ligand LTetraPy–ODA was employed in the synthesis of a new di-nuclear complex [FeII2(LTetraPh)](ClO4)4·1 CH3NO2·1.5 H2O (C7). Characterization of all complexes was carried out using single-crystal X-ray crystallography, elemental analysis, and infrared spectroscopy. Magnetic susceptibility measurements, performed in the temperature range of 2–300 K using a SQUID magnetometer, revealed spin crossover behaviour exclusively in the mononuclear complexes C3 and C6, in which two monodentate NCBH3− co-ligands coordinate. The presence of the lattice solvent was found to be crucial to the spin transition property, with complex C3 exhibiting a switching temperature (T1/2) of approximately 165 K and C6 approximately 194 K. The other four mononuclear complexes C1, C2, C4, C5, as well as the dinuclear complex C7 are locked in the high spin state over the measured temperature range. Density Functional Theory (DFT) calculations were performed on complexes C1–C6 to rationalise the observed magnetic behaviour, demonstrating the significant effect of the NCS−, NCSe− and NCBH3− co-ligands ligands on the spin-crossover behaviour of the [FeII(L)(NCE)] complexes.
Introduction
Iron chemistry is captivating in many ways from its abundance on Earth in the form of iron oxides, to its significant role in biology, where iron ions are essential for oxygen or electron transport processes in metalloproteins.1,2 As scientists continue to explore its properties and applications, iron promises to remain a vital element in shaping our world. Its ready accessibility in the oxidation states +2 and +3, coupled with its ability to access higher oxidation states such as +6 and +7 through appropriate ligand selection, makes the iron ion an interesting candidate for diverse applications including catalysis and magnetism.3,4One particularly fascinating phenomenon exhibited by iron ions in oxidation states +2 and +3 is spin-crossover (SCO), where electrons undergo an internal rearrangement of the orbital occupation in response to the external stimuli, allowing the metal ion to switch between two states.5–8 This phenomenon, initially observed by Cambi and co-workers in Fe(III), has been more widely studied for Fe(II), due to the change in the electronic arrangement between a diamagnetic low spin state LS (S = 0) and a paramagnetic high spin state HS (S = 2).5,9,10 Spin crossover is also observed for other 3d metals such as Co(II), Mn(III) and Cr(II).11–14 This bi-stability makes these candidates promising for various applications such as sensors, memory and displays.15–19
Fe(II) complexes based on 1,3,4-oxadiazoles are rarely reported in the literature for spin crossover. Some of us reported the first dinuclear Fe(II) complex based on 1,3,4-oxadiazole and successfully investigated the effect of the counterion ions.20 In contrast, all attempts to further vary the ligand field strength by choosing different heterocyclic sidearms remained unsuccessful in observing the spin crossover behaviour. In all cases, the complex remained in the HS state irrespective of the counterions chosen.21 Klingele, Letard and co-workers in 2013 reported a mononuclear Fe(II) complex based on a bis-bidentate oxadiazole ligand and two NCS− co-ligands. However, the complex remained in the HS state over the measured temperature window.22 Later, in 2022, Herchel and co-workers further modified the bis-bidentate ligand to tune the ligand field strength and reported another mononuclear complex with two NCS− co-ligands. Unfortunately, this complex also remained in the HS state over the measured temperature window.23 Finally, some of us could recently report the first mononuclear Fe(II) spin crossover complex based on a tetradentate 1,3,4 oxadiazole ligand with two monodentate NCBH3− co-ligands [Fe(LTetra–ODA)(NCBH3)2]·1.5 CH3OH, where LTetra–ODA is the tetradentate 2-(naphthalen-2-yl)-5-[N,N-bis(2-pyridylmethyl)aminomethyl]-1,3,4-oxadiazole ligand.24 Given the extended pi system of the naphthalic substituent, which is known to be an antenna component in photoactive systems, the luminescence property of the complex, along with the synergistic effects of luminescence and spin crossover behaviour was investigated for this compound.24 In the present manuscript, the tetradentate binding pocket of the previously reported ligand is kept constant, but the naphthalene moiety of the previously reported analogue is changed to pyridine and phenyl to investigate in more detail the effect of it on the SCO behaviour. The incorporation of pyridine in the ligand backbone also facilitated the synthesis of a new dinuclear Fe(II) complex based on 1,3,4-oxadiazole. Finally, the effect of other NCE (E = S and Se) co-ligand in tuning the spin crossover behaviour is also explored in the current study.
Results and discussion
Ligand synthesis
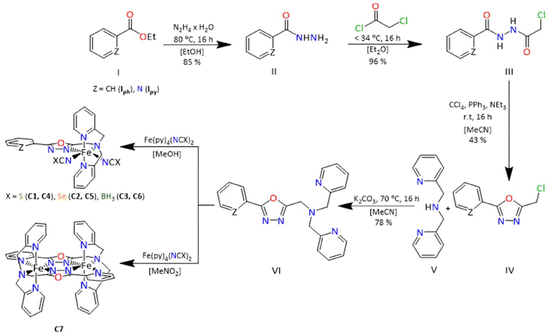
The two ligands 2-(2-pyridyl)-5-[N,N-bis(2-pyridylmethyl)aminomethyl]-1,3,4-oxadiazole (LTetraPy–ODA) and 2-phenyl-5-[N,N-bis(2-pyridylmethyl)aminomethyl]-1,3,4-oxadiazole (LTetraPh–ODA) were synthesised in high yields according to the ligand synthesis of LTetra–ODA, reported previously by some of us.24 The main modification to the procedure was the use of appropriate pyridine-2-carboxylic acid hydrazide in the case of LTetraPy–ODA and phenyl-2-carboxylic acid hydrazide in the case of LTetraPh–ODA (Scheme 1). Both ligands were obtained in high yields 67% and 78%. The ligands obtained in both cases are fully characterized by 1H NMR, 13C NMR, COSY, HSQC and HMBC, infrared spectroscopy (Fig. S1–S12†).Complex synthesis
All six mononuclear complexes C1–C6 were prepared in a glovebox due to the air sensitivity of the precursor complexes used in this synthesis. Complexes C1–C6 were prepared by dissolving equimolar ratios of the ligand with the corresponding NCE precursor complex in acetonitrile (C1–C6). Complex C7 is prepared under aerobic conditions by dissolving one equivalent of the ligand with two equivalents of Fe(ClO4)2 salt in nitromethane. The complexes in all seven cases are obtained as crystals suitable for X-ray diffraction. The X-ray data for all seven complexes were collected from single crystals carefully picked from the mother liquor, whereas magnetic data were collected from the pure bulk powder, which was filtered and dried in air unless otherwise indicated. In all the cases, the complexes obtained are air-stable and have been characterized using a range of techniques including X-ray crystallography, elemental analysis, and infrared spectroscopy (Fig. S13–18†). Detailed information on the synthesis of each complex is given in the experimental section.Structural description
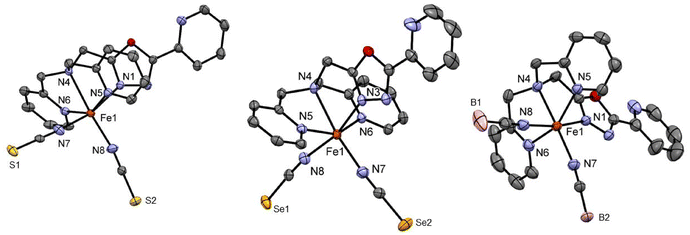
Complexes C1 and C2 both crystallise as yellow block-shaped single crystals from acetonitrile by slow evaporation. Crystallographic data was recorded at 120 K in both cases revealing that the complexes crystalise in the space group P21/c in a monoclinic crystal system with four formula units in the unit cell. Crystallographic data are given in Table S1.† The asymmetric unit comprises a complex molecule with one molecule of acetonitrile in the case of C1 (Fig. 1) and three acetonitrile in the case of C2 (Fig. 1). The average metal-to-ligand bond distance in both cases is around 2.18 Å which is in the typical range for HS Iron(II) from the literature.8,20,25,26 The octahedral distortion calculated for both complexes C1 and C2 are ΣO(FeN6) = 102.3° and ΣO(FeN6) = 100.3°, respectively. Both complexes exhibit π–π stacking between the aromatic rings of the 2-picolylamine sidearms of adjacent molecules. The interplanar distance ranges from 3.94 Å to 4.03 Å and the interplanar angle ranges from θ = 15.8° to 23.9° (Fig. S22–S24† for C1 and S27–32† for C2). The packing diagram of both C1 and C2 shows that due to the π-π stacking interaction between the aromatic rings, in both cases the complexes are packed in a 1-D chain-like structure along the b-axis. In the case of complex C2, a second π–π interaction is also observed between the pyridine bound to the oxadiazole and the 2-picolyl bound to the amine nitrogen of the neighbouring complex molecule by a T-shaped intramolecular interaction (Fig. S32†). This, in combination with the other π–π interaction (1-D chain formation), forms a cross-linked 2-D network in the case of C2 (Fig. S27†).
Complex C3 crystallises from acetonitrile in the space group C2/c with eight formula units per unit cell. The asymmetric unit comprises one molecule of the complex and one acetonitrile as in the case of C1 (Fig. 1). The molecule is completed via symmetry operations. The average central metal donor distances measured at 173 K are around 2.18 Å, indicating HS Fe(II).8,20,25,26 The crystallography parameters are tabulated in Table S2.† A low temperature structure measurement for complex C3 was not possible.
Complexes C4 and C5 formed from the LTetraPh–ODA ligand with NCS− and NCSe− co-ligands crystallised from acetonitrile in the C2/c space group in the monoclinic crystal system with eight formula units in the unit cell. The crystallographic data for both complexes and metal–ligand bond distances are tabulated in Table S3.† The asymmetric unit comprises one complex molecule with two solvent molecules. The X-ray crystallography data for both complexes are collected at 173 K (Fig. 2). The average metal-to-ligand bond distance is around 2.15 Å indicating the iron(II) to be in the HS state. The complex distortion from the ideal octahedral environment is calculated by the octahedral distortion parameter which is calculated for both complex C4 and C5 as 105.1° and 101°, respectively. Two different modes of π–π interactions are observed for complexes C4 and C5. Intramolecular interaction can be seen between two picoline rings of the two neighbouring molecules can be observed which in turn forms a 1-D chain along the b-axis similar to the case of the C2 discussed earlier (Fig. S37†). In addition to this, as seen in C2 and C3, the complexes show a 2-D network formed by π–π interactions.
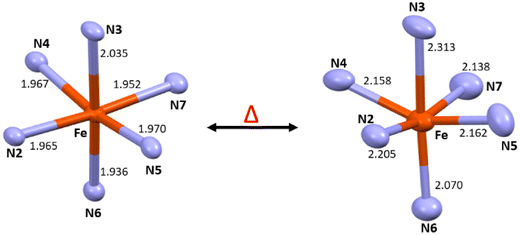
Complex C6 is isolated from acetonitrile in the form of block-shaped single crystals by slow evaporation. The X-ray crystallography data for the complex were collected at two different temperatures of 120 K and 240 K. The X-ray data revealed that the complex crystallised in the C2/c space group (Fig. 2). The crystallographic data, along with the bond length for both temperatures, are summarized in Table S4.† The average metal-to-ligand bond length at 120 K is around 1.97 Å vs. 2.18 Å at 220 K, as shown in Fig. 3. The changes in the bond length, as well as an increase in the cell volume by 7%, indicate the complex undergoes a spin transition. The π–π interaction is very similar to the analogous compounds C4 and C5, where a 1-D chain-like structure is formed along the c-axis, as well as the T-shape π–π interaction between two molecules can be found. It is worth noting that with the decrease in the volume at the lower temperature (120 K) the intermolecular distance became shorter. For example, the iron-iron distances in the 1-D chain along the c-axis are reduced from 13.191 Å to 12.271 Å by a change in the temperature (Fig. S48 and 49†).
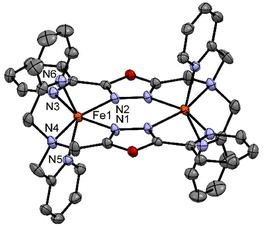 | ||
| Fig. 4 Crystal structure of the complex [FeII2(LTetraPy)](ClO4)4·CH3NO2·1.5 H2O at 150 K. Hydrogen atom and counter ions and solvent molecules are omitted for clarity. | ||
Similar distortions were observed in the earlier reported dimeric thiadiazole and oxadiazole-based iron(II) complexes.20,21,27,28
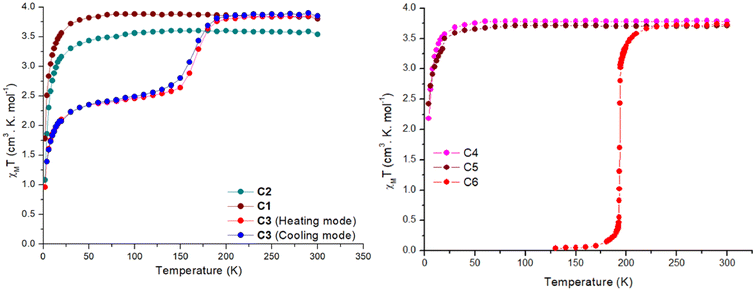 | ||
| Fig. 5 χ M T vs. T for complexes C1–C3 (left) C4–C6 (right). The dots are the data points, and the line is just a guide for the eye. | ||
In contrast, complexes C3 and C6 show a temperature-dependent spin crossover behaviour as can be seen in Fig. 5. Complex C3 shows an abrupt change in magnetic moment, expressed in χMT, around 165 K, while complex C6 abruptly changes its magnetic behaviour just below 200 K. When the magnetic data was collected in the cooling mode from 300–2 K in the polycrystalline air-dried sample, the χMT value remained constant at 3.85 cm3 mol−1 K until 200 K. Thereafter a drop in the χMT value to 2.68 cm3 mol−1 K at 140 K is seen. This behaviour can be attributed to an incomplete SCO where approximately only 50% of the sample is switched to the LS state. Further cooling below 40 K leads to a further sharp drop in the χMT value to 0.95 cm3 mol−1 K at 2 K, attributed to the combination of weak intermolecular dipolar interaction and zero-field splitting of the HS iron centre. Structural elucidation at low temperature of 100 K would have been very beneficial but unfortunately this was not possible. For the cooling mode the T1/2 is estimated to be 160 K. When the magnetic data was collected in the heating mode from 2–300 K the χMT-curve profile remained the same with a slight shift in the T1/2(up) to 170 K. This change in T1/2 shows a small thermal hysteresis of approximately 5 K centred around 165 K, as seen in Fig. 5.
The effect of the lattice solvent in tuning the spin transition temperature in the solid state is well investigated in the SCO literature.25,28,30 In many cases the spin transition is dependent on the presence of the lattice solvent, and when removed, the complex is locked in one spin state or the T1/2 of the complexes is shifted. In the case of the complex C3 the lattice solvent of the bulk is water. Since complex C3 exhibited an incomplete spin transition with a small hysteresis, the effect of the lattice solvent in tuning the spin transition temperature was investigated using a freshly prepared microcrystalline sample from the mother liquor (acetonitrile) with no exposure to air (Fig. S57†). The χMT data was first recorded in the cooling mode from 300–70 K, followed by 70–400 K, and then from 400–2 K. In the first cooling cycle, the χMT value stayed constant at 3.8 cm3 mol−1 K from 300–200 K with a sudden sharp decrease to 0.24 cm3 mol−1 K at 150 K. In the subsequent warming mode, the magnetic behaviour was unaltered until 400 K with a T1/2 of 165 K (Fig. S57†). However, when the lattice solvent acetonitrile was evaporated at 400 K and the sample was cooled to 2 K, the SCO behaviour of the complex was lost and complex C3 was locked in HS state over the measured temperature range until 30 K. A small rise in the χMT around 30 K is due to the crystal orientation effects at low temperature.
Complex C6 shows the spin transition, as indicated by bond length changes observed by variable temperature X-ray measurements. A T1/2 temperature of 194 K is estimated from the abrupt change in the magnetic moment upon lowering the temperature (Fig. 5). The lattice solvent of the bulk sample was water. To obtain the effects of the lattice solvent, a freshly prepared sample from the mother liquor with no exposure to air was used for the magnetic measurements. The χMT data were recorded in the temperature sequence 300–130–400–2 K. When measured in the cooling mode the χMT value at 300 K was 3.72 cm3 mol−1 K and remained constant down to 250 K. Below 250 K, a very abrupt drop in the magnetic moment to a value of 0.04 cm3 mol−1 K at 130 K was observed. The magnetic profile was the same when the data was recorded in the warming mode. However, after the lattice solvent acetonitrile was removed at 400 K, the complex was locked in HS over the measured temperature window (Fig. S56†).
Finally, the magnetic data collected for the complex C7 from 300–2 K revealed that the complex stays in the HS state over the entire measured temperature window (Fig. S58†). This was also shown by the temperature independent metal ligand bond distances for both iron centres as observed by X-ray crystallography. The χMT value for complex C7 at 300 K is 7.43 cm3 mol−1 K slightly decreasing to 7.26 cm3 mol−1 K at 40 K. Below 40 K a drop in the magnetic moment to 4.14 cm3 mol−1 K can be attributed to a combination the combination of weak intermolecular dipolar interaction and zero-field splitting as well as possible weak anti-ferro magnetic coupling effects between the iron centres.
By changing the naphthalene side group in the previously reported complex with the naphthalene ligand [Fe(LTetra–ODA)(NCBH3)2]·1.5 CH3OH to pyridine or phenyl groups, the T1/2 value of complexes C3 and C6 changed as expected. In the case of C3 with the pyridine ligand backbone, the T1/2 is around 165 K which is a change in T1/2 of about 42 K to lower temperatures. In the phenyl complex C6, which is a closer analogue to the previously reported naphthalene complex, the shift of T1/2 is only 13 K towards lower temperatures. The shift in the T1/2 indicates the tuning of the ligand field strength by choice of different aromatic rings.
In addition to the changes made to the ligand backbone, the co-ligands were varied. Besides the NCBH3− ligand the monodentate co-ligands NCSe− and NCS− were used to fine-tune the spin transition temperature. All NCE co-ligands are frequently studied in spin crossover research to tune the ligand field strength.25,26,31,32 Of these three monodentate co-ligands, NCS− has the strongest coordination ability with an index a™ of 1.6, as shown by Alvarez's careful data mining of the CCDC database. In comparison, NCSe− has 1.4 and NCBH3− has 1.0.33 The ligand field strength decreases with the increase in the coordination ability as nicely shown in the recent work by Cirera and Paesani.34 Unfortunately, in the present study, all complexes except C3 and C6 were invariant in the HS state over the measured temperature range regardless of the change in NCE ligands. The complex C3 and C6 showed solvent-dependent SCO behaviour as discussed earlier. The two other mononuclear complexes reported in the literature with 1,3,4-oxadiazole-based ligands stay in the HS state. In both cases the co-ligand was NCS−.22,23
From the current work and the previously reported [Fe(LTetra–ODA)(NCBH3)2]·1.5 CH3OH complex, it is clear that the 1,3,4-oxadiazole based ligand in combination with the NCBH3− co-ligand creates appropriate ligand field for the spin transition to occur.
It should be noted that comparisons with the previously reported naphthalene complex [Fe(LTetra–ODA)(NCBH3)2]·1.5 CH3OH and other literature complexes should be made with caution as it is well-known from the literature that the crystal packing effects play a key role in determining the spin transition temperature in the solid state.25,28,30 The role of the lattice solvent in spin crossover materials influences various aspects of the SCO behaviour including cooperative effects.24,25,28,30 Interactions between the solvent and the spin crossover complexes may facilitate or hinder the structural rearrangements required for spin state switching. Understanding and controlling these interactions are essential for the design and optimization of spin crossover materials. The previously reported [Fe(LTetra–ODA)(NCBH3)2]·1.5 CH3OH complex had methanol as the lattice solvent whereas the newly prepared analogues complexes C3 and C6 have acetonitrile as the lattice solvent. The crucial role of the lattice solvent in imparting the SCO behaviour in the solid state is also thoroughly investigated, since in both cases C3 and C6 the complexes lose their spin transition ability and are locked in the HS state, but in the analogues [Fe(LTetra–ODA)(NCBH3)2]·1.5 CH3OH complex reported earlier there is only a slight shift in the T1/2 from 207 to 210 K (the slight shift might also be due to residual solvent still present in the crystal lattice).24 The effect of ligand substituents and co-ligands in tuning the SCO behaviour is further probed by DFT calculations.
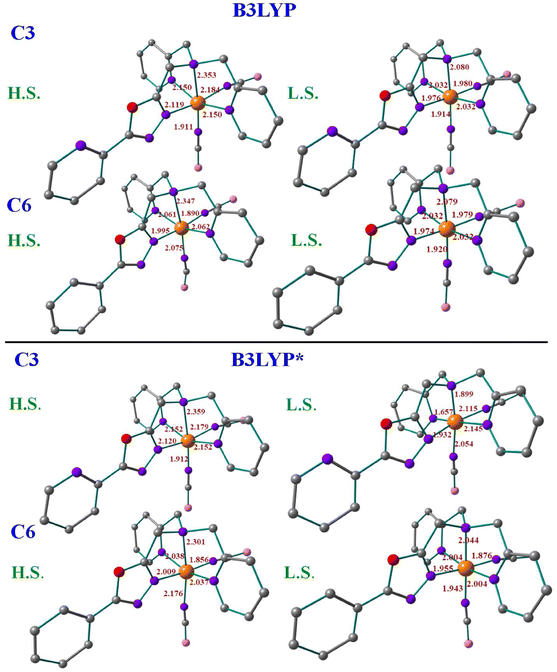
For the X-ray structures of complexes that were acquired at various temperatures, we did geometry optimization to understand the influence of spin-states on the geometrical parameters. It's important to clarify that optimised geometries are more symmetrical than X-ray structures. For instance, the optimised HS and LS structures are actually modelled at particular spin states, not the temperature-dependent ones. The DFT-optimised structures of C1–C6 using both B3LYP and B3LYP* hybrid functionals are shown in Fig. 6, S59 and S60† with some of the selected bond parameters of the first coordination environment. Tables 1 and S6† summarise the X-ray structural parameters and the computed structural parameters for C1–C6 using B3LYP* and B3LYP, respectively. The structural parameters of the optimized structures using both functionals are in good agreement with the X-ray structural parameters, especially the B3LYP computed parameters are much closer.37 The computed structural parameters of the high-spin (HS; S = 2) state of C1, C2, C4, and C5 are in close resemblance with the X-ray structural parameters, whereas the mix of both Low-spin (LS; S = 0) state and HS state parameters of C3 and C6 are matching with the X-ray structural parameters. This indicates that the complexes C1, C2, C4, and C5 possess the HS ground state (Fig. S61†) and are unlikely to show SCO behaviour, and the C3 and C6 complexes are likely to show SCO behaviour if the energy gap between HS–LS is going to be in the expected range of SCO behaviour.38 The computed bond parameters indicate how the distortion in the coordination sphere in the real structure is partly caused by solid-state processes.38
| Structural parameter | C1 | Structural parameter | C2 | Structural parameter | C3 | ||||||
|---|---|---|---|---|---|---|---|---|---|---|---|
| EXP | HS | LS | EXP | HS | LS | EXP | HS | LS | |||
| Fe–N1 | 2.227 | 2.129 | 1.966 | Fe–N3 | 2.204 | 2.133 | 1.964 | Fe–N1 | 2.217 | 2.120 | 1.932 |
| Fe–N4 | 2.295 | 2.321 | 2.066 | Fe–N4 | 2.311 | 2.369 | 2.065 | Fe–N4 | 2.281 | 2.359 | 1.899 |
| Fe–N5 | 2.220 | 2.161 | 2.011 | Fe–N5 | 2.170 | 2.167 | 2.013 | Fe–N5 | 2.163 | 2.152 | 1.657 |
| Fe–N6 | 2.204 | 2.039 | 1.859 | Fe–N6 | 2.176 | 2.166 | 2.013 | Fe–N6 | 2.173 | 2.152 | 2.145 |
| Fe–N7 | 2.101 | 2.161 | 2.011 | Fe–N7 | 2.062 | 1.891 | 1.896 | Fe–N7 | 2.071 | 1.912 | 2.054 |
| Fe–N8 | 2.030 | 1.954 | 1.880 | Fe–N8 | 2.105 | 2.195 | 1.881 | Fe–N8 | 2.137 | 2.179 | 2.115 |
| Angle N6–Fe–N8 | 97.94 | 96.08 | 97.80 | Angle N7–Fe–N8 | 95.41 | 95.01 | 91.38 | Angle N7–Fe–N8 | 92.97 | 93.08 | 92.45 |
| Structural parameter | C4 | Structural parameter | C5 | Structural parameter | C6 | ||||||
| EXP | HS | LS | EXP | HS | LS | EXP | HS | LS | |||
| Fe–N2 | 2.184 | 2.152 | 1.980 | Fe–N2 | 2.171 | 1.962 | 1.961 | Fe–N2 | 1.965 | 2.009 | 1.955 |
| Fe–N3 | 2.303 | 2.373 | 2.076 | Fe–N3 | 2.294 | 2.349 | 2.064 | Fe–N3 | 2.035 | 2.301 | 2.044 |
| Fe–N4 | 2.210 | 2.170 | 2.013 | Fe–N4 | 2.207 | 2.139 | 2.013 | Fe–N5 | 1.970 | 2.037 | 2.004 |
| Fe–N5 | 2.217 | 2.171 | 2.016 | Fe–N5 | 2.205 | 2.139 | 2.013 | Fe–N6 | 1.936 | 2.176 | 1.943 |
| Fe–N6 | 2.058 | 1.874 | 1.835 | Fe–N6 | 2.065 | 1.917 | 1.896 | Fe–N7 | 1.952 | 2.301 | 1.876 |
| Fe–N7 | 2.095 | 2.109 | 1.845 | Fe–N7 | 2.091 | 1.843 | 1.882 | Fe–N8 | 1.967 | 2.038 | 2.004 |
| Angle N7–Fe–N6 | 96.34 | 92.21 | 92.80 | Angle N6–Fe–N7 | 95.03 | 93.73 | 91.33 | Angle N6–Fe–N7 | 89.85 | 94.08 | 88.78 |
The DFT computed energies of the Fe(II) centre in the high-spin (S = 2) quintet state and the low-spin (S = 0) singlet state using B3LYP and B3LYP* functionals for all the complexes are shown in Fig. S61 and 7,† respectively. The B3LYP functional predicts HS as the ground state for C1, C2, C4, and C5 and LS as the ground state for C3 and C6 complexes. The B3LYP computed energy gap between the HS–LS is found to be 82.9, 20.2, −242.1, 83.1, 85.7 and −280.9 kJ mol−1, respectively, for complexes C1, C2, C3, C4, C5 and C6 (Fig. S61†). These energy gaps confirm that the NCS− and NCSe− ligated complexes C1, C2, C4, and C5 possess HS as the ground state and are unlikely to show spin-crossover, whereas the NCBH3− ligated C3 and C6 are likely to show SCO behaviour since they possess LS as the ground state. This is in line with the experimental prediction of SCO behaviour for complexes C3 and C6. However, the HS states of C3 and C6 are not in the thermally accessible region from the ground LS state (−242.1 and −280.9 kJ mol−1) to facilitate the SCO phenomenon to occur, and this gap is expected to be in the −33 to 0 kJ mol−1 (−8 to 0 kcal mol−1) range.38 Though the B3LYP hybrid functional predicts the expected ground state for all these complexes, the energy gap between the HS–LS states is overestimated for the SCO complexes C3 and C6. We assume that the amount of Hartree–Fock exchange (20%) in the B3LYP hybrid functional is large for predicting the correct energy gap between the HS–LS. The spin-state splitting is highly influenced by the percentage of HF exchange in hybrid functionals and it was evident from the previous study that the alteration in the %HF exchange in B3LYP helped them to comprehend the impact this had on the SCO properties of [Fe(bik)2(NCX)2] (bik = bis(1-methylimidazol-2-yl)ketone); (X = S and Se) complexes.36 It was mentioned that the reduction in the percentage of HF exchange in hybrid functional would help in attaining the exact ground state as well as the reasonable HS–LS energy gap; especially the B3LYP* (15%) is found to be an excellent one in predicting the SCO behaviour.39–41
Thus, we also optimised the geometry of all the complexes using B3LYP* functional which predicts HS as the ground spin state for NCS− ligated complexes C1 and C4, and LS as the ground state for NCSe− and NCBH3− ligated complexes C2, C3, C5 and C6. The B3LYP* functional predicts the following HS–LS energy gap: 9.8, −6.5, −15.2, 45.5, −28.2 and −43.8 kJ mol−1 for complexes C1, C2, C3, C4, C5 and C6, respectively (Fig. 7). These energy gaps indicate that the NCS− ligated complexes C1 and C4 do not show spin transition characteristics, whereas the NCSe− and NCBH3− ligated C2, C3, C5 and C6 are likely to show SCO behaviour. This computational observation is in accordance with the experimental observation which predicts SCO behaviour for NCBH3− ligated C3 and C6 complexes, whereas it is absent for NCS− ligated C1 and C4 complexes. The B3LYP* computed energy difference of the HS–LS states for complexes C2 and C5 indicates that these complexes could also exhibit SCO behaviour, which contradicts the experimental observations suggesting no SCO behaviour. The discrepancy was attributed to the fact that the calculations were performed in the gas phase, exclusion of intermolecular interactions and lattice effects which are known to significantly influence the spin-state energetics.42 Unlike B3LYP, the B3LYP* predicts the reasonable HS–LS energy gap for the NCBH3− ligated C3 and C6 complexes which is in the ideal energy gap of −33 to 0 kJ mol−1 for C3, but it slightly falls outside the expected range for C6 for the SCO behaviour to occur. Finally, the B3LYP* is found to be better compared to the B3LYP in predicting the ground state values as well as the SCO behaviour in the studied complexes. Thus, we further attempted to calculate the transition temperature (T1/2) using only the B3LYP* functional for the SCO C3 and C6 complexes and compared them with the experimentally measured transition temperature (T1/2). Still, this must be taken with caution as we are aware from the experimental data C3 and C6 for which B3LYP* predicts a LS ground state in the absence of lattice solvent in both cases, are also stabilised in the HS state. The predicted results B3LYP* must be validated with appropriate experimental data to know the role of intramolecular interactions, such as lattice solvent and packing effects. These play a very crucial role in SCO and cannot be accounted for in gas phase calculations.
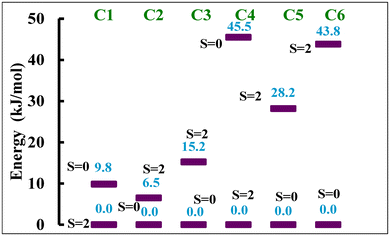 | ||
| Fig. 7 Energy difference in kJ mol−1 between two spin states computed with B3LYP* for all six complexes. | ||
To estimate the transition temperature (T1/2), we calculated the thermodynamic parameters such as ΔH (HHS–HLS) and ΔS (SHS–SLS) based on the frequency calculations over the optimized coordinates and Table 2 summarises these values. These computed values align with the experimental findings for the reported FeII spin crossover compounds.7,32,43 Vibronic entropy always favours the high-spin state; strong field ligands that energetically favour the low-spin state lose more to vibronic entropy. These estimated entropy and enthalpy values are highly dependent on the π-acceptor abilities, where these values are more pronounced for the complexes C3 and C6 which possess the moderate field NCBH3− ligands and smaller for the complexes C1 and C4 which possess comparatively weaker field NCS− ligand. This indicates that the π-acceptor abilities and the ligand field strength in comparison to the NCX (X = S/Se) ligand are comparatively better for the NCBH3− ligated which imposes the SCO behaviour. Furthermore, the T1/2 is estimated using these thermodynamic parameters and the formula T1/2 = ΔH/ΔS for C3 and C6.35 The computed transition temperature (T1/2) of 166K and 164 K for complexes C3 and C6, respectively are in good agreement with the experimentally determined T1/2 value of 165 K and 194 K. These results further support that the B3LYP* is a useful functional in determining the SCO behaviour.38–41
| Thermodynamic parameters | C1 | C2 | C3 | C4 | C5 | C6 |
|---|---|---|---|---|---|---|
| ΔH (HS–LS) kJ mol−1 | −4.6 | 9.6 | 45.6 | −6.2 | −4.2 | 26.3 |
| ΔS (HS–LS) J mol−1 K−1 | 33.4 | 51.8 | 274.2 | 63.1 | −43.5 | 160.1 |
| T 1/2 (K) = ΔH/ΔS | — | — | 166 | — | — | 164 |
The π-acceptor abilities of these ligands are also reflected in the spin-density calculations. A spin-density value of ca. 4.038–4.168 has been found on the Fe(II) centres of C1, C2, C3 and C4 complexes in their high-spin structures which indicates the Fe(II) centres gain spins from the first coordinated atoms of the 1,3,4-oxadiazole ligand due to ligand-to-metal donor ability. Whereas a spin density value of ca. 2.60–2.82 has been found on the Fe(II) centres of C5 and C6 complexes which suggests that the metal-to-ligand spin delocalisation occurring to the first coordinated atoms of the 1,3,4-oxadiazole ligand and the NCE ligand. The net spin densities of the coordinated nitrogen atoms of NCS−, NCSe−, and NCBH3− have spin densities of ca. −0.11 to 0.002 and −0.232 to 0.17 for complexes C1 and C4, −0.196 to 0.160 and 0.135–0.194, for complexes C2 and C5, 0.085–0.120 and −0.008 to 0.225 for complexes C3 and C6, respectively. Similarly, the E donor atoms of NCE have spin densities of ca. −0.36 to −0.2 for the S atom, −0.78 to 0.6 for the Se atom, and −0.9 to 0.2 for the S atoms in their respective complexes. These small spin values of the first coordination sphere and the predominant spin values of the E donor atoms suggest a more pronounced π-acceptor ability for these −NCE ligands towards the metal centre. The B3LYP* computed spin-density plots of C3 and C6 are shown in Fig. 8 and spin-density plots of the remaining complexes are shown in Fig. S62.† Moreover, these spin density values indicate that the two sets of complexes with three different −NCE ligands can vary significantly in terms of structural and electronic alteration resulting in different SCO properties.7,40
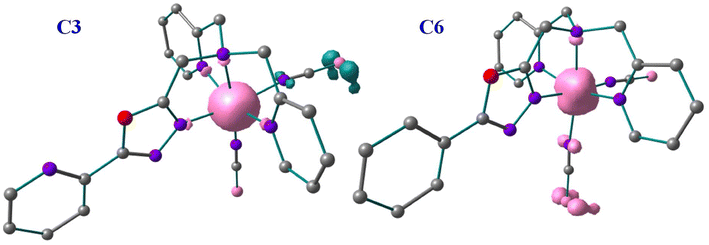 | ||
| Fig. 8 Spin density diagram for complex C3 and C6 in High Spin state with B3LYP* optimised geometry. | ||
The orbital splitting and the spin pairing energy can highly influence the spin ground state.7,40 Thus, to get further insights into the possibility of spin-pairing energy in C3 and C6, the d-based orbitals at their respective high-spin states have been computed and the eigenvalue plot with their energies is shown in Fig. 9. The B3LYP* calculated electronic configurations for the complexes C3 and C6 are as follows (dxy)2(dxz)1(dyz)1(dz2)1(dx2–y2)1 and (dyz)2(dxy)1(dxz)1(dz2)1(dx2–y2)1, respectively. The red arrow represents the spin-up (α) electrons whereas the green arrow represents the spin-down (β) electrons. For C3, the energy difference between the t2g-like and eg-like orbitals is around 168.74 kJ mol−1, while it is approximately 33.28 kJ mol−1 for C6. The spins in the dxz and dyz orbitals must couple to generate the low-spin complex. The NCBH3 coordination has a significant impact on both orbitals since these t2g-like and eg-like orbitals energy gap is extremely small which leads to the SCO behaviour in C3 and C6. This results credence to the hypothesis that ligands with weak π-type interactions are the best choices for ligands for tuning the SCO characteristic.37
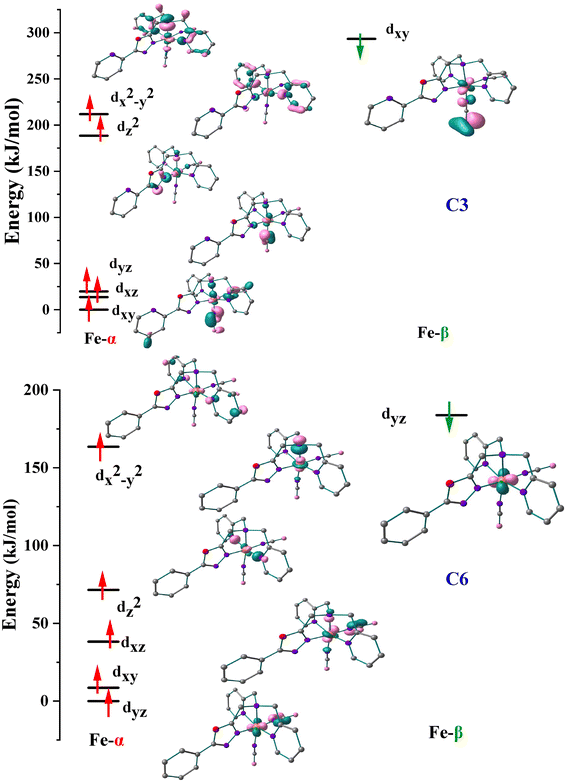 | ||
| Fig. 9 Eigenvalue plot computed for C3 and C6. Here, α and β represent spin-up and spin-down configurations. The energies are scaled to the lowest spin-up orbitals in each case. | ||
Stronger delocalization is facilitated by the C-atom of the phenyl ring near the oxalate ring (LTetraPh–ODA) which possesses a spin value of 0.0033 in C6, whereas the N-atom of pyridine (LTetraPy–ODA) possesses a spin value of 0.0016 in C3, which also specifically disturb the energies of the dxz and dyz orbitals. The dxz/dyz orbitals in the case of C6 are considerably destabilized compared to C3, resulting in a narrower t2g-eg gap. Strong delocalization of LTetraPh–ODA to the Fe centre (Fig. 9) also enhances the pairing energy compared to the LTetraPy–ODA analogues, which compensates for the lower t2g-eg gap leads to the observation of SCO at a relatively higher temperature. This is because the SCO properties are correlated with both the crystal-field splitting and the pairing energy.
Conclusion
In conclusion, we have prepared two new tetradentate ligands LTetraPy–ODA and LTetraPh–ODA based on 1,3,4-Oxadiazole. We have also prepared six mononuclear complexes C1–C6 with three different NCE co ligands where E = S (C1, C4), Se (C2, C5) and BH3 (C3, C6). Complexes with NCBH3− co-ligands with both the ligands (C3 and C6) exhibit SCO behaviour. The SCO behaviour is dependent on the lattice solvent in both the cases which is thoroughly investigated. In comparison to the previously reported analogues complex with NCBH3− co-ligand, the change from the naphthalene to phenyl did not affect the ligand as much as expected and the T1/2 remains close to each other but in the case of ligand LTetraPy–ODA the T1/2 values indicate the ligand field is well reduced. This comparison has to be also taken with caution as the small changes in the crystal lattice and packing might affect the SCO behaviour. In addition to this, the di-nuclear complex C7 prepared stays in the HS state over the measured temperature window. The existence of a spin transition in C3 and C6 is supported by DFT calculations performed on the electronic structures of both the low-spin and high-spin structures. To precisely replicate the HS–LS gap for all the complexes, two different functionals such as B3LYP and B3LYP* having different percentages of HF exchange were utilized for the calculations. The computed energy gap values using the B3LYP* functional, the one with a smaller percentage of HF exchange, yielded better results that are also in excellent agreement with the experimental observations. Furthermore, in the NCBH3− ligated complexes, because of its poor π-donor abilities which in turn results in a greater ligand field, and these effects support a higher spin-transition temperature in the NCBH3 derivative.7,35,44Experimental
All chemicals were purchased from Alfa Aesar, Deutero, Fisher Chemicals, TCI, Sigma-Aldrich, and Acros Organics and used without further purification. Solvents were dried according to the literature-known procedures and used freshly distilled.45 Dry DMF was purchased from Sigma Aldrich. NMR spectra were recorded at room temperature with a Bruker Avance DSX 400 and analysed with the program MestReNova.46 Magnetic susceptibility measurements were performed on a Quantum Design SQUID magnetometer MPMSXL in a temperature range between 2 and 400 K with an applied field of 1 kOe. All elemental analysis (Elementar vario EL Cube: C, H, and N) were measured at the microanalytical laboratories of the Johannes Gutenberg University Mainz. X-ray diffraction data were collected with STOE STADIVARI at Johannes Gutenberg University Mainz. The structures were solved with ShelXT47 and refined with ShelXL48,49 implemented in the program Olex2.50 The X-ray cif file data are deposited on the Cambridge CCDC database with identification numbers 2348659–2348666.† DFT calculations have been performed using the Gaussian 16 program,51 using two-hybrid functionals B3LYP and B3LYP*,44 and the Ahlrichs TZVP basis set52 for all the atoms present in the complexes.Ligand synthesis
![[thin space (1/6-em)]](https://www.rsc.org/images/entities/char_2009.gif) :
:![[thin space (1/6-em)]](https://www.rsc.org/images/entities/char_2009.gif) 1)) yielded LTetraPy–ODA as an orange oil which crystallizes after several days (4.87 g, 19.93 mmol, 67%). 1HNMR (400 MHz, CDCl3, COSY, δ (ppm)): 8.77 (d, 1H, pyCH), 8.53 (d, 2H, pyCH), 8.22 (d, 1H, pyCH), 7.88 (td, 1H, pyCH), 7.68–7.63 (m, 2H, pyCH), 7.58 (d, 2H, pyCH), 7.46 (dd, 1H, pyCH), 7.17–7.14 (m, 2H, pyCH), 4.19 (s, 2H, ODA-CH2), 4.04 (s, 4H, Py–CH2). 13C NMR (101 MHz, CDCl3, HSQC, HMBC, δ (ppm)): 165.00, 164.28, 158.22, 150.25, 149.20, 143.42, 137.25, 136.64, 125.87, 123.30, 123.13, 122.30, 59.76 (CH2), 47.97 (CH2). FT-IR:
1)) yielded LTetraPy–ODA as an orange oil which crystallizes after several days (4.87 g, 19.93 mmol, 67%). 1HNMR (400 MHz, CDCl3, COSY, δ (ppm)): 8.77 (d, 1H, pyCH), 8.53 (d, 2H, pyCH), 8.22 (d, 1H, pyCH), 7.88 (td, 1H, pyCH), 7.68–7.63 (m, 2H, pyCH), 7.58 (d, 2H, pyCH), 7.46 (dd, 1H, pyCH), 7.17–7.14 (m, 2H, pyCH), 4.19 (s, 2H, ODA-CH2), 4.04 (s, 4H, Py–CH2). 13C NMR (101 MHz, CDCl3, HSQC, HMBC, δ (ppm)): 165.00, 164.28, 158.22, 150.25, 149.20, 143.42, 137.25, 136.64, 125.87, 123.30, 123.13, 122.30, 59.76 (CH2), 47.97 (CH2). FT-IR: ![[small upsilon, Greek, tilde]](https://www.rsc.org/images/entities/i_char_e131.gif) (cm−1) = 3055, 3008, 2984, 2946, 2917, 2887, 2838, 1675, 1587, 1567, 1557, 1545, 1515, 1473, 1456, 1431, 1375, 1365, 1360, 1340, 1323, 1308, 1297, 1286, 1247, 1220, 1148, 1100, 1087, 1045, 1022, 1012, 994, 974, 959, 894, 868, 856, 844, 797, 787, 777, 753, 743, 708, 659, 640, 632, 617, 610, 506, 487, 477, 461.
(cm−1) = 3055, 3008, 2984, 2946, 2917, 2887, 2838, 1675, 1587, 1567, 1557, 1545, 1515, 1473, 1456, 1431, 1375, 1365, 1360, 1340, 1323, 1308, 1297, 1286, 1247, 1220, 1148, 1100, 1087, 1045, 1022, 1012, 994, 974, 959, 894, 868, 856, 844, 797, 787, 777, 753, 743, 708, 659, 640, 632, 617, 610, 506, 487, 477, 461.
![[thin space (1/6-em)]](https://www.rsc.org/images/entities/char_2009.gif) :
:![[thin space (1/6-em)]](https://www.rsc.org/images/entities/char_2009.gif) 1)) yielded LTetraPh–ODA as bright brown oil which crystallizes after several days (7.94 g, 22.21 mmol, 78%). 1H NMR (400 MHz, CDCl3, δ (ppm)): 8.56–8.54 (m, 2H, pyCH), 8.05–8.03 (m, 2H, pyCH), 8.69 (dt, 2H, pyCH), 7.60–7.48 (m, 5H, PhCH + pyCH), 7.20–7.16 (m, 2H, pyCH), 4.15 (s, 2H, ODA-CH2), 4.06 (s, 4H, Py–CH2). 13C NMR (101 MHz, CDCl3, δ (ppm)): 165.11, 164.02, 158.22, 149.18, 136.62, 131.70, 129.00, 126.89, 123.75, 123.19, 122.30, 59.90 (CH2), 47.95 (CH2). FT-IR:
1)) yielded LTetraPh–ODA as bright brown oil which crystallizes after several days (7.94 g, 22.21 mmol, 78%). 1H NMR (400 MHz, CDCl3, δ (ppm)): 8.56–8.54 (m, 2H, pyCH), 8.05–8.03 (m, 2H, pyCH), 8.69 (dt, 2H, pyCH), 7.60–7.48 (m, 5H, PhCH + pyCH), 7.20–7.16 (m, 2H, pyCH), 4.15 (s, 2H, ODA-CH2), 4.06 (s, 4H, Py–CH2). 13C NMR (101 MHz, CDCl3, δ (ppm)): 165.11, 164.02, 158.22, 149.18, 136.62, 131.70, 129.00, 126.89, 123.75, 123.19, 122.30, 59.90 (CH2), 47.95 (CH2). FT-IR: ![[small upsilon, Greek, tilde]](https://www.rsc.org/images/entities/i_char_e131.gif) (cm−1) = 3061, 3009, 2948, 2932, 2900, 2853, 1673, 1607, 1589, 1561, 1548, 1490, 1473, 1447, 1433, 1412, 1393, 1367, 1355, 1326, 1311, 1287, 1249, 1206, 1150, 1128, 1085, 1070, 1044, 1007, 994, 984, 975, 958, 942, 919, 896, 877, 831, 771, 755, 744, 706, 685, 652, 641, 631, 612, 514, 488, 471, 445, 403.
(cm−1) = 3061, 3009, 2948, 2932, 2900, 2853, 1673, 1607, 1589, 1561, 1548, 1490, 1473, 1447, 1433, 1412, 1393, 1367, 1355, 1326, 1311, 1287, 1249, 1206, 1150, 1128, 1085, 1070, 1044, 1007, 994, 984, 975, 958, 942, 919, 896, 877, 831, 771, 755, 744, 706, 685, 652, 641, 631, 612, 514, 488, 471, 445, 403.
Complexes synthesis
![[small upsilon, Greek, tilde]](https://www.rsc.org/images/entities/i_char_e131.gif) (cm−1) = 3471, 3063, 2062, 2030, 1605, 1546, 1487, 1440, 1292, 1084, 1057, 1025, 977, 879, 778, 761, 737, 708, 646, 522, 478, 424, 411. Elemental analysis calculated for C22H18FeN8OS2·H2O: C, 48.18; H, 3.68; N, 20.43; Found, C, 48.37; H, 3.46; N, 20.74.
(cm−1) = 3471, 3063, 2062, 2030, 1605, 1546, 1487, 1440, 1292, 1084, 1057, 1025, 977, 879, 778, 761, 737, 708, 646, 522, 478, 424, 411. Elemental analysis calculated for C22H18FeN8OS2·H2O: C, 48.18; H, 3.68; N, 20.43; Found, C, 48.37; H, 3.46; N, 20.74.
![[small upsilon, Greek, tilde]](https://www.rsc.org/images/entities/i_char_e131.gif) (cm−1) = 3054, 2904, 2846, 2684, 2307, 2198, 2163, 2059, 1946, 1601, 1569, 1552, 1475, 1457, 1440, 1425, 1410, 1386, 1350, 1332, 1301, 1280, 1247, 1153, 1118, 1097, 1048, 1017, 992, 972, 957, 899, 882, 852, 817, 795, 757, 737, 705, 640, 619, 532, 509, 480, 418. Elemental analysis calculated for C22H18FeN8OSe2·0.15 CH3CN·1.5 H2O: C, 41.21; H, 3.31; N, 17.22. Found, C, 41.49; H, 3.54; N, 16.82.
(cm−1) = 3054, 2904, 2846, 2684, 2307, 2198, 2163, 2059, 1946, 1601, 1569, 1552, 1475, 1457, 1440, 1425, 1410, 1386, 1350, 1332, 1301, 1280, 1247, 1153, 1118, 1097, 1048, 1017, 992, 972, 957, 899, 882, 852, 817, 795, 757, 737, 705, 640, 619, 532, 509, 480, 418. Elemental analysis calculated for C22H18FeN8OSe2·0.15 CH3CN·1.5 H2O: C, 41.21; H, 3.31; N, 17.22. Found, C, 41.49; H, 3.54; N, 16.82.
![[small upsilon, Greek, tilde]](https://www.rsc.org/images/entities/i_char_e131.gif) (cm−1) = 3489, 3073, 2060, 1709, 1666, 1603, 1568, 1474, 1445, 1336, 1289, 1258, 1240, 1160, 1093, 1047, 1023, 853, 787, 763, 707, 694, 647, 541, 481, 448, 416. Elemental analysis calculated for C22H24B2FeN8O·2H2O: C, 49.86; H, 5.33; N, 21.14. Found, C, 49.83; H, 5.03; N, 21.40.
(cm−1) = 3489, 3073, 2060, 1709, 1666, 1603, 1568, 1474, 1445, 1336, 1289, 1258, 1240, 1160, 1093, 1047, 1023, 853, 787, 763, 707, 694, 647, 541, 481, 448, 416. Elemental analysis calculated for C22H24B2FeN8O·2H2O: C, 49.86; H, 5.33; N, 21.14. Found, C, 49.83; H, 5.03; N, 21.40.
![[small upsilon, Greek, tilde]](https://www.rsc.org/images/entities/i_char_e131.gif) (cm−1) = 3061, 3008, 2906, 2849, 2059, 1971, 1602, 1590, 1570, 1554, 1479, 1439, 1387, 1368, 1351, 1333, 1314, 1300, 1285, 1247, 1224, 1152, 1121, 1099, 1069, 1047, 1018, 993, 974, 956, 927, 898, 881, 853, 798, 778, 756, 736, 707, 690, 640, 614, 510, 477, 435, 418, 404. Elemental analysis calculated for C23H19FeN7OS2·1.75 H2O: C, 49.25; H, 4.04; N, 17.48. Found, C, 49.22; H, 3.62; N, 17.06.
(cm−1) = 3061, 3008, 2906, 2849, 2059, 1971, 1602, 1590, 1570, 1554, 1479, 1439, 1387, 1368, 1351, 1333, 1314, 1300, 1285, 1247, 1224, 1152, 1121, 1099, 1069, 1047, 1018, 993, 974, 956, 927, 898, 881, 853, 798, 778, 756, 736, 707, 690, 640, 614, 510, 477, 435, 418, 404. Elemental analysis calculated for C23H19FeN7OS2·1.75 H2O: C, 49.25; H, 4.04; N, 17.48. Found, C, 49.22; H, 3.62; N, 17.06.
![[small upsilon, Greek, tilde]](https://www.rsc.org/images/entities/i_char_e131.gif) (cm−1) = 2945, 2903, 2847, 2060, 1970, 1944, 1602, 1579, 1572, 1555, 1480, 1450, 1439, 1386, 1350, 1333, 1313, 1300, 1283, 1248, 1224, 1152, 1120, 1113, 1099, 1069, 1047, 1034, 1019, 992, 974, 966, 956, 898, 880, 850, 817, 779, 756, 736, 707, 690, 640, 511, 479, 418. Elemental analysis calculated for C23H19FeN7OSe2·0.4C4H10O·H2O: C, 44.04; H, 3.76; N, 14.61. Found, C, 43.62; H, 3.53; N, 14.29.
(cm−1) = 2945, 2903, 2847, 2060, 1970, 1944, 1602, 1579, 1572, 1555, 1480, 1450, 1439, 1386, 1350, 1333, 1313, 1300, 1283, 1248, 1224, 1152, 1120, 1113, 1099, 1069, 1047, 1034, 1019, 992, 974, 966, 956, 898, 880, 850, 817, 779, 756, 736, 707, 690, 640, 511, 479, 418. Elemental analysis calculated for C23H19FeN7OSe2·0.4C4H10O·H2O: C, 44.04; H, 3.76; N, 14.61. Found, C, 43.62; H, 3.53; N, 14.29.
![[small upsilon, Greek, tilde]](https://www.rsc.org/images/entities/i_char_e131.gif) (cm−1) = 3030, 2958, 2919, 2352, 2328, 2177, 1604, 1584, 1574, 1557, 1481, 1440, 1427, 1390, 1355, 1333, 1320, 1304, 1287, 1250, 1223, 1153, 1118, 1112, 1098, 1052, 1044, 1021, 988, 960, 892, 883, 855, 817, 776, 764, 735, 704, 686, 642, 510, 480, 418. Elemental analysis calculated for C23H25B2FeN7O·1.5H2O: C, 53.13; H, 5.43; N, 18.86. Found, C, 52.75; H, 5.08; N, 18.60.
(cm−1) = 3030, 2958, 2919, 2352, 2328, 2177, 1604, 1584, 1574, 1557, 1481, 1440, 1427, 1390, 1355, 1333, 1320, 1304, 1287, 1250, 1223, 1153, 1118, 1112, 1098, 1052, 1044, 1021, 988, 960, 892, 883, 855, 817, 776, 764, 735, 704, 686, 642, 510, 480, 418. Elemental analysis calculated for C23H25B2FeN7O·1.5H2O: C, 53.13; H, 5.43; N, 18.86. Found, C, 52.75; H, 5.08; N, 18.60.
![[small upsilon, Greek, tilde]](https://www.rsc.org/images/entities/i_char_e131.gif) (cm−1) = 3079, 2961, 2935, 2005, 1652, 1636, 1609, 1587, 1572, 1555, 1517, 1506, 1487, 1459, 1443, 1430, 1375, 1362, 1319, 1312, 1292, 1253, 1224, 1163, 1151, 1072, 1021, 1003, 962, 948, 930, 897, 886, 878, 835, 799, 761, 748, 716, 706, 665, 648, 620, 511, 485, 458, 419, 409. Elemental analysis calculated for C40H36Cl4Fe2N12O18·CH3NO2·1.5H2O: C, 37.47; H, 3.22; N, 13.85. Found, C, 37.19; H, 3.32; N, 13.99.
(cm−1) = 3079, 2961, 2935, 2005, 1652, 1636, 1609, 1587, 1572, 1555, 1517, 1506, 1487, 1459, 1443, 1430, 1375, 1362, 1319, 1312, 1292, 1253, 1224, 1163, 1151, 1072, 1021, 1003, 962, 948, 930, 897, 886, 878, 835, 799, 761, 748, 716, 706, 665, 648, 620, 511, 485, 458, 419, 409. Elemental analysis calculated for C40H36Cl4Fe2N12O18·CH3NO2·1.5H2O: C, 37.47; H, 3.22; N, 13.85. Found, C, 37.19; H, 3.32; N, 13.99.
Conflicts of interest
There are no conflicts to declare.Acknowledgements
S. U. S., J. E., L. W., L. M. C. and E. R. sincerely thank JGU Mainz for the funding and support. E. G. thanks the CSIR-UGC for providing a PhD fellowship. K. R. V. thanks the IISER Mohali-High Performing Computing Facility for providing computing resources and also thanks SERB for providing start-up research grant funding (SRG/2023/000286).References
- M. Sánchez, L. Sabio, N. Gálvez, M. Capdevila and J. M. Dominguez-Vera, IUBMB Life, 2017, 69, 382–388 CrossRef PubMed.
- P. A. Frey and G. H. Reed, ACS Chem. Biol., 2012, 7(9), 1477–1481 CrossRef CAS PubMed.
- J. Hohenberger, K. Ray and K. Meyer, Nat. Commun., 2012, 3(1), 720 CrossRef PubMed.
- M. Keilwerth, W. Mao, M. Malischewski, S. A. V. Jannuzzi, K. Breitwieser, F. W. Heinemann, A. Scheurer, S. Debeer, D. Munz, E. Bill and K. Meyer, Nat. Chem., 2024, 1–7 Search PubMed.
- L. Cambi and L. Szegö, Ber. Dtsch. Chem. Ges. B, 1931, 64, 2591–2598 CrossRef.
- M. A. Halcrow, Spin-Crossover Materials: Properties and Applications, John Wiley and Sons, 2013 Search PubMed.
- P. Gütlich, Y. Garcia and H. A. Goodwin, Chem. Soc. Rev., 2000, 29, 419–427 RSC.
- H. L. C. Feltham, A. S. Barltrop and S. Brooker, Coord. Chem. Rev., 2017, 344, 26–53 CrossRef CAS.
- S. Brooker, Chem. Soc. Rev., 2015, 44, 2880–2892 RSC.
- D. J. Harding, P. Harding and W. Phonsri, Coord. Chem. Rev., 2016, 313, 38–61 CrossRef CAS.
- S. Sundaresan, I. A. Kühne, C. Evesson, M. M. Harris, A. J. Fitzpatrick, A. Ahmed, H. Müller-Bunz and G. G. Morgan, Polyhedron, 2021, 208, 115386 CrossRef CAS.
- J. Olguín, Coord. Chem. Rev., 2020, 407, 213148 CrossRef.
- I. Krivokapic, M. Zerara, M. L. Daku, A. Vargas, C. Enachescu, C. Ambrus, P. Tregenna-Piggott, N. Amstutz, E. Krausz and A. Hauser, Coord. Chem. Rev., 2007, 251, 364–378 CrossRef CAS.
- S. Hayami, Y. Komatsu, T. Shimizu, H. Kamihata and Y. H. Lee, Coord. Chem. Rev., 2011, 255, 1981–1990 CrossRef CAS.
- N. A. A. M. Amin, S. M. Said, M. F. M. Salleh, A. M. Afifi, N. M. J. N. Ibrahim, M. M. I. M. Hasnan, M. Tahir and N. Z. I. Hashim, Inorg. Chim. Acta, 2023, 544, 121168 CrossRef CAS.
- A. B. Gaspar, V. Ksenofontov, M. Seredyuk and P. Gütlich, Coord. Chem. Rev., 2005, 249, 2661–2676 CrossRef CAS.
- A. B. Gaspar and M. Seredyuk, Coord. Chem. Rev., 2014, 268, 41–58 CrossRef CAS.
- A. Enriquez-Cabrera, A. Rapakousiou, M. Piedrahita Bello, G. Molnár, L. Salmon and A. Bousseksou, Coord. Chem. Rev., 2020, 419, 213396 CrossRef CAS.
- K. Senthil Kumar and M. Ruben, Coord. Chem. Rev., 2017, 346, 176–205 CrossRef CAS.
- C. Köhler and E. Rentschler, Eur. J Inorg. Chem., 2016, 1955–1960 CrossRef.
- S. Sundaresan, J. Eppelsheimer, L. M. Carrella and E. Rentschler, Crystals, 2022, 12, 404 CrossRef CAS.
- J. Klingele, D. Kaase, M. Schmucker, Y. Lan, G. Chastanet and J. F. Letard, Inorg. Chem., 2013, 52, 6010 CrossRef PubMed.
- P. Zoufalý, A. Kliuikov, E. Čižmár, I. Císařová and R. Herchel, Eur. J. Inorg. Chem., 2021, 1190–1199 CrossRef.
- S. Sundaresan, J.-G. Becker, J. Eppelsheimer, A. E. Sedykh, L. Carrella, K. Müller-Buschbaum and E. Rentschler, Dalton Trans., 2023, 52, 13181–13189 RSC.
- S. Sundaresan, J. Kiehl, L. M. Carrella and E. Rentschler, Cryst. Growth Des., 2023, 23(3), 1648–1655 CrossRef CAS.
- B. Fei, X. Q. Chen, Y. De Cai, J. K. Fang, M. L. Tong, J. Tucek and X. Bao, Inorg. Chem. Front., 2018, 5, 1671–1676 RSC.
- C. F. Herold, L. M. Carrella and E. Rentschler, Eur. J. Inorg. Chem., 2015, 3632–3636 CrossRef CAS.
- C. F. Herold, S. I. Shylin and E. Rentschler, Inorg. Chem., 2016, 55, 6414–6419 CrossRef CAS PubMed.
- H. S. Scott, R. W. Staniland and P. E. Kruger, Coord. Chem. Rev., 2018, 362, 24–43 CrossRef CAS.
- U. Habarakada, T. Boonprab, P. Harding, K. S. Murray, W. Phonsri, S. M. Neville, M. Ahmed and D. J. Harding, Cryst. Growth Des., 2022, 22, 4895–4905 CrossRef CAS.
- R. W. Hogue, R. G. Miller, N. G. White, H. L. C. Feltham, G. N. L. Jameson and S. Brooker, Chem. Commun., 2014, 50, 1435–1437 RSC.
- S. Sundaresan and S. Brooker, Inorg. Chem., 2023, 62(31), 12192–12202 CrossRef CAS PubMed.
- S. Alvarez, Chem. – Eur. J., 2020, 26, 4350–4377 CrossRef CAS PubMed.
- J. Cirera and F. Paesani, Inorg. Chem., 2012, 51(15), 8194–8201 CrossRef CAS PubMed.
- J. Cirera, M. Via-Nadal and E. Ruiz, Inorg. Chem., 2018, 57(22), 14097–14105 CrossRef CAS PubMed.
- S. De, L.-M. Chamoreau, H. El Said, Y. Li, A. Flambard, M.-L. Boillot, S. Tewary, G. Rajaraman, J. Manuel Seco and R. Lescouëzec, Front. Chem., 2018, 1, 326 CrossRef PubMed.
- M. Schmidt, D. Wiedemann, B. Moubaraki, N. F. Chilton, K. S. Murray, K. R. Vignesh, G. Rajaraman and A. Grohmann, Eur. J. Inorg. Chem., 2013, 958–967 CrossRef CAS.
- S. Ye and F. Neese, Inorg. Chem., 2010, 49, 772–774 CrossRef CAS PubMed.
- D. Vidal, J. Cirera and J. Ribas-Arino, Phys. Chem. Chem. Phys., 1249, 25, 12490 RSC.
- K. P. Kepp, Coord. Chem. Rev., 2013, 257, 196–209 CrossRef CAS.
- E. Jakubikova and D. N. Bowman, Acc. Chem. Res., 2015, 48(5), 1441–1449 CrossRef CAS PubMed.
- W. Honsri, D. S. Macedo, K. R. Vignesh, G. Rajaraman, C. D. Avies, G. N. L. Jameson, B. Moubaraki, J. S. Ward, P. E. Kruger, G. Chastanet and K. S. Murray, Chem. – Eur. J., 2017, 23, 7052–7065 CrossRef PubMed.
- J. M. Holland, J. A. Mcallister, Z. Lu, C. A. Kilner, M. Thornton-Pett and M. A. Halcrow, Chem. Commun., 2001, 577–578 RSC.
- K. P. Kepp, Inorg. Chem., 2016, 55, 17 Search PubMed.
- W. L. F. Armarego, Purification of laboratory chemicals, 2017, pp. 95–634 Search PubMed.
- J. C. Cobas and F. J. Sardina, Concepts Magn. Reson., Part A, 2003, 80–96 CrossRef CAS.
- G. M. Sheldrick, Acta Crystallogr., 2015, 71, 3–8 CrossRef PubMed.
- G. M. Sheldrick and T. R. Schneider, Methods Enzymol., 1997, 277, 319–343 CAS.
- G. M. Sheldrick, Acta Crystallogr., Sect. C: Struct. Chem., 2015, 71, 3–8 Search PubMed.
- O. V. Dolomanov, L. J. Bourhis, R. J. Gildea, J. A. K. Howard and H. Puschmann, J. Appl. Crystallogr., 2009, 42, 339–341 CrossRef CAS.
- M. J. Frisch, G. W. Trucks, H. B. Schlegel, G. E. Scuseria, M. A. Robb, J. R. Cheeseman, G. Scalmani, V. Barone, G. A. Petersson, H. Nakatsuji, X. Li, M. Caricato, A. V. Marenich, J. Bloino, B. G. Janesko, R. Gomperts, B. Mennucci, H. P. Hratchian, J. V. Ortiz, A. F. Izmaylov, J. L. Sonnenberg, D. Williams-Young, F. Ding, F. Lipparini, F. Egidi, J. Goings, B. Peng, A. Petrone, T. Henderson, D. Ranasinghe, V. G. Zakrzewski, J. Gao, N. Rega, G. Zheng, W. Liang, M. Hada, M. Ehara, K. Toyota, R. Fukuda, J. Hasegawa, M. Ishida, T. Nakajima, Y. Honda, O. Kitao, H. Nakai, T. Vreven, K. Throssell, J. A. Montgomery Jr., J. E. Peralta, F. Ogliaro, M. J. Bearpark, J. J. Heyd, E. N. Brothers, K. N. Kudin, V. N. Staroverov, T. A. Keith, R. Kobayashi, J. Normand, K. Raghavachari, A. P. Rendell, J. C. Burant, S. S. Iyengar, J. Tomasi, M. Cossi, J. M. Millam, M. Klene, C. Adamo, R. Cammi, J. W. Ochterski, R. L. Martin, K. Morokuma, O. Farkas, J. B. Foresman and D. J. Fox, Gaussian 16, rev. B.01, Gaussian, Inc., Wallingford, CT, 2016 Search PubMed.
- F. Weigend and R. Ahlrichs, Phys. Chem. Chem. Phys., 2005, 7, 3297–3305 RSC.
Footnote |
| † Electronic supplementary information (ESI) available. CCDC 2348659–2348666. For ESI and crystallographic data in CIF or other electronic format see DOI: https://doi.org/10.1039/d4dt01141d |
| This journal is © The Royal Society of Chemistry 2024 |

