 Open Access Article
Hydrothermal synthesis of (Zr,U)SiO4: an efficient pathway to incorporate uranium into zircon†
Paul
Estevenon
 a,
Thomas
Barral
 b,
Arthur
Avallone
 b,
Mateo
Jeffredo
 b,
Alexis
De La Hos
 b,
Andrew
Strzelecki
 cde,
Xavier
Le Goff
 b,
Stephanie
Szenknect
 b,
Kristina
Kvashnina
 fg,
Philippe
Moisy
 a,
Renaud
Podor
 b,
Xiaofeng
Guo
 cde and
Nicolas
Dacheux
 *b
*b
aCEA, DES, ISEC, DMRC, Univ Montpellier, Marcoule, France
bICSM, Univ Montpellier, CNRS, CEA, ENSCM, Bagnols-sur-Cèze, France. E-mail: nicolas.dacheux@umontpellier.fr; Tel: +33 4 66 33 92 05
cDepartment of Chemistry, Washington State University, Pullman, Washington 99164, USA
dAlexandra Navrotsky Institute for Experimental Thermodynamics, Washington State University, Pullman, Washington 99164, USA
eMaterials Science and Engineering, Washington State University, Pullman, Washington 99164, USA
fHelmholtz Zentrum Dresden Rossendorf (HZDR), Institute of Resource Ecology, 01314 Dresden, Germany
gThe Rossendorf Beamline at ESRF–The European Synchrotron, 38043 Grenoble, Cedex 9, France
First published on 25th July 2024
Abstract
The preparation of synthetic (Zr,U)SiO4 solid solution is challenging, as the conventional high-temperature solid-state method limits the solubility of uranium (4 ± 1 mol%) in the orthosilicate phase due to its thermodynamic instability. However, these compounds are of great interest as a result of (Zr,U)SiO4 solid solutions, with uranium contents exceeding this concentration, being observed as corium phases formed during nuclear accidents. It has been identified that hydrothermal synthesis pathways can be used for the formation of the metastable phase, such as USiO4. The investigation carried out in this study has indeed led to the confirmation of metastable (Zr,U)SiO4 compounds with high uranium contents being formed. It was found that (Zr,U)SiO4 forms a close-to-ideal solid solution with uranium loading of up to 60 mol% by means of hydrothermal treatment for 7 days at 250 °C, at pH = 3 and starting from an equimolar reactant concentration equal to 0.2 mol L−1. A purification procedure was developed to obtain pure silicate compounds. After purification, these compounds were found to be stable up to 1000 °C under an inert atmosphere (argon). The characterisation methods used to explore the synthesis and thermal stability included powder X-ray diffraction (PXRD), Fourier transform infrared (FTIR) and Raman spectroscopies, scanning electron microscopy (SEM) and thermogravimetric analysis (TGA).
1. Introduction
Zircon, ZrSiO4, is a key mineral phase in geochronology because it is known to allow partial substitution of tetravalent zirconium (Zr4+) by tetravalent uranium (U4+), resulting in uranium contents typically ranging from 100 to 5000 ppm (ref. 1–5) and up to 11 mol% under very specific conditions.6,7 This phenomenon allows the use of U–Pb age determinations for zircon crystals, with ages that can exceed 4 billion years,8–11 providing key information about the geological history of the Earth. Self-irradiation of zircon phases due to uranium decay causes metamictization,3,12–18 and the recovery of this radiation damage also provides key information about the history of metamorphic rocks.19–23 Both phenomena have been extensively studied because of their importance in geological and environmental sciences.(Zr,U)SiO4 phases are also of vital interest to nuclear science, as this species was identified as one of the predominant radioactive phases formed in corium during the Chernobyl nuclear accident.24 Indeed, the accident that occurred in unit 4 of the Chernobyl nuclear power plant resulted in the melting of the nuclear fuel assemblies, which consisted of UO2 and the zircaloy cladding material present in the reactor.20,25 The molten nuclear fuel assemblies then interacted with structural materials, consisting of concrete and stainless steel.24,26–28 In addition, materials were air dropped during the early stages of the accident including the silicate mineral serpentine and siliciclastic sand, lead boric acid, and dolomite, which in turn also interacted with the melted fuel.20,24–26 All this led to the formation of complex silicate melts, known as “Chernobyl lavas”, which penetrated and solidified in many areas under the reactor.24,26 The main uranium-bearing phases identified in these lavas are mixed uranium–zirconium oxide (U,Zr)O2 and silicate (Zr,U)SiO4 phases.26 The (Zr,U)SiO4 phases, sometimes referred to as “Chernobylite”,29 have been observed to contain up to 12 mol% uranium.20,24,26,28–33 Similar (Zr,U)SiO4 phases are expected for the Fukushima Daiichi accident due to similar phenomena of melted fuel interactions with structural materials.34,35 In addition, experiments simulating corium formation are also successful in forming (Zr,U)SiO4 solutions.36,37
From a chemical point of view, the formation of these phases is a result of the crystal chemistry of zircon-type silicate compounds.38 In fact, it is known that tetravalent zirconium, hafnium, cerium and actinide (An) silicates (more precisely Th, Pa, U, Np, Pu and Am) crystallise in the same I41/amd crystal structure with the chemical formula MSiO4.39–42 This behaviour allows the partial substitution of zirconium, at the A site of the zircon structure, with other tetravalent metal cations, such as uranium, in ZrSiO4. In addition, zircon-type phases are very resistant to leaching under weathering conditions.43–49 These properties of long-term stability, very low leachability, and affinity for actinide has led to the proposal of (Zr,An)SiO4 phases as potential actinide-specific solid waste forms for the long-term disposal of spent nuclear fuel.50–66
However, attempts to synthesise (Zr,U)SiO4 by conventional high-temperature solid-state methods have yielded very limited results, with the highest uranium concentration synthesized by this method being limited to 4 mol%.67 In addition, the synthesis of pure silicate samples by this route is difficult and the samples obtained are usually mixtures of silicates and oxides. This solubility limitation can be explained by the ionic size difference between the Zr(IV) and U(IV) cations in octahedral coordination, 0.84 Å and 1.00 Å, respectively,68 which induces important structural strains.69,70 Calculations performed on this system also predicted the thermodynamic instability of these solid solutions.71 Nevertheless, the existence of environmental and accidental samples above the solubility limit demonstrated the possibility of forming zircon with a higher uranium content due to specific stability conditions or kinetic pathways, and at least suggested the existence of metastable states allowing their observation. In this context, the preparation of representative and chemically pure uranium-doped zircon above the currently observed synthetic solubility limit of 4 mol% uranium is a challenge to evaluate its thermodynamic and chemical properties and long-term behaviour, both for the environmental aspect (actinide behaviour in silicate-rich geological conditions) and for the understanding of actinide-containing zircon-type solid nuclear wastes.
Hydrothermal synthesis has been considered as a potential method to circumvent this experimental lock, as hydrothermal synthesis routes have been demonstrated to obtain pure metastable silicate phases such as USiO4 or CeSiO4.42,72–79 In addition, the literature on the hydrothermal synthesis of the (Zr,U)SiO4 solid solution has already reported the formation of metastable uranium-rich zircon compounds with up to 20 mol%69,80,81 and 27 wt% (i.e. 25 mol%) uranium according to Ioudintsev et al.82 Based on recent progress in the synthesis of ZrSiO4 and (Zr,Ce)SiO4 phases,83 the aim of this work is to revisit the solubility of uranium in ZrSiO4 using the soft hydrothermal synthesis method.
2. Materials and methods
2.1. Syntheses
A 6 mol L−1 HCl solution was prepared via dilution of 12 mol L−1 HCl (37%) stock solution of ACS grade from Sigma-Aldrich. The uranium(IV) chloride mother solution used was prepared by dissolving metallic uranium chips in the 6 mol L−1 HCl solution.84 The concentration of the uranium(IV) solution was determined by inductively coupled-atomic emission spectroscopy (ICP-AES) to be CU = 0.62 ± 0.01 mol L−1. All other reagents used were supplied by Sigma-Aldrich. Na2SiO3·5H2O (≥95%) and ZrOCl2·8H2O (≥99%) were used to produce aqueous silicate and zirconium precursors, respectively. An 8 mol L−1 NaOH solution was freshly prepared from Sigma-Aldrich ACS grade NaOH (98%) prior to the experiments.
Syntheses of (Zr,U)SiO4 solid solutions were carried out under an air atmosphere based on the conditions identified in the previous work for the synthesis of ZrSiO4![[thin space (1/6-em)]](https://www.rsc.org/images/entities/char_2009.gif) 83 and the acidity conditions were expected to favour the formation of metal silicate gels with tetravalent metal ions85 (i.e. to promote nucleation). Aqueous zirconium, uranium and silicate solutions were prepared by dissolving ZrOCl2·8H2O and Na2SiO3·5H2O in aqueous HCl and then adding uranium solution to obtain a reacting mixture in 1 mol L−1 HCl with a silicate excess of 5 mol%. A global cation concentration (CZr(IV) + CU(IV)) at 0.2 mol L−1 was considered, with different zirconium and uranium concentrations depending on the desired composition (Table SI 1†). The pH of the mixture was then adjusted to approximately pH = 3 using 8 mol L−1 NaOH.
83 and the acidity conditions were expected to favour the formation of metal silicate gels with tetravalent metal ions85 (i.e. to promote nucleation). Aqueous zirconium, uranium and silicate solutions were prepared by dissolving ZrOCl2·8H2O and Na2SiO3·5H2O in aqueous HCl and then adding uranium solution to obtain a reacting mixture in 1 mol L−1 HCl with a silicate excess of 5 mol%. A global cation concentration (CZr(IV) + CU(IV)) at 0.2 mol L−1 was considered, with different zirconium and uranium concentrations depending on the desired composition (Table SI 1†). The pH of the mixture was then adjusted to approximately pH = 3 using 8 mol L−1 NaOH.
All prepared mixtures were placed in 23 mL Teflon-lined containers (Parr 4749). The hydrothermal treatment conditions were set to t = 7 days and T = 250 °C, under autogenous pressure. Final cooling to room temperature was carried out within one hour. The precipitates were then separated from the supernatants by centrifugation at 12![[thin space (1/6-em)]](https://www.rsc.org/images/entities/char_2009.gif) 000 rpm for 12 min, washed twice with deionised water and once with ethanol, and finally dried overnight in an oven at 60 °C.
000 rpm for 12 min, washed twice with deionised water and once with ethanol, and finally dried overnight in an oven at 60 °C.
2.2. Characterisation of the prepared samples
PXRD data were collected using a Bruker D8 Advance diffractometer equipped with a LynxEye detector and using Cu Kα radiation (λ = 1.54184 Å) in reflection geometry (parallel beam) mode. Patterns were recorded between 5° and 90° (2θ) with 0.019° steps and a total counting time of 2.5 to 3 hours per sample. Pure silicon was used as the standard material to extract the instrumental function. The collected data were refined by the Rietveld method using the Fullprof suite package.87 During refinement, various profiles and structural parameters were allowed to vary, such as zero shift, unit cell parameters, scale factor, and total displacement factor. However, the occupancy of each site was fixed to the calculated values.Raman spectra were recorded using a Horiba-Jobin Yvon Aramis instrument equipped with an edge filter and a Nd:YAG laser (532 nm) delivering a 60 mW beam at the sample surface. The laser beam was then focused onto the sample using an Olympus BX 41 microscope with a ×50LMP objective, resulting in a spot area of ∼1 μm2. For each spectrum, the measurements were performed in the 100–1600 cm−1 range with a dwell time of 300 s. Three scans were recorded for each analysed area to minimise instrumental error. Fourier transform infrared (FTIR) spectra were recorded with a PerkinElmer FTIR Spectrum 100 instrument in the range of 550–4000 cm−1. Powdered samples were deposited on the surface of an ATR crystal without prior preparation. Spectra collected under these operating conditions had a resolution of less than 4 cm−1. Five scans were conducted for each sample to average the instrumental error.
Scanning electron microscopy (SEM) observations, implemented with energy dispersive X-ray spectroscopy (EDS), were made using an FEI Quanta 200 electronic microscope on small powder samples without any prior preparation. The electron microscope was equipped with either an Everhart–Thornley detector (ETD) or a back-scattered electron detector (BSED) under high vacuum conditions with a low accelerating voltage (2 kV). These conditions were chosen to produce a beam deceleration effect that allowed the acquisition of high-resolution images. Analyses by EDS coupled with SEM (Bruker XFlash® 5010 SDD detector) were carried out on samples deposited directly onto an aluminium support. Elemental distribution maps and semi-quantitative determination of phase compositions were recorded at 15 kV, without any supplementary preparation. The particles observed were isolated from each other, and their size was small enough for no charging effect to occur.
Image analysis was performed using ImageJ/Fiji software.88 To facilitate the segmentation of objects of interest, SEM images were optimized for high contrast between the background and particles. A Gaussian blur filter was applied to reduce high-frequency noise and improve the signal-to-noise ratio. Counting and morphological analyses were performed semi-automatically. Isolated and agglomerated particles were segmented, counted and analysed automatically and manually, respectively.
Thermogravimetric analysis (TGA) was performed to determine the hydration content of the samples prepared at the end of the syntheses and the thermal stability of the (Zr,U)SiO4 solid solutions. All these analyses were performed between room temperature and 1000 °C at a heating rate of 5 °C min−1 under an argon atmosphere using a SETSYS evolution TG/DTG analyser.
3. Results and discussion
3.1. Hydrothermal synthesis of (Zr,U)SiO4 with different uranium contents
Attempts were made to synthesise (Zr,U)SiO4 solid solutions based on the conditions identified in previous work for the synthesis of ZrSiO4.83 Since 7 days of hydrothermal treatment at 250 °C were found to be sufficient to prepare synthetic zircon with a concentration of reactants (silicate and Zr + U) of 0.2 mol L−1, these conditions were chosen as the reference for the study of (Zr,U)SiO4 solid solutions. In an effort to promote Zr substitution by U in the ZrSiO4 lattice, the acidity of the reactive media was chosen to be pH = 3. On the one hand, these conditions allow favourable interactions between the silicate (Si(OH)4) and the tetravalent metal ions according to the work of Iler85 and to promote the nucleation of metal silicate phases. On the other hand, these conditions appeared to be a compromise to limit the formation of large amounts of oxide as a secondary phase, which could be expected at higher pH values. The zirconium and uranium reactants were in the +4 oxidation state and all experiments were carried out in hydrochloric acid reactive media to limit the U(IV) oxidation to U(VI). All experiments were carried out under an air atmosphere.The syntheses were carried out with U/(Zr + U) molar fractions ranging from 0 to 90 mol% (i.e. Zr![[thin space (1/6-em)]](https://www.rsc.org/images/entities/char_2009.gif) :
:![[thin space (1/6-em)]](https://www.rsc.org/images/entities/char_2009.gif) U molar ratios ranging from 100
U molar ratios ranging from 100![[thin space (1/6-em)]](https://www.rsc.org/images/entities/char_2009.gif) :
:![[thin space (1/6-em)]](https://www.rsc.org/images/entities/char_2009.gif) 0 to 10
0 to 10![[thin space (1/6-em)]](https://www.rsc.org/images/entities/char_2009.gif) :
:![[thin space (1/6-em)]](https://www.rsc.org/images/entities/char_2009.gif) 90). The results of the PXRD analyses showed the formation of a zircon-type silicate phase from up to 60 mol% (Fig. 1), with the presence of XRD lines corresponding to the tetragonal I41/amd structure. A progressive shift towards lower angles was observed with increasing uranium content, corresponding to uranium incorporation into the ZrSiO4 lattice. Above 20 mol% uranium content, the hydrothermal syntheses resulted in multiple phases with the formation of secondary oxide phases. Well-crystallised cubic UO2+x (space group Fm
90). The results of the PXRD analyses showed the formation of a zircon-type silicate phase from up to 60 mol% (Fig. 1), with the presence of XRD lines corresponding to the tetragonal I41/amd structure. A progressive shift towards lower angles was observed with increasing uranium content, corresponding to uranium incorporation into the ZrSiO4 lattice. Above 20 mol% uranium content, the hydrothermal syntheses resulted in multiple phases with the formation of secondary oxide phases. Well-crystallised cubic UO2+x (space group Fm![[3 with combining macron]](https://www.rsc.org/images/entities/char_0033_0304.gif) m) and poorly crystallized nanometric cubic (Zr,U)O2+x (space group Fm
m) and poorly crystallized nanometric cubic (Zr,U)O2+x (space group Fm![[3 with combining macron]](https://www.rsc.org/images/entities/char_0033_0304.gif) m) were simultaneously obtained. For uranium contents above 70 mol%, the silicate phase was no longer obtained, resulting only in the formation of a mixture of cubic UO2+x and cubic (Zr,U)O2+x.
m) were simultaneously obtained. For uranium contents above 70 mol%, the silicate phase was no longer obtained, resulting only in the formation of a mixture of cubic UO2+x and cubic (Zr,U)O2+x.
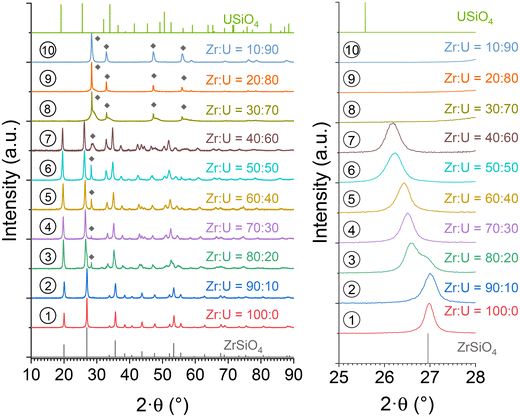 | ||
Fig. 1 PXRD patterns recorded for pristine (Zr,U)SiO4 solid solutions of different chemical compositions prepared under hydrothermal conditions without purification (T = 250 °C, 7 days, pH = 3.0) from Zr + U and silicate concentrations of 0.2 mol L−1 for Zr![[thin space (1/6-em)]](https://www.rsc.org/images/entities/char_2009.gif) : :![[thin space (1/6-em)]](https://www.rsc.org/images/entities/char_2009.gif) U = 100 U = 100![[thin space (1/6-em)]](https://www.rsc.org/images/entities/char_2009.gif) : :![[thin space (1/6-em)]](https://www.rsc.org/images/entities/char_2009.gif) 0 (1), 90 0 (1), 90![[thin space (1/6-em)]](https://www.rsc.org/images/entities/char_2009.gif) : :![[thin space (1/6-em)]](https://www.rsc.org/images/entities/char_2009.gif) 10 (2), 80 10 (2), 80![[thin space (1/6-em)]](https://www.rsc.org/images/entities/char_2009.gif) : :![[thin space (1/6-em)]](https://www.rsc.org/images/entities/char_2009.gif) 20 (3), 70 20 (3), 70![[thin space (1/6-em)]](https://www.rsc.org/images/entities/char_2009.gif) : :![[thin space (1/6-em)]](https://www.rsc.org/images/entities/char_2009.gif) 30 (4), 60 30 (4), 60![[thin space (1/6-em)]](https://www.rsc.org/images/entities/char_2009.gif) : :![[thin space (1/6-em)]](https://www.rsc.org/images/entities/char_2009.gif) 40 (5), 50 40 (5), 50![[thin space (1/6-em)]](https://www.rsc.org/images/entities/char_2009.gif) : :![[thin space (1/6-em)]](https://www.rsc.org/images/entities/char_2009.gif) 50 (6), 40 50 (6), 40![[thin space (1/6-em)]](https://www.rsc.org/images/entities/char_2009.gif) : :![[thin space (1/6-em)]](https://www.rsc.org/images/entities/char_2009.gif) 60 (7), 30 60 (7), 30![[thin space (1/6-em)]](https://www.rsc.org/images/entities/char_2009.gif) : :![[thin space (1/6-em)]](https://www.rsc.org/images/entities/char_2009.gif) 70 (8), 20 70 (8), 20![[thin space (1/6-em)]](https://www.rsc.org/images/entities/char_2009.gif) : :![[thin space (1/6-em)]](https://www.rsc.org/images/entities/char_2009.gif) 80 (9) and 10 80 (9) and 10![[thin space (1/6-em)]](https://www.rsc.org/images/entities/char_2009.gif) : :![[thin space (1/6-em)]](https://www.rsc.org/images/entities/char_2009.gif) 90 (10). The presence of (Zr,U)O2+x (fluorite-type) is indicated by diamond symbols in the PXRD patterns. The Bragg positions of the characteristic peaks of ZrSiO4 and USiO4 have been extracted from ref. 89 and 90, respectively. 90 (10). The presence of (Zr,U)O2+x (fluorite-type) is indicated by diamond symbols in the PXRD patterns. The Bragg positions of the characteristic peaks of ZrSiO4 and USiO4 have been extracted from ref. 89 and 90, respectively. | ||
Rietveld refinements were performed on all pristine (prior to any purification or annealing) solid solutions. Irrespective of the potential hydration rate of the zircon-type phases, the (Zr,U)SiO4 unit cell parameters were found to approximately follow Vegard's (regarding linear variation over the lattice parameters) and Retger's (regarding pseudo-linear volume variation over the lattice volume) laws that assume a close-to-ideal solid solution (Fig. 2 and Table SI 2†). This result is in very good agreement with progressive substitution of zirconium by uranium in the zircon-type structure with maximum insertion molar ratios of up to 50–60 mol%, which are far above the maximum insertion rates reported in the literature (i.e. 25 mol% (ref. 82)). This also demonstrates that, despite the thermodynamic instability of these compounds,71 the (Zr,U)SiO4 solid solution exhibits close-to-ideal solubility behaviour from a structural point of view.
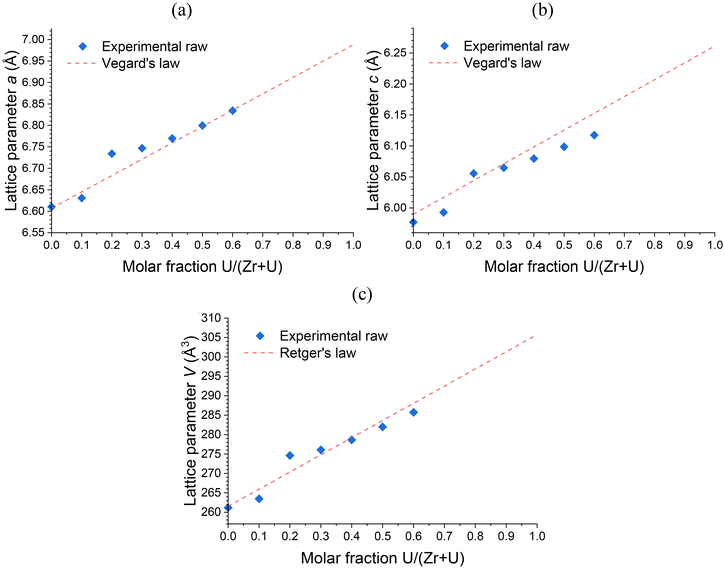 | ||
| Fig. 2 Unit cell parameters a (a) and c (b) and volume V (c) of the zircon-type phase obtained by Rietveld refinements performed on PXRD patterns of pristine (Zr,U)SiO4 solid solutions prepared under hydrothermal conditions without purification (T = 250 °C, 7 days, pH = 3.0) starting with Zr + U and silicate concentrations of 0.2 mol L−1 with different chemical compositions. Reference lattice parameters for the Vegard's and the Retger's laws have been obtained from ref. 70 and 74. | ||
Rietveld refinements were carried out on the secondary oxide phases (Fig. SI 1 and Table SI 3†). This allowed the identification of the two phases to be confirmed:
- The first phase, fairly well-crystallised, obtained for U/(Zr + U) molar fractions ranging from 20 to 90 mol%, corresponding to UO2+x (or to (U,Zr)O2+x with a very small amount of zirconium inserted in the UO2 lattice).
- The second phase, poorly crystallised or nanometric, was obtained for a U/(Zr + U) molar fraction between 50 and 90 mol%, corresponding to (Zr,U)O2+x. The zirconium insertion in the UO2 lattice could be estimated to correspond to a Zr/(Zr + U) molar fraction as high as 25–30 mol%.
From an experimental point of view, the formation of the (Zr,U)O2+x phase could correspond to a kinetically formed by-product due to the difficulty of obtaining the (Zr,U)SiO4 species under the experimental conditions considered. On the other hand, the UO2+x phases could originate from a dissolution and reprecipitation process involving (Zr,U)SiO4 or (Zr,U)O2+x species and as a thermodynamic product under the synthesis conditions. This interpretation could be supported by the fact that the observed (Zr,U)SiO4 and (Zr,U)O2+x species have U/(Zr + U) molar ratios very close to the experimentally expected values.
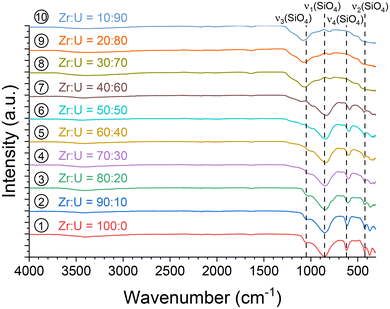
Infrared spectroscopy characterisation was performed for all samples (Fig. 3), and the characteristic features of SiO4 modes were observed in the spectra for molar fraction U/(Zr + U) values, ranging from 0 to 60 mol%, allowing the formation of the (Zr,U)SiO4 phase to be confirmed under these conditions. The symmetric ν1 and antisymmetric ν3 stretching modes were located close to 860–850 cm−1 and 1050–980 cm−1, respectively. The antisymmetric bending mode ν4 was identified around 620–590 cm−1 and the symmetric bending mode ν2 at around 430 cm−1. In addition, the antisymmetric and symmetric bending modes of SiO2 were clearly observed at 1070 and 800 cm−1, respectively, for the samples with U/(Zr + U) molar fractions above 60 mol%.
As the ν4 vibrational mode shows significant variation and is easily identifiable in infrared spectroscopy (Fig. 4), it could be used to assess the incorporation rate of U into (Zr,U)SiO4. Comparison with the ν4 band position for a reference USiO4 sample (ν4 = 569 cm−1) and reported in the literature for ZrSiO4 (ν4 = 620 cm−1)91 allows a linear relationship of the band position with the molar fraction U/(Zr + U) from 0 to 60 mol% (Fig. 4 and Fig. SI 2†). These results support the hypothesis of a progressive substitution of zirconium by uranium in the zircon-type structure with a maximum inserted molar fraction of up to 50–60 mol%.
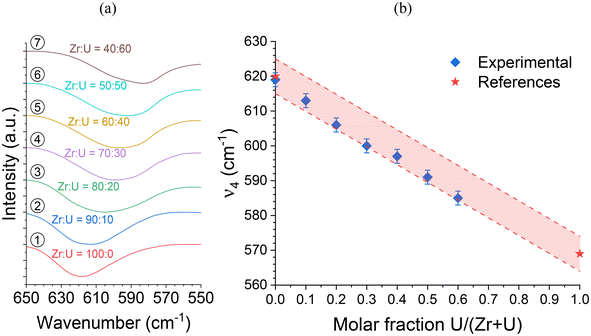 | ||
Fig. 4 (a) Infrared spectra of the SiO4 group ν4 band recorded for pristine (Zr,U)SiO4 solid solutions with different chemical compositions prepared under hydrothermal conditions without purification (T = 250 °C, 7 days, pH = 3.0) from Zr + U and silicate concentrations of 0.2 mol L−1 for Zr![[thin space (1/6-em)]](https://www.rsc.org/images/entities/char_2009.gif) : :![[thin space (1/6-em)]](https://www.rsc.org/images/entities/char_2009.gif) U = 100 U = 100![[thin space (1/6-em)]](https://www.rsc.org/images/entities/char_2009.gif) : :![[thin space (1/6-em)]](https://www.rsc.org/images/entities/char_2009.gif) 0 (1), 90 0 (1), 90![[thin space (1/6-em)]](https://www.rsc.org/images/entities/char_2009.gif) : :![[thin space (1/6-em)]](https://www.rsc.org/images/entities/char_2009.gif) 10 (2), 80 10 (2), 80![[thin space (1/6-em)]](https://www.rsc.org/images/entities/char_2009.gif) : :![[thin space (1/6-em)]](https://www.rsc.org/images/entities/char_2009.gif) 20 (3), 70 20 (3), 70![[thin space (1/6-em)]](https://www.rsc.org/images/entities/char_2009.gif) : :![[thin space (1/6-em)]](https://www.rsc.org/images/entities/char_2009.gif) 30 (4), 60 30 (4), 60![[thin space (1/6-em)]](https://www.rsc.org/images/entities/char_2009.gif) : :![[thin space (1/6-em)]](https://www.rsc.org/images/entities/char_2009.gif) 40 (5), 50 40 (5), 50![[thin space (1/6-em)]](https://www.rsc.org/images/entities/char_2009.gif) : :![[thin space (1/6-em)]](https://www.rsc.org/images/entities/char_2009.gif) 50 (6), 40 50 (6), 40![[thin space (1/6-em)]](https://www.rsc.org/images/entities/char_2009.gif) : :![[thin space (1/6-em)]](https://www.rsc.org/images/entities/char_2009.gif) 60 (7), 30 60 (7), 30![[thin space (1/6-em)]](https://www.rsc.org/images/entities/char_2009.gif) : :![[thin space (1/6-em)]](https://www.rsc.org/images/entities/char_2009.gif) 70 (8), 20 70 (8), 20![[thin space (1/6-em)]](https://www.rsc.org/images/entities/char_2009.gif) : :![[thin space (1/6-em)]](https://www.rsc.org/images/entities/char_2009.gif) 80 (9) and 10 80 (9) and 10![[thin space (1/6-em)]](https://www.rsc.org/images/entities/char_2009.gif) : :![[thin space (1/6-em)]](https://www.rsc.org/images/entities/char_2009.gif) 90 (10). (b) Position of the ν4 band as a function of the expected U/(Zr + U) molar fraction. The reference ZrSiO4ν4 band position has been taken from ref. 91. The shaded area corresponds to the expected linear variation of the ν4 band of the SiO4 group in IR spectroscopy, based on reference values reported in the literature, with a confidence interval of 5 cm−1. 90 (10). (b) Position of the ν4 band as a function of the expected U/(Zr + U) molar fraction. The reference ZrSiO4ν4 band position has been taken from ref. 91. The shaded area corresponds to the expected linear variation of the ν4 band of the SiO4 group in IR spectroscopy, based on reference values reported in the literature, with a confidence interval of 5 cm−1. | ||
In addition, the infrared spectra allowed the presence of residual water and/or hydroxyl groups in the pristine samples to be observed through the observation of associated weak bands in the 3700–2800 cm−1 region, with either being indicated by the water bending mode at 1638 cm−1 (Fig. 3), as was previously observed for ZrSiO4, CeSiO4, and USiO4.83,92
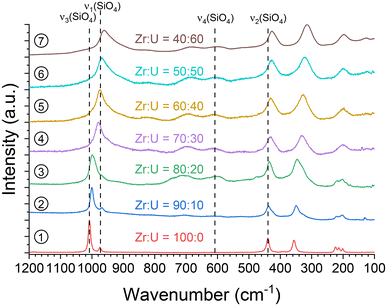
Raman characterisation was carried out on the samples showing the presence of the (Zr,U)SiO4 phase (Fig. 5). It allows the features of the SiO4 modes to be observed, with the symmetric ν1 and antisymmetric ν3 stretching modes located at 970–900 cm−1 and 1010–960 cm−1, respectively, and the ν2 symmetric bending mode around 440–420 cm−1. However, the ν3 mode was difficult to identify as this weak band is masked by the intense ν1 band. The ν4 antisymmetric mode is located close to 610 cm−1 but was difficult to observe due to its very low intensity. In addition, the internal modes of zircon silicate (below 400 cm−1) were also observed. Apart from these bands, a signal of very variable intensity was observed around 700 cm−1, as reported by Clavier et al.93 This band could be correlated to the optical emission of U(IV) in the zircon-type matrix with the laser radiation used (Nd:YAG at 532 nm).
In addition, since the position of the ν1 band can be easily determined and shows a strong variation from ZrSiO4 to USiO4, these positions were compared for all samples and allowed a linear relationship of the band position with the molar fraction U/(Zr + U) varying from 0 to 60 mol% to be observed (Fig. 6 and Fig. SI 3†). A similar behaviour was also observed for the position of the ν2 band (Fig. SI 4 and SI 5†). All these results support the hypothesis of uranium incorporation into the zircon structure.
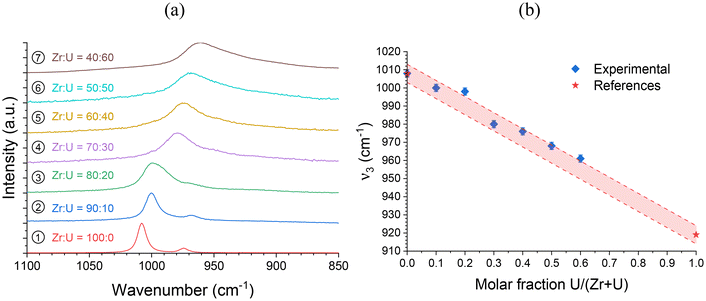 | ||
Fig. 6 (a) Raman spectra of the SiO4 group ν3 band recorded for pristine (Zr,U)SiO4 solid solutions of different chemical compositions prepared under hydrothermal conditions without purification (T = 250 °C, 7 days, pH = 3.0) starting with Zr + U and silicate concentrations of 0.2 mol L−1 for Zr![[thin space (1/6-em)]](https://www.rsc.org/images/entities/char_2009.gif) : :![[thin space (1/6-em)]](https://www.rsc.org/images/entities/char_2009.gif) U = 100 U = 100![[thin space (1/6-em)]](https://www.rsc.org/images/entities/char_2009.gif) : :![[thin space (1/6-em)]](https://www.rsc.org/images/entities/char_2009.gif) 0 (1), 90 0 (1), 90![[thin space (1/6-em)]](https://www.rsc.org/images/entities/char_2009.gif) : :![[thin space (1/6-em)]](https://www.rsc.org/images/entities/char_2009.gif) 10 (2), 80 10 (2), 80![[thin space (1/6-em)]](https://www.rsc.org/images/entities/char_2009.gif) : :![[thin space (1/6-em)]](https://www.rsc.org/images/entities/char_2009.gif) 20 (3), 70 20 (3), 70![[thin space (1/6-em)]](https://www.rsc.org/images/entities/char_2009.gif) : :![[thin space (1/6-em)]](https://www.rsc.org/images/entities/char_2009.gif) 30 (4), 60 30 (4), 60![[thin space (1/6-em)]](https://www.rsc.org/images/entities/char_2009.gif) : :![[thin space (1/6-em)]](https://www.rsc.org/images/entities/char_2009.gif) 40 (5), 50 40 (5), 50![[thin space (1/6-em)]](https://www.rsc.org/images/entities/char_2009.gif) : :![[thin space (1/6-em)]](https://www.rsc.org/images/entities/char_2009.gif) 50 (6) and 40 50 (6) and 40![[thin space (1/6-em)]](https://www.rsc.org/images/entities/char_2009.gif) : :![[thin space (1/6-em)]](https://www.rsc.org/images/entities/char_2009.gif) 60 (7). (b) Position of the ν3 band as a function of the expected U/(Zr + U) molar fraction. Reference ν3 band positions for ZrSiO4 and USiO4 have been taken from ref. 93. The shaded area corresponds to the expected linear variation of the ν3 band of the SiO4 group in Raman spectroscopy, based on reference values reported in the literature, with a confidence interval of 5 cm−1. 60 (7). (b) Position of the ν3 band as a function of the expected U/(Zr + U) molar fraction. Reference ν3 band positions for ZrSiO4 and USiO4 have been taken from ref. 93. The shaded area corresponds to the expected linear variation of the ν3 band of the SiO4 group in Raman spectroscopy, based on reference values reported in the literature, with a confidence interval of 5 cm−1. | ||
In order to obtain information on the morphology resulting from the synthesis, Zr0.8U0.2SiO4 (3), Zr0.6U0.4SiO4 (5) and Zr0.4U0.6SiO4 (7) pristine samples were observed by SEM (Fig. 7). It can be seen that the sample is composed of sub-micron particles (Fig. 7), with the samples doped with 20 mol% and 40 mol% uranium having a particle size below 100 nm with a fairly homogeneous size distribution (Fig. 7a and b). These particles have an angular shape, which may correspond to the characteristic square-based bipyramidal morphology of the silicate group compounds, although the very small particle size makes it difficult to confirm this result. On the other hand, the sample doped with 60 mol% uranium shows a spheroidal morphology with polycrystalline particles of about 500 nm (Fig. 7c). In addition, a halo, probably related to the presence of nanometric particles of uranium and zirconium–uranium oxides, can be observed for the 40 mol% and 60 mol% samples (Fig. 7b and c).
3.2. Purification procedure
In order to purify the samples from the secondary oxide phases, a dissolution procedure was developed based on that used for USiO4 and (Th,U)SiO4 solid solutions.49,86 All samples containing (Zr,U)SiO4 were washed by oxidative dissolution in weakly concentrated nitric acid reactive media using a gradual approach, depending on the chemical composition of the sample. This led to the selection of [HNO3] = 0.1 mol L−1, [HNO3] = 0.25 mol L−1 and [HNO3] = 1 mol L−1 washing media for Zr0.4U0.6SiO4, Zr0.5U0.5SiO4 and Zr1−xUxSiO4 (x ≤ 0.40), respectively. The washing process was stopped when the oxide phase was below the detection limit. This procedure allowed the dissolution of the oxide phases with fairly good selectivity, resulting in pure (Zr,U)SiO4 samples (Fig. 8). The unit cell parameters of the purified (Zr,U)SiO4 phases were determined again by the Rietveld refinement method (Table SI 2†) and showed no significant differences with respect to previously measured parameters. Infrared spectroscopic characterisation also showed no significant differences (Fig. SI 6† and Fig. 14).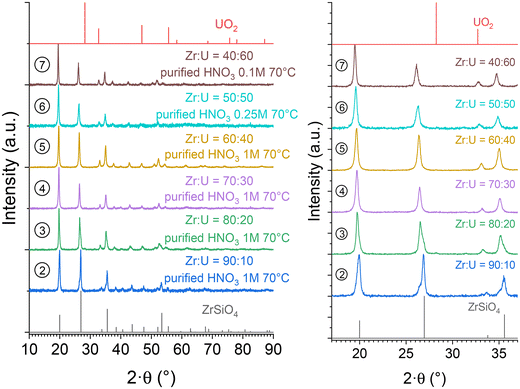 | ||
Fig. 8 PXRD patterns recorded for purified (Zr,U)SiO4 solid solutions of different chemical compositions prepared under hydrothermal conditions (T = 250 °C, 7 days, pH = 3.0) starting with Zr + U and silicate concentrations of 0.2 mol L−1 for Zr![[thin space (1/6-em)]](https://www.rsc.org/images/entities/char_2009.gif) : :![[thin space (1/6-em)]](https://www.rsc.org/images/entities/char_2009.gif) U = 90 U = 90![[thin space (1/6-em)]](https://www.rsc.org/images/entities/char_2009.gif) : :![[thin space (1/6-em)]](https://www.rsc.org/images/entities/char_2009.gif) 10 (2), 80 10 (2), 80![[thin space (1/6-em)]](https://www.rsc.org/images/entities/char_2009.gif) : :![[thin space (1/6-em)]](https://www.rsc.org/images/entities/char_2009.gif) 20 (3), 70 20 (3), 70![[thin space (1/6-em)]](https://www.rsc.org/images/entities/char_2009.gif) : :![[thin space (1/6-em)]](https://www.rsc.org/images/entities/char_2009.gif) 30 (4), 60 30 (4), 60![[thin space (1/6-em)]](https://www.rsc.org/images/entities/char_2009.gif) : :![[thin space (1/6-em)]](https://www.rsc.org/images/entities/char_2009.gif) 40 (5), 50 40 (5), 50![[thin space (1/6-em)]](https://www.rsc.org/images/entities/char_2009.gif) : :![[thin space (1/6-em)]](https://www.rsc.org/images/entities/char_2009.gif) 50 (6), and 40 50 (6), and 40![[thin space (1/6-em)]](https://www.rsc.org/images/entities/char_2009.gif) : :![[thin space (1/6-em)]](https://www.rsc.org/images/entities/char_2009.gif) 60 (7), and washed in nitric acid media. Bragg positions of the characteristic peaks of ZrSiO4 and UO2 have been extracted from ref. 89 and 94, respectively. 60 (7), and washed in nitric acid media. Bragg positions of the characteristic peaks of ZrSiO4 and UO2 have been extracted from ref. 89 and 94, respectively. | ||
In order to evaluate the effect of nitric acid washing on the morphology of the silicate phase, complementary SEM observations were carried out on the purified samples (Fig. 9). It was observed that there was no particular alteration feature or morphology changes on the largest particles compared to that observed in SEM on the pristine samples (Fig. 7). However, this seems difficult to confirm with certainty, given both the very small size of the particles observed and the magnification used in the observation. Nevertheless, the smallest particles previously observed on the uranium and zirconium–uranium oxide samples (and attributed to the oxide phases) were no longer observed in the purified samples, in agreement with the PXRD results.
 | ||
Fig. 9 SEM micrographs of purified (Zr,U)SiO4 solid solutions prepared under hydrothermal conditions (T = 250 °C, 7 days, pH = 3.0) starting with Zr + U and silicate concentrations of 0.2 mol L−1 for Zr![[thin space (1/6-em)]](https://www.rsc.org/images/entities/char_2009.gif) : :![[thin space (1/6-em)]](https://www.rsc.org/images/entities/char_2009.gif) U = 80 U = 80![[thin space (1/6-em)]](https://www.rsc.org/images/entities/char_2009.gif) : :![[thin space (1/6-em)]](https://www.rsc.org/images/entities/char_2009.gif) 20 (3) (a), 60 20 (3) (a), 60![[thin space (1/6-em)]](https://www.rsc.org/images/entities/char_2009.gif) : :![[thin space (1/6-em)]](https://www.rsc.org/images/entities/char_2009.gif) 40 (5) (b) and 40 40 (5) (b) and 40![[thin space (1/6-em)]](https://www.rsc.org/images/entities/char_2009.gif) : :![[thin space (1/6-em)]](https://www.rsc.org/images/entities/char_2009.gif) 60 (7) (c) and washed in nitric acid media. Observations at different magnifications are available in Fig. SI 7.† 60 (7) (c) and washed in nitric acid media. Observations at different magnifications are available in Fig. SI 7.† | ||
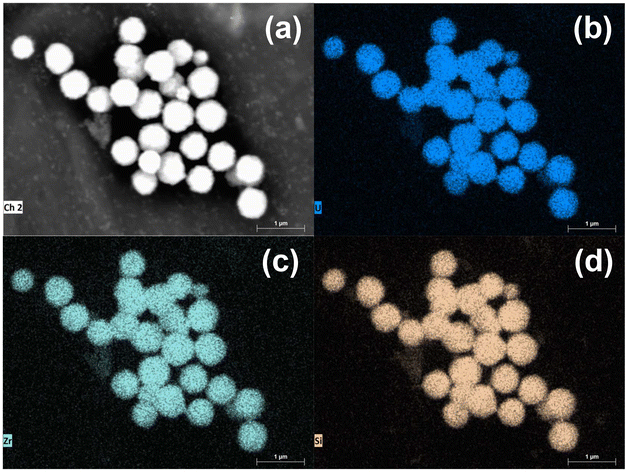
Elemental mapping was also carried out on the Zr0.4U0.6SiO4 sample (Fig. 10) using EDS. These measurements confirmed that the particles observed correspond to the zircon-type silicate phase and that zirconium and uranium are homogeneously distributed throughout the sample. EDS quantification performed on Zr0.8U0.2SiO4, Zr0.6U0.4SiO4 and Zr0.4U0.6SiO4 samples gave experimental molar ratios U/(Zr + U) of 29 ± 8 mol%, 47 ± 13 mol% and 60 ± 4 mol%, respectively. These results reflect the increase in uranium content in the sample. The experimental values are in the right order of magnitude (considering the uncertainties) but may vary significantly from the target values. These results and the associated uncertainties could be explained with synthesis parameters but they also reflect the limitations of such semi-quantitative analysis on nanometric samples. On the other hand, the EDS data treatment may also lead to an underestimation of the amount of uranium compared to zirconium.
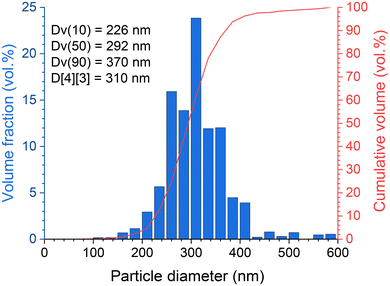
In addition, the particle size distribution was verified from SEM observations in the BSE (back scattering electron) mode and data treatment (based on 1734 identified particles) by computer processing using ImageJ/Fiji software. This confirmed that the (Zr,U)SiO4 sample has a relatively homogeneous particle size distribution with a mean size (volume ponderation) of 310 nm (Fig. 11).
3.3. Annealing of (Zr,U)SiO4
In order to assess the presence of water/hydroxyl groups in these compounds and to obtain anhydrous samples, the purified (Zr,U)SiO4 samples were characterised by TGA under an argon atmosphere up to 1000 °C (Fig. SI 8†). The argon atmosphere was chosen to prevent uranium(IV) oxidation, which could occur under an air atmosphere at high temperature. These analyses show that the dehydration/dehydroxylation process occurred in several steps for temperatures up to 700–800 °C for all samples with the water/hydroxo content corresponding to 2–3% of the initial sample mass. This progressive mass loss is in agreement with the previous studies which identified high-temperature water losses for the zircon-type systems due to the water/hydroxo content trapped in the [001] channels of the silicate phase.92 The presence of hydroxyl species has also been identified for USiO4 and is likely to occur for (Zr,U)SiO4 systems. Furthermore, it appears that the weight loss is negatively correlated with the expected uranium incorporation content.The thermally treated TGA residues were characterised by PXRD analyses; these analyses confirmed that the zircon-type phase was preserved under these conditions, both from uranium oxidation and from the degradation of the silicate structure to an oxide mixture (Fig. SI 9†). In order to obtain more information on the thermal stability of these phases at higher temperatures, (Zr,U)SiO4 samples were heated at 1200 °C under an argon–hydrogen atmosphere (Ar + H2 4%) with an isothermal step of 1 hour at the target temperature. No strong evidence of decomposition of the silicate phase into SiO2 and (Zr,U)O2 was observed from PXRD (Fig. 12), the presence of (Zr,U)O2 oxide as a minor phase for Zr0.7U0.3SiO4 being attributed to residual oxide remaining after an insufficient purification step.
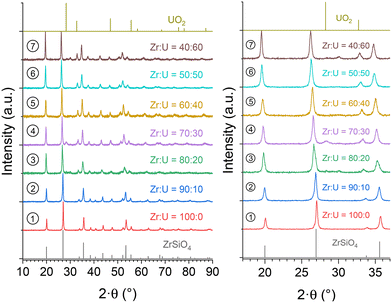 | ||
Fig. 12 PXRD patterns recorded for purified (Zr,U)SiO4 solid solutions calcined at 1200 °C under an Ar–H2 atmosphere with different chemical compositions prepared under hydrothermal conditions (T = 250 °C, 7 days, pH = 3.0) starting with Zr + U and silicate concentrations of 0.2 mol L−1 for Zr![[thin space (1/6-em)]](https://www.rsc.org/images/entities/char_2009.gif) : :![[thin space (1/6-em)]](https://www.rsc.org/images/entities/char_2009.gif) U = 90 U = 90![[thin space (1/6-em)]](https://www.rsc.org/images/entities/char_2009.gif) : :![[thin space (1/6-em)]](https://www.rsc.org/images/entities/char_2009.gif) 10 (2), 80 10 (2), 80![[thin space (1/6-em)]](https://www.rsc.org/images/entities/char_2009.gif) : :![[thin space (1/6-em)]](https://www.rsc.org/images/entities/char_2009.gif) 20 (3), 70 20 (3), 70![[thin space (1/6-em)]](https://www.rsc.org/images/entities/char_2009.gif) : :![[thin space (1/6-em)]](https://www.rsc.org/images/entities/char_2009.gif) 30 (4), 60 30 (4), 60![[thin space (1/6-em)]](https://www.rsc.org/images/entities/char_2009.gif) : :![[thin space (1/6-em)]](https://www.rsc.org/images/entities/char_2009.gif) 40 (5), 50 40 (5), 50![[thin space (1/6-em)]](https://www.rsc.org/images/entities/char_2009.gif) : :![[thin space (1/6-em)]](https://www.rsc.org/images/entities/char_2009.gif) 50 (6), and 40 50 (6), and 40![[thin space (1/6-em)]](https://www.rsc.org/images/entities/char_2009.gif) : :![[thin space (1/6-em)]](https://www.rsc.org/images/entities/char_2009.gif) 60 (7). The Bragg positions of the characteristic peaks of ZrSiO4 and UO2 have been taken from ref. 89 and 94, respectively. 60 (7). The Bragg positions of the characteristic peaks of ZrSiO4 and UO2 have been taken from ref. 89 and 94, respectively. | ||
Furthermore, Rietveld refinements carried out on heated samples showed a decrease in the unit cell parameter, which is characteristic of dehydration/dehydroxylation of zircon-type samples, but the data remained consistent with the results of uranium insertion into the ZrSiO4 structure. The uranium content in the (Zr,U)SiO4 solid solution does not seem to be significantly affected by the purification process or by heating treatment up to 1200 °C (Fig. 13).
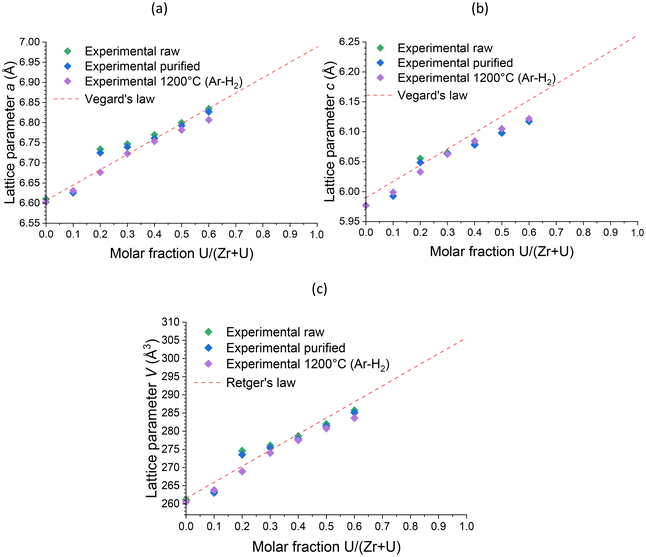 | ||
| Fig. 13 Unit cell parameters a (a) and c (b) and volume V (c) of the zircon-type phase obtained by Rietveld refinements performed on PXRD patterns of pristine, purified and calcined at 1200 °C (Zr,U)SiO4 solid solutions prepared under hydrothermal conditions (T = 250 °C, 7 days, pH = 3.0) starting with Zr + U and silicate concentrations of 0.2 mol L−1 with different chemical compositions. Reference lattice parameters for Vegard's and the Retger's laws have been obtained from ref. 70 and 74. | ||
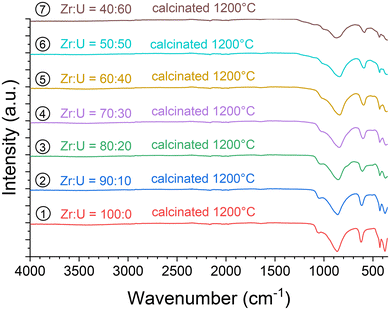
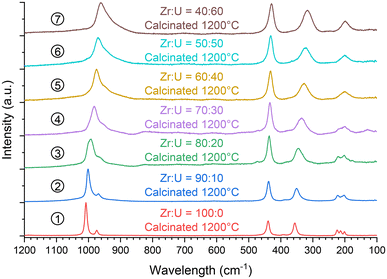
In addition, the samples calcinated at 1200 °C were characterised using vibrational spectroscopy techniques. Both infrared (Fig. 14) and Raman (Fig. 15) spectra were in agreement with the results of PXRD. Both sets of spectra show the characteristic bands of the silicate groups in the (Zr,U)SiO4 structure without any significant shift with respect to the position determined for the pristine samples (which could have indicated changes in the phase composition) (Fig. SI 10–SI 12†). Furthermore, the characteristic T2g band of the cubic uranium oxide is not observed in the Raman spectra, suggesting an amount below the detection limit of potential oxide phases. Finally, the infrared spectra show dehydration/dehydroxylation of the samples as the characteristic bands of water/hydroxyl groups (weak bands in the 3700–2800 cm−1 region) are no longer observed.
4. Conclusion
Based on the results previously reported in the literature,83 the synthesis of (Zr,U)SiO4 solid solutions was studied under soft hydrothermal conditions (T = 250 °C, 7 days holding time, CZr+U = 0.2 mol L−1, pH = 3.0). These conditions allowed the formation of (Zr,U)SiO4 samples with uranium contents up to 60 mol%, well above the previously reported maximum insertion rate (i.e. 25 mol%)82 and the calculated thermodynamic stability limit for this solid solution.71 This result was confirmed by PXRD, infrared spectroscopy and Raman spectroscopy.Furthermore, since the as-prepared samples contained secondary oxide phases, a purification procedure based on nitric acid washes was established, which allowed the preparation of oxide-free (Zr,U)SiO4 samples. These purified samples were then characterised by thermogravimetric analysis. On the one hand, it was observed that the total water content of the hydrothermally synthesised (Zr,U)SiO4 samples decreases with an increasing uranium insertion rate. On the other hand, it has been shown that uranium-rich zircon-type phases, with up to 60 mol% uranium, remain stable up to 1200 °C under a reducing atmosphere (Ar–H2), allowing dehydrated samples to be obtained.
These results represent major steps forward in the study of (Zr,An)SiO4 solid solutions, which are known to form under accidental conditions, and will allow direct evaluation of the properties of these solid solutions. In this perspective, a complementary calorimetric study is underway to learn more about the thermodynamic parameters of (Zr,U)SiO4, such as enthalpy of formation and enthalpy of mixing.
Data availability
The data supporting this article have been included as part of the ESI.†Conflicts of interest
The authors declare no competing financial interest.Acknowledgements
The present work was supported by the EPIC project funded by the French NEEDS (Nucléaire: Energie, Environnement, Déchets, Société) program (CNRS, CEA, ANDRA, BRGM, EDF, FRAMATOME, IRSN, ORANO).References
- L. T. White and T. R. Ireland, Chem. Geol., 2012, 306–307, 78–91 CrossRef CAS.
- P. A. Nevolko, T. V. Svetlitskaya, A. A. Savichev, V. S. Vesnin and P. A. Fominykh, Ore Geol. Rev., 2021, 139, 104532 CrossRef.
- R. C. Ewing, A. Meldrum, L. M. Wang, W. J. Weber and L. R. Corrales, Rev. Mineral. Geochem., 2003, 53, 388–425 CrossRef.
- P. W. O. Hoskin and U. Schaltegger, Rev. Mineral. Geochem., 2003, 53, 27–62 CrossRef CAS.
- L. Nasdala, J. M. Hanchar, D. Rhed, A. K. Kennedy and T. Váczi, Chem. Geol., 2010, 269, 290–300 CrossRef CAS.
- K. Breiter, H. J. Förster and R. Skoda, Lithos, 2006, 88, 15–34 CrossRef CAS.
- E. V. Shalaeva, A. M. Murzakaev, V. V. Makarov, V. G. Pushin, D. A. Zamyatin, Y. V. Shchapova and S. L. Votyakov, Glass Phys. Chem., 2015, 41, 389–397 CrossRef CAS.
- S. Moorbath, Nature, 1986, 321, 725 CrossRef.
- J. W. Valley, A. J. Cavosie, T. Ushikubo, D. A. Reinhard, D. F. Lawrence, D. J. Larson, P. H. Clifton, T. F. Kelly, S. A. Wilde, D. E. Moser and M. J. Spicuzza, Nat. Geosci., 2014, 7, 219–223 CrossRef CAS.
- D. O. Froude, T. R. Ireland, P. D. Kinny, I. S. Williams, W. Compston, I. R. Williams and J. S. Myers, Nature, 1983, 304, 616–618 CrossRef CAS.
- R. Maas, P. D. Kinny, I. S. Williams, D. O. Froude and W. Compston, Geochim. Cosmochim. Acta, 1992, 56, 1281–1300 CrossRef CAS.
- W. J. Weber, J. Am. Ceram. Soc., 1993, 76, 1729–1738 CrossRef CAS.
- T. Murakami, B. C. Chakoumakos, R. C. Ewing, G. R. Lumpkin and W. J. Weber, Am. Mineral., 1991, 76, 1510–1532 CAS.
- W. J. Weber, R. C. Ewing and L. M. Wang, J. Mater. Res., 1994, 9, 688–698 CrossRef CAS.
- H. D. Holland and D. Gottfried, Acta Crystallogr., 1955, 8, 291–300 CrossRef CAS.
- S. Rios, E. K. H. Salje, M. Zhang and R. C. Ewing, J. Phys.: Condens. Matter, 2000, 12, 2401–2412 CrossRef CAS.
- J. A. Woodhead, G. R. Rossman and L. T. Silver, Am. Mineral., 1991, 76, 74–82 CAS.
- A. E. Marsellos and J. I. Garver, Am. Mineral., 2010, 95, 1192–1201 CrossRef CAS.
- G. C. Capitani, H. Leroux, J. C. Doukhan, S. Rios, M. Zhang and E. K. H. Salje, Phys. Chem. Miner., 2000, 27, 545–556 CrossRef CAS.
- T. Geisler, B. E. Burakov, V. Zirlin, L. Nikolaeva and P. Pöml, Eur. J. Mineral., 2005, 17, 883–894 CrossRef CAS.
- T. Geisler, M. Zhang and E. K. H. Salje, J. Nucl. Mater., 2003, 320, 280–291 CrossRef CAS.
- M. Zhang, E. K. H. Salje, G. C. Capitani, H. Leroux, A. M. Clark, J. Schlüter and R. C. Ewing, J. Phys.: Condens. Matter, 2000, 12, 3131–3148 CrossRef CAS.
- T. Geisler, A. M. Seydoux-Guillaume, M. Wiedenbeck, R. Wirth, J. Berndt, M. Zhang, B. Mihailova, A. Putnis, E. K. H. Salje and J. Schlüter, Am. Mineral., 2004, 89, 1341–1347 CrossRef CAS.
- E. B. Anderson, B. E. Burakov and E. M. Pazukhin, Radiochim. Acta, 1993, 60, 149–151 CrossRef CAS.
- P. C. Burns, R. C. Ewing and A. Navrotsky, Science, 2012, 335, 1184–1188 CrossRef CAS PubMed.
- B. E. Burakov, E. B. Anderson, S. I. Shabalev, E. E. Strykanova, S. V. Ushakov, M. Trotabas, J. Y. Blanc, P. Winter and J. Duco, Mater. Res. Soc. Symp. Proc., 1997, 465, 1297–1308 CrossRef CAS.
- E. M. Pazukhin, Radiochemistry, 2008, 50, 324–331 CrossRef CAS.
- A. A. Shiryaev, I. E. Vlasova, B. E. Burakov, B. I. Ogorodnikov, V. O. Yapaskurt, A. A. Averin, A. V. Pakhnevich and Y. V. Zubavichus, Prog. Nucl. Energy, 2016, 92, 104–118 CrossRef CAS.
- B. E. Burakov, E. B. Anderson, B. Y. Galkin, E. M. Pazukhin and S. I. Shabalev, Radiochim. Acta, 1994, 65, 199–202 CrossRef CAS.
- B. E. Burakov , in Proceedings of International Conference SAFE WASTE-93, 1993, vol. 2, pp. 19–28.
- B. E. Burakov, E. E. Strykanova and E. B. Anderson, Mater. Res. Soc. Symp. Proc., 1997, 465, 1309–1311 CrossRef CAS.
- P. Pöml, B. Burakov, T. Geisler, C. T. Walker, M. L. Grange, A. A. Nemchin, J. Berndt, R. O. C. Fonseca, P. D. W. Bottomley and R. Hasnaoui, J. Nucl. Mater., 2013, 439, 51–56 CrossRef.
- I. Vlasova, A. Shiryaev, B. Ogorodnikov, B. Burakov, E. Dolgopolova, R. Senin, A. Averin, Y. Zubavichus and S. Kalmykov, Radiat. Meas., 2015, 83, 20–25 CrossRef CAS.
- T. Kitagaki, K. Yano, H. Ogino and T. Washiya, J. Nucl. Mater., 2017, 486, 206–215 CrossRef CAS.
- Y. Ohishi, Y. Sun, Y. Ooi and H. Muta, J. Nucl. Mater., 2021, 556, 153160 CrossRef CAS.
- C. Journeau, Ph.D. Thesis, Université d'Orléans, 2006.
- S. T. Barlow, D. J. Bailey, A. J. Fisher, M. C. Stennett, C. Gausse, H. Ding, V. A. Krasnov, S. Y. Sayenko, N. C. Hyatt and C. L. Corkhill, npj Mater. Degrad., 2020, 4, 3 CrossRef CAS.
- A. C. Strzelecki, X. Zhao, P. Estevenon, H. Xu, N. Dacheux, R. C. Ewing and X. Guo, Am. Mineral., 2024, 109, 225–242 CrossRef.
- C. Keller, Nukleonik, 1963, 5, 41–48 CAS.
- J. A. Speer, Rev. Mineral. Geochem., 1980, 5, 113–135 CAS.
- J. A. Speer and B. J. Cooper, Am. Mineral., 1982, 67, 804–808 CAS.
- J. M. S. Skakle, C. L. Dickson and F. P. Glasser, Powder Diffr., 2000, 15, 234–238 CrossRef CAS.
- J. C. Ayers and E. B. Watson, Philos. Trans. R. Soc., A, 1991, 335, 365–375 CrossRef CAS.
- R. C. Newton, C. E. Manning, J. M. Hanchar and R. J. Finch, J. Am. Ceram. Soc., 2005, 88, 1854–1858 CrossRef CAS.
- M. P. Tole, Geochim. Cosmochim. Acta, 1985, 49, 453–458 CrossRef CAS.
- T. E. Krogh, Geotimes, 1995, 40, 20–22 Search PubMed.
- R. C. Ewing, R. F. Haaker and W. Lutze, Mater. Res. Soc. Symp. Proc., 1982, 11, 389–396 CrossRef CAS.
- D. T. Costin, Ph.D. Thesis, Université de Montpellier 2, 2012.
- S. Szenknect, A. Mesbah, T. Cordara, N. Clavier, H. P. Brau, X. Le Goff, C. Poinssot, R. C. Ewing and N. Dacheux, Geochim. Cosmochim. Acta, 2016, 181, 36–53 CrossRef CAS.
- R. C. Ewing, Proc. Natl. Acad. Sci. U. S. A., 1999, 96, 3432–3439 CrossRef CAS PubMed.
- R. C. Ewing, Canad. Mineral., 2001, 39, 697–715 CrossRef CAS.
- R. C. Ewing, C. R. Geosci., 2011, 343, 219–229 CrossRef CAS.
- R. C. Ewing, Nat. Mater., 2015, 14, 252–257 CrossRef CAS PubMed.
- R. C. Ewing, W. Lutze and W. J. Weber, J. Mater. Res., 1995, 10, 243–246 CrossRef CAS.
- R. C. Ewing, W. J. Weber and W. Lutze, in Disposal of weapon plutonium, 1996, pp. 65–83 Search PubMed.
- B. E. Burakov and E. B. Anderson, in Proceedings of International Conference NUCEF'98, 1990, pp. 295–306.
- B. E. Burakov, E. B. Anderson, B. Y. Galkin, V. A. Starchenko and V. G. Vasiliev, Disposal of weapons plutonium, 1996, pp. 85–89 Search PubMed.
- B. E. Burakov, E. B. Anderson, V. S. Rovsha, S. V. Ushakov, R. C. Ewing, W. Lutze and W. J. Weber, Mater. Res. Soc. Symp. Proc., 1996, 412, 33–39 CrossRef CAS.
- B. E. Burakov, J. M. Hanchar, M. V. Zamoryanskaya, V. M. Garbuzov and V. A. Zirlin, Radiochim. Acta, 2002, 90, 95–97 CrossRef CAS.
- E. B. Anderson, B. E. Burakov and L. J. Jardine, Synthesis of Pu-Doped Ceramic, Lawrence Livermore National Laboratory, 1998 Search PubMed.
- B. D. Begg, N. J. Hess, W. J. Weber, S. D. Conradson, M. J. Schweiger and R. C. Ewing, J. Nucl. Mater., 2000, 278, 212–224 CrossRef CAS.
- W. Lutze and R. C. Ewing, Radioactive waste forms for the future, 1988 Search PubMed.
- W. Lutze, R. C. Ewing, K. B. Helean and W. L. Gong, University of New Mexico report, 1999 Search PubMed.
- W. Lutze, W. L. Gong and R. C. Ewing, The Environmental Challenges of Nuclear Disarmament, 2000, pp. 65–74 Search PubMed.
- W. J. Weber, R. C. Ewing and W. Lutze, NATO Workshop on Disposal of Weapons Plutonium, 1995 Search PubMed.
- W. J. Weber, R. C. Ewing and W. Lutze, Mater. Res. Soc. Symp. Proc., 1996, 412, 25–32 CrossRef CAS.
- S. V. Ushakov, W. L. Gong, M. M. Yagovkina, K. B. Helean, W. Lutze and R. C. Ewing, Ceram. Trans., 1999, 93, 357–363 CAS.
- R. D. Shannon, Acta Crystallogr., Sect. A: Cryst. Phys., Diffr., Theor. Gen. Crystallogr., 1976, 32, 751–767 CrossRef.
- R. Caruba, A. Baumer and G. Turco, Geochim. Cosmochim. Acta, 1975, 39, 11–26 CrossRef CAS.
- R. J. Finch and J. M. Hanchar, Rev. Mineral. Geochem., 2003, 53, 1–25 CrossRef CAS.
- E. D. A. Ferriss, R. C. Ewing and U. Becker, Am. Mineral., 2010, 95, 229–241 CrossRef CAS.
- S. Labs, Schriften des Forschungszentrums Jülich, 2015, p. 267 Search PubMed.
- S. Labs, C. Hennig, S. Weiss, H. Curtius, H. Zänker and D. Bosbach, Environ. Sci. Technol., 2014, 48, 854–860 CrossRef CAS PubMed.
- A. Mesbah, S. Szenknect, N. Clavier, J. Lozano-Rodriguez, C. Poinssot, C. Den Auwer, R. C. Ewing and N. Dacheux, Inorg. Chem., 2015, 54, 6687–6696 CrossRef CAS PubMed.
- X. Guo, S. Szenknect, A. Mesbah, S. Labs, N. Clavier, C. Poinssot, S. V. Ushakov, H. Curtius, D. Bosbach, R. C. Ewing, P. C. Burns, N. Dacheux and A. Navrotsky, Proc. Natl. Acad. Sci. U. S. A., 2015, 112, 6551–6555 CrossRef CAS PubMed.
- C. L. Dickson and F. P. Glasser, Cem. Concr. Res., 2000, 30, 1619–1623 CrossRef CAS.
- P. Estevenon, T. Kaczmarek, F. Vadot, T. Dumas, P. L. Solari, E. Welcomme, S. Szenknect, A. Mesbah, P. Moisy, C. Poinssot and N. Dacheux, Dalton Trans., 2019, 48, 10455–10463 RSC.
- P. Estevenon, E. Welcomme, S. Szenknect, A. Mesbah, P. Moisy, C. Poinssot and N. Dacheux, Dalton Trans., 2019, 48, 7551–7559 RSC.
- A. C. Strzelecki, C. Bourgeois, K. W. Kriegsman, P. Estevenon, N. Wei, S. Szenknect, A. Mesbah, D. Wu, R. C. Ewing, N. Dacheux and X. Guo, Inorg. Chem., 2020, 59, 13174–13183 CrossRef CAS PubMed.
- C. Frondel and R. L. Collette, Am. Mineral., 1957, 42, 759–765 CAS.
- F. A. Mumpton and R. Roy, Geochim. Cosmochim. Acta, 1961, 21, 217–238 CrossRef CAS.
- S. V. Ioudintsev, B. I. Omelianenko and M. I. Lapina, Mater. Res. Soc. Symp. Proc., 1998, 506, 185–189 CrossRef CAS.
- T. Barral, P. Estevenon, Y. Chanteau, T. Kaczmarek, A. C. Strzelecki, D. Menut, E. Welcomme, S. Szenknect, P. Moisy, X. Guo and N. Dacheux, Dalton Trans., 2023, 52, 10023–10037 RSC.
- N. Dacheux, V. Brandel and M. Genet, New J. Chem., 1995, 19, 15–25 CAS.
- R. K. Iler, The chemistry of silica: solubility, polymerization, colloid and surface properties, and biochemistry, John Wiley & Sons, Hoboken, NJ, 1979 Search PubMed.
- N. Clavier, S. Szenknect, D. T. Costin, A. Mesbah, J. Ravaux, C. Poinssot and N. Dacheux, J. Nucl. Mater., 2013, 441, 73–83 CrossRef CAS.
- C. Frontera and J. Rodriguez-Carvajal, Phys. B, 2003, 335, 219–222 CrossRef CAS.
- J. Schindelin, I. Arganda-Carreras, E. Frise, V. Kaynig, M. Longair, T. Pietzsch, S. Preibisch, C. Rueden, S. Saalfeld, B. Schmid, J.-Y. Tinevez, D. J. White, V. Hartenstein, K. Eliceiri, P. Tomancak and A. Cardona, Nat. Methods, 2012, 9, 676–682 CrossRef CAS PubMed.
- R. J. Finch, J. M. Hanchar, P. W. O. Hoskin and P. C. Burns, Am. Mineral., 2001, 86, 681–689 CrossRef CAS.
- L. H. Fuchs and E. Gebert, Am. Mineral., 1958, 43, 243–248 CAS.
- P. Dawson, M. M. Hargreave and G. R. Wilkinson, J. Phys. C: Solid State Phys., 1971, 4, 240–256 CrossRef CAS.
- A. C. Strzelecki, T. Barral, P. Estevenon, A. Mesbah, V. Goncharov, J. Baker, J. Bai, N. Clavier, S. Szenknect, A. Migdisov, H. Xu, R. C. Ewing, N. Dacheux and X. Guo, Inorg. Chem., 2021, 60, 718–735 CrossRef CAS PubMed.
- N. Clavier, S. Szenknect, D. T. Costin, A. Mesbah, C. Poinssot and N. Dacheux, Spectrochim. Acta, Part A, 2014, 118, 302–307 CrossRef CAS PubMed.
- H. Weitzel and C. Keller, J. Solid State Chem., 1973, 13, 136–141 CrossRef.
Footnote |
| † Electronic supplementary information (ESI) available. See DOI: https://doi.org/10.1039/d4dt01604a |
| This journal is © The Royal Society of Chemistry 2024 |

