 Open Access Article
Creative Commons Attribution 3.0 Unported Licence
Probing the protonation and reduction of heptavalent neptunium with computational guidance†
Grant C.
Benthin‡
 a,
Harindu
Rajapaksha‡
 a,
Emma L.
Markun
 a,
Sara E.
Mason
*ab and
Tori Z.
Forbes
 *a
*a
aDepartment of Chemistry, University of Iowa, Iowa City, IA 52242, USA. E-mail: tori-forbes@uiowa.edu
bCenter for Functional Nanomaterials, Brookhaven National Laboratory, Upton, NY 11973, USA. E-mail: smason@bnl.gov
First published on 19th September 2024
Abstract
Influence of pH on the speciation and stability of heptavalent neptunium is poorly understood although it is frequently invoked in the literature to explain experimental observations. The present study employs Density Functional Theory (DFT) methodology to assess the thermodynamic feasibility of protonation reactions for the Np(VII) anion complex and the impact on its reduction to Np(VI). This theoretical framework is then explored experimentally through the titration and systematic protonation of Np(VII) in solution and solid-state samples while monitoring them spectroscopically. Computational results reveal that protonation reactions with the axial OH− ligands of the Np(VII) anionic complex, [NpO4(OH)2]3−, are more thermodynamically favorable than the equatorial oxo ligands. In addition, DFT studies indicated that up to four sequential protonation reactions may be feasible before reduction becomes thermodynamically favorable. Experimental results also uncover that protonation leads to distinct changes in the observable vibrational signals and UV-Vis absorption features. Overall, we observed that the protonation of [NpO4(OH)2]3− in solution and in the solid-state occurs before reduction to the Np(VI)O22+ species.
1. Introduction
The aqueous chemistry of actinide elements, such as Neptunium (Np), presents a complex and intriguing chemical system due to the variable oxidation states these elements can adopt, leading to broad variations in their speciation and chemical behavior.1 Neptunium, in particular, is known to exist in multiple oxidation states (IV–VII) in aqueous media, with each state exhibiting distinct chemical properties and behaviors.1,2 Np(IV), Np(V), and Np(VI) are more studied, due in part to their relevance in spent nuclear fuel reprocessing systems, such as the Plutonium–Uranium Extraction (PUREX) process that operates under acidic conditions.3,4 Under these conditions, Np(IV) forms 8–10 coordinate species, whereas Np(V) and Np(VI) typically occur in a dioxo (Np(V/VI)O2+/2+) form.5 These species are typically soluble within acidic conditions, but as the pH increases, they commonly precipitate as hydroxide phases.6–9 In the case of Np(IV) and Np(VI), many of the resulting complexes in these systems are isostructural to the analogous uranium systems.10In contrast, Np(VII) behaves quite differently and cannot be compared to other early actinides. It is generally considered to be soluble under alkaline conditions and exists as a relatively stable tetragonal bipyramidal anionic complex [NpO4(OH)2]3− under highly alkaline conditions.11–14 This is different than what is observed for the highest valence state of uranium (U(VI)), which remains in a dioxo configuration even at high pH values.2 However, our understanding of Np(VII) chemistry and speciation, particularly under acidic or near-neutral conditions, is still underdeveloped and there is ambiguity to the stability field of Np(VII) in the current literature.15 Some attempts to form Np(VII) complexes under neutral or weakly acidic conditions indicated the formation of amorphous solids with the formula M(NpO4)2·nH2O (M = Mg, Ca, Sr, Ba), which are suggested to form 2-dimensional network structures consisting of Np(VII)O23+ cations that are each bound to four bridging O anions in the equatorial plane.16 This proposed structural description is largely based on combining the elemental composition (as determined by light absorption and gravimetric analysis) with the assignment of IR bands as the antisymmetric vibrations of atoms in Np(VII)O23+ groups. Very little is known about the mechanism through which this type of a structure would have formed, but one proposed mechanism involves protonating two oxo groups within the [NpO4(OH)2]3− moiety to yield [NpO2(OH)4]− as an intermediate.16 Descriptions from other literature sources suggest that under weakly basic, acidic, or reducing conditions, Np(VII) will rapidly undergo reduction to Np(VI).15,17,18 This reduction would clearly involve significant geometric rearrangement and the formation of multiple intermediate structures to transition from the tetragonal bipyramidal anionic complex of [NpO4(OH)2]3− with oxo ligands occupying the equatorial plane to the linear neptunyl Np(VI)O22+ cation with oxo bonds in the axial plane. However, little is known about these possible species, including any spectroscopic signals that could be associated with them or whether they are stable intermediate species.12
The present paper aims to address this gap in our understanding of Np(VII) chemistry as the system transitions from alkaline to near neutral conditions. Specifically, we assessed the thermodynamic feasibility of protonation reactions of the Np(VII) anion complex and investigated whether protonation would affect the redox chemistry of Np(VII) in the anionic complexes using Density Functional Theory (DFT) methodology. In addition, we utilize computational methods to identify spectroscopic signals that could be used to characterize the presence of protonated forms of the complex anions and then explore these systems experimentally with UV-Vis-NIR and Raman spectroscopy to confirm the theoretical predictions. In addition, we explored the protonation of Np(VII) in the solid-state through the spectral evaluation of [(Co(NH3)6)(NpO4(OH)2)]·nH2O (n = 2–4) in the presence of acid vapor.
2. Experiment
2.1. Computational details
Gaussian 16 software package19 was used to perform all geometry optimizations and vibrational analysis with molecular DFT. To model exchange correlation effects, the B3LYP (Becke, 3-parameter, Lee–Yang–Parr)20,21 hybrid function was used for the calculations. van der Waals dispersion correction methods DFT-D3 were again utilized with the Becke–Johnson damping term.22,23 The polarized triple zeta (def2-TZVP)24 basis set was utilized to represent the O and H, while the ECP60MWB pseudopotentials and ECP60MWB-SEG valence basis set were used for Np.25,26 Scalar relativistic effects are included by employing small-core Effective Core Potentials (ECPs), and the spin–orbital contribution to relativistic effects has been ignored. Solvation in water was simulated using the Integral Equation Formalism Polarizable Continuum Model (IEFPCM).27,28 All structures were optimized with no symmetry constrained to a tight convergence criterion. The calculated vibrational frequencies were monitored to ensure that structures were optimized to a true minimum. Structures manifesting imaginary frequencies underwent reoptimization with a finer integration grid and stringent convergence criteria (RMS force criterion of 1 × 10⁻⁶ Hartrees/Radians), ensuring their progression towards true minima without imaginary frequencies. Free energy of reactants and products are taken as implemented in Gaussian 16 package. Detailed description on calculation of thermochemical quantities in Gaussian are provided by Ochterski.29Time-dependent DFT (TD-DFT) of optimized structures were performed by ORCA 5.0.430 using B3LYP hybrid functional.20,21 Relativistic effects are included by Douglas–Kroll–Hess (DKH) Hamiltonian in combination with DKH-recontracted versions of the def2 basis sets. O and H atoms are represented by DKH-def2-TZVP basis set while Np atoms are represented by SARC-DKH-TZVP basis sets together with SARC/J coulomb-fitting auxiliary basis sets.31–34 Spin orbital coupling was as implemented in ORCA TD-DFT calculation.35 Integration grids (DefGrid3) and tight SCF convergence (1 × 10⁻⁸ Hartrees) were used throughout with spin–orbital coupling included in the calculation. For spectroscopic predictions, 20 excited states were calculated and the resulting UV absorption spectra was plotted with OriginPro 9.60 (OriginLab, Northampton, MA) 64-bit software.36
At the conclusion of each DFT calculation, the spin density of the molecule was analyzed to ensure that the oxidation state of the Np center remained consistent with the initial state. In all calculations, no changes in the oxidation state of the Np center were observed. A full table of spin densities is provided in ESI, Section 1.3, Table S54.†
2.2. Solution titration studies
CAUTION: Neptunium-237 ( 237 Np) is a highly radioactive isotope that should be restricted to specialized laboratories and handled under appropriate regulatory controls. Np(VII) stock in ∼0.85 M LiOH was prepared by ozonation of a suspension of neptunium(V) hydroxide. To prepare the neptunium(V) hydroxide suspension, 0.250 μL of 0.285 M Np(V) in ∼0.1 M HCl was mixed with 1750 μL of 1 M LiOH. A gas mixture, consisting of ∼5% O3 in O2, was subsequently bubbled through the suspension for 15 minutes with a gas flow rate of one L min−1. After the ozonation, the solution was centrifuged for five minutes at 5000 RPM and the supernatant was transferred into a fresh 15 mL centrifuge tube. The pH of the Np(VII) stock solution was 12.4.For the titration studies, the initial pH and spectroscopic measurements were taken in a solution containing 100 μl Np(VII) stock in 1900 μl of 0.9 M LiOH solution. The pH was measured using a calibrated Mettler Toledo LE422 pH electrode. A separate solution was made for the second titration step by adding 100 μl Np(VII) stock to 1900 μl of ultrapure Millipore water (18.2 MΩ). Remaining titration steps were performed according to the same procedure as the second step where 20, 40, 60, 70, 80, 85, 86, 87, 90 and 150 μl of 1 M HCl was added to the original Np(VII) stock solution. Ultrapure Millipore water was added to each to keep the total volume to 2000 μl.
2.3. Optical spectroscopy
Absorption spectra of the experimental solutions were recorded using a modular Ocean Optics set-up consisting of a combined deuterium and tungsten halogen light source (DH-2000-BAL) with a Flame series UV (Flame-S-XR1-ES) spectrometer for UV measurements, and a krypton light source (ECOVIS) with Flame series VIS (Flame-S-UV-VIS-ES) and NIR (Flame-NIR-INTSMA25) spectrometers for Vis-NIR measurements. A quartz cuvette with 1 cm path length was used during all optical spectroscopic measurements. Ultrapure Millipore water (18.2 MΩ) was used as a blank to confirm the spectral background between the runs. Due to the high molar absorptivity of Np(VII) solutions in the 200–650 nm region, all UV measurements were collected on samples that were diluted to 20% of their original Np concentration where the [OH−] was kept constant during the dilution.2.4. Raman spectroscopy
Raman spectra were collected using a SnRI High-Resolution Sierra 2.0 Raman spectrometer outfitted with a 786 nm laser and a 2048 pixel TE Cooled-CCD. For solution samples, the laser intensity was set to 100 mW and spectra were obtained with a 50–60s integration period. Solid-state spectra were obtained with a 60s integration period. Normalization, background subtraction, and spectral fitting of both solution and solid-state Raman measurements was performed using the Origin Pro software.362.5. Synthesis and reactivity of [(Co(NH3)6)(NpO4(OH)2)]·nH2O (n = 2–4)
[(Co(NH3)6)(NpO4(OH)2)]·nH2O (n = 2–4) was previously reported by Charushnikova et al.37 and crystals were synthesized in the present study using a modified procedure. Briefly, 75 μL of Np(VII) stock was diluted by adding 600 μL of 1 M LiOH, followed by the subsequent addition of 50 μL of 0.1 M (Co(NH3)6)Cl3 to the solution. Dark green, needles that were ∼50 μm in length were observed in solution within one minute of combining all reagents. Crystals were allowed to grow undisturbed for 20 minutes before being harvested by centrifuging the final suspension for 5 minutes at 5000 RPM and decanting off the supernatant. This procedure was repeated six times to grow a sufficient quantity of crystalline material for characterization by powder X-ray diffraction (PXRD) and subsequent solid-state Raman experiments.Samples for PXRD were prepared by mixing small samples of powder with a minimal amount of high viscosity oil to create a thick crystallite-oil slurry and a small clump of this slurry was mounted on a 50 μm Mitigen® MicroMount™. To minimize the risk of powder dispersal, a clear polyester capillary, sealed at one end, is placed over the MicroMount™ and attached to the narrowed neck of the goniometer base. X-ray diffraction data was collected at room temperature on a Brucker® D8 Quest single X-ray diffractometer (λMoKα = 0.71073 Å) with a PHOTON detector. Crystallographic data of this phase has been reported by Charushnikova et al.;37 thus, the resulting diffractogram was compared to the predicted powder pattern using the Mercury software.
To test reactivity and protonation of the solid form, approximately 10 mg of the [(Co(NH3)6)(NpO4(OH)2)]·nH2O (n = 2–4) crystals were placed on a glass slide. This slide was then placed in a glass Petri dish along with a glass vial filled with 1 mL of 5 M HCl solution, covered, and solid-state Raman spectra were collected for 24 h. Solid-state Raman measurements were done using orbital raster scanning (resulting in collection of data across a 5 mm2 area rather than a single focused point). The laser intensity was also reduced to 53.3 mW to prevent heat related sample degradation.
3. Results and Discussion
3.1. Computational insight into Np(VII) protonation
 | (1) |
In the first step, the axial OH− of the [NpO4(OH)2](aq)3− anion is protonated to form the [NpO4(OH)(H2O)](aq)2− complex. This process is approximately 12% more thermodynamically favorable compared to the protonation of the equatorial oxo group, which results in the formation of the [NpO3(OH)3](aq)2− complex (Fig. 1, and ESI, Section 1.2, Table S51†). This observation is in good agreement with the calculated Mulliken charges38 of [NpO4(OH)2](aq)3− because the axial OH− group has a Mulliken charge of −0.98, whereas the equatorial oxo group has Mulliken charge of −0.73. Calculation of the Mulliken charge provides information on the protonation step as the more negative the value, the greater its ability to interact with and stabilize protons. This suggests that the axial OH− group, with its more negative charge, is more likely to undergo protonation.39,40
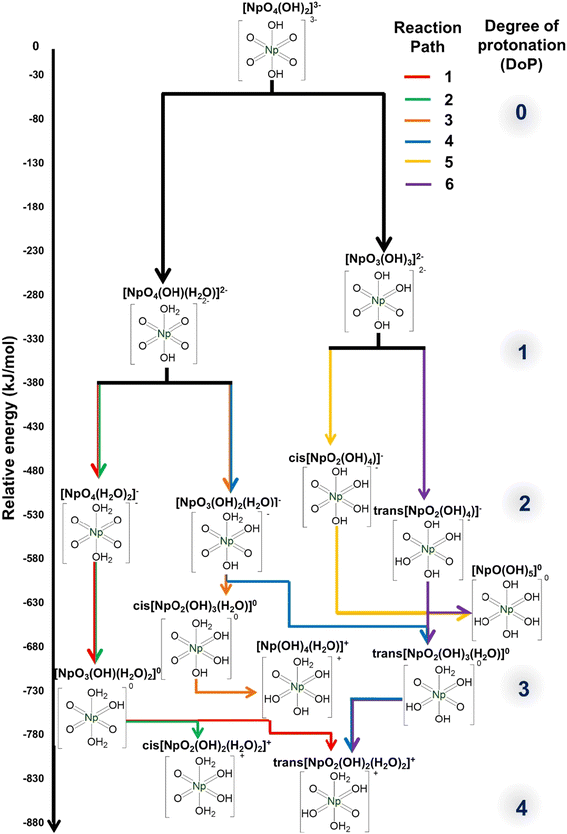 | ||
| Fig. 1 The relative free energies of Np(VII) complexes upon protonation where free energies values of are calculated compared to the starting reactants. Full equations and free energy values are provided in ESI, Section 1.2, Table S51.† | ||
To facilitate understanding, we have classified the subsequent protonation into six potential pathways. The [NpO4(OH)(H2O)](aq)2− complex participates in protonation paths 1 through 4, while the [NpO3(OH)3](aq)2− complex is involved in protonation paths 5 and 6 (Fig. 1).
In Path 1, the second protonation occurs at the remaining axial OH− group, resulting in the formation of the [NpO4(H2O)2](aq)−complex. This complex can then undergo a third and fourth protonation at the equatorial oxo groups, ultimately forming the trans-[NpO2(OH)2(H2O)2](aq)+ complex. Interestingly, this complex has a NpO23+ cation which bears resemblance to the typical Np(VI)O22+. However, it has a significantly shorter Np![[double bond, length as m-dash]](https://www.rsc.org/images/entities/char_e001.gif) O bond length of 1.741 Å (ESI, Section 1.1, Fig. S1†), compared to the typical Np(VI)
O bond length of 1.741 Å (ESI, Section 1.1, Fig. S1†), compared to the typical Np(VI)![[double bond, length as m-dash]](https://www.rsc.org/images/entities/char_e001.gif) O bond length of 1.79–1.76 Å in Np(VI)O22+ complexes,10,41–43 which can be attributed to the higher partial positive charge at the Np metal center.44,45 Experimentally, the NpO23+ cation is described by Hobart et al.46 and Spitsyn et al.17 but limited experimental evidence is available to support the formation of a heptavalent neptunyl species.
O bond length of 1.79–1.76 Å in Np(VI)O22+ complexes,10,41–43 which can be attributed to the higher partial positive charge at the Np metal center.44,45 Experimentally, the NpO23+ cation is described by Hobart et al.46 and Spitsyn et al.17 but limited experimental evidence is available to support the formation of a heptavalent neptunyl species.
Path 2 is like Path 1, but it differs in that its final product is the cis-[NpO2(OH)2(H2O)2](aq)+ complex with a ΔG that is 4.75% less exothermic compared to the trans-species (Fig. 1). Interconversion is possible if the energy barrier is low enough, as the cis product can transform into the more thermodynamically stable trans complex. This isomeric transformation could proceed either through sequential deprotonation and re-protonation in a two-step reaction, or through a transition state between the cis and trans isomers in a one-step intramolecular proton transfer.
Path 3 and Path 4 commence with the second protonation occurring at the equatorial oxo group of the [NpO4(OH)(H2O)](aq)2− complex. At the third protonation, Path 3 forms the cis-[NpO2(OH)3(H2O)](aq) moiety and it can further protonate to form [NpO(OH)4(H2O)](aq)+. In contrast, the third protonation of Path 4 forms the trans-[NpO2(OH)3(H2O)](aq) complex with a 7.95% more exothermic ΔG than the cis product. This complex contains a neptunyl dioxo cation NpO23+ with Np![[double bond, length as m-dash]](https://www.rsc.org/images/entities/char_e001.gif) O bond length of 1.759 Å, which is shorter than the Np
O bond length of 1.759 Å, which is shorter than the Np![[double bond, length as m-dash]](https://www.rsc.org/images/entities/char_e001.gif) O bond length for the corresponding NpO22+ complex at 1.794 Å. The final stage of protonation in Path 4 results in the formation of trans-[NpO2(OH)2(H2O)2](aq)+ complexes.
O bond length for the corresponding NpO22+ complex at 1.794 Å. The final stage of protonation in Path 4 results in the formation of trans-[NpO2(OH)2(H2O)2](aq)+ complexes.
Path 5 and Path 6 start with the [NpO3(OH)3](aq)2− complex. Second protonation of Path 5 results in cis-[NpO2(OH)4](aq)− while in Path 6 it forms the corresponding trans product. Like the previously discussed instances, the trans-[NpO2(OH)4](aq)− has a more exothermic ΔG (14.26%) than the cis product. Here the Np![[double bond, length as m-dash]](https://www.rsc.org/images/entities/char_e001.gif) O bond length within the NpO23+ moiety is calculated at 1.776 Å, whereas the Np
O bond length within the NpO23+ moiety is calculated at 1.776 Å, whereas the Np![[double bond, length as m-dash]](https://www.rsc.org/images/entities/char_e001.gif) O length of the corresponding NpO22+ complex is experimentally determined to be 1.790 Å by Clark et al.43 In Path 5, a total of only three protonations can occur, while in Path 6, a total of four protonations can occur. Path 6 ultimately leads to the formation of the trans-[NpO2(OH)2(H2O)2](aq)+ complex.
O length of the corresponding NpO22+ complex is experimentally determined to be 1.790 Å by Clark et al.43 In Path 5, a total of only three protonations can occur, while in Path 6, a total of four protonations can occur. Path 6 ultimately leads to the formation of the trans-[NpO2(OH)2(H2O)2](aq)+ complex.
Overall, the most thermodynamically stable species within each Degree of Protonation (DoP) either possess: (1) a neptunyl tetraoxo anion (NpO4−), as exemplified by the greater stability of [NpO4(OH)(H2O)](aq)2− compared to [NpO3(OH)3](aq)2− complex, or (2) a neptunyl dioxo (NpO23+) center, as demonstrated by the stability of the trans-species over the corresponding cis-complex. Previous literature has demonstrated that the stability of trans- over cis-products is due to the bonding stability of linear versus bent neptunyl cation.44,47,48 The calculations indicated that beyond a DoP of four, protonation is not thermodynamically favorable when the Np metal maintains an oxidation state of VII, and full protonation (i.e. achieving a DoP of six) leads to Np(VI) as the preferential form (Table S52†). This highlights the significant role that the oxidation state plays in determining the thermodynamic feasibility of protonation pathways, where Np(VII) to Np(VI) reduction aids in further protonation.
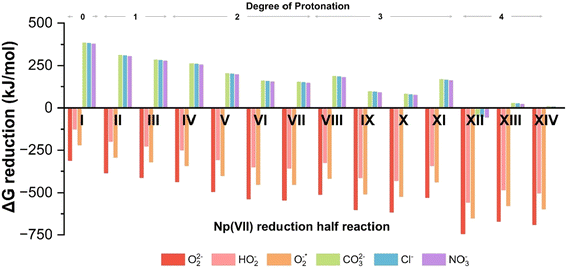 | ||
| Fig. 2 Free energy (ΔG) changes for reduction of Np(VII) complex with different reducing agents. The Roman numerals indicate the reduction half reaction listed in Table 1. | ||
| Reduction | ||
|---|---|---|
| # | DoP | Half reactions |
| I | 0 | [NpO4(OH)2](aq)3− + e− → [NpO4(OH)2](aq)4− |
| II | 1 | [NpO4(OH)(H2O)](aq)2− + e− → [NpO4(OH)(H2O)](aq)3− |
| III | 1 | [NpO3(OH)3](aq)2− + e− → [NpO3(OH)3](aq)3− |
| IV | 2 | [NpO4(H2O)2](aq)− + e− → [NpO4(H2O)2](aq)2− |
| V | 2 | [NpO3(OH)2(H2O)](aq)− + e− → [NpO3(OH)2(H2O)](aq)2− |
| VI | 2 | cis[NpO2(OH)4](aq)− + e− → cis[NpO2(OH)4](aq)2− |
| VII | 2 | trans[NpO2(OH)4](aq)− + e− → trans[NpO2(OH)4](aq)2− |
| VIII | 3 | [NpO3(OH)(H2O)2](aq) + e− → [NpO3(OH)(H2O)2](aq)− |
| IX | 3 | cis[NpO2(OH)3(H2O)](aq) + e− → cis[NpO3(OH)3(H2O)](aq)− |
| X | 3 | trans[NpO2(OH)3(H2O)](aq) + e− → trans[NpO3(OH)3(H2O)](aq)− |
| XI | 3 | [NpO(OH)5](aq) + e− → [NpO(OH)5](aq)− |
| XII | 4 | [NpO(OH)4(H2O)](aq)+ + e− → [NpO2(OH)4(H2O)](aq) |
| XIII | 4 | cis[NpO2(OH)2(H2O)2](aq)+ + e− → cis[NpO3(OH)3(H2O)](aq) |
| XIV | 4 | trans[NpO2(OH)2(H2O)2](aq)+ + e− → trans[NpO3(OH)3(H2O)](aq) |
| Oxidation | |
|---|---|
| DoP | Half reactions |
| 0 | O2(aq)2− → O2(g) + 2e− |
| 1 | HO2(aq)− + OH(aq)− → O2(g) + H2O(aq) + 2e− |
| 0 | O2(aq)*− → O2(g) + e− |
| — | CO3(aq)2− → CO3(aq)*− + e− |
| — | 2Cl(aq)− → Cl2(aq) + 2e− |
| — | NO3(aq)− → NO3(aq)* + e− |
Reactive oxygen species, specifically peroxides (O2(aq)2−), have been experimentally shown to reduce Np(VII) to Np(VI).17 Our calculations confirm that peroxide (O2(aq)2−), hydroperoxide (HO2(aq)−), and superoxide (O2(aq)*−) can reduce Np(VII) to Np(VI) across all protonation states. As the DoP increases from zero to four, the average ΔG for the reaction involving these reactive oxygen species becomes 300% more exothermic (see Fig. 2). At the DoP of two, we can uniquely compare the stability of the NpO4− anion and the NpO23+ cation in terms of reduction. On average, the reduction of NpO23+ by reactive oxygen species is ∼32% more exothermic than the reduction of NpO4−. This suggests that species containing NpO4− are more resistant to reduction than those containing NpO23+. This could explain why there is limited experimental evidence for the neptunyl dioxo compared to the neptunyl tetraoxo for heptavalent neptunium.17,51 We also tested CO3(aq)2−, Cl(aq)− and NO3(aq)− as they are commonly present in the reaction solution. However, none of these anions can reduce Np(VII) until the DoP reaches four. Overall, our calculations highlight that protonation plays a key role in causing reduction of Np(VII) to Np(VI) during the acidification of the solution.
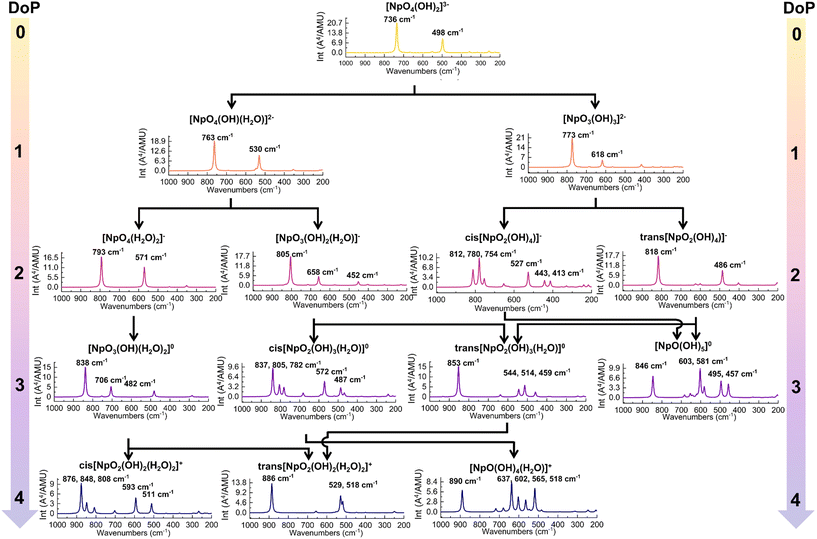 | ||
| Fig. 4 The predicted Raman spectra of Np(VII) complexes along the protonation path. The DoP abbreviates for Degree of Protonation. | ||
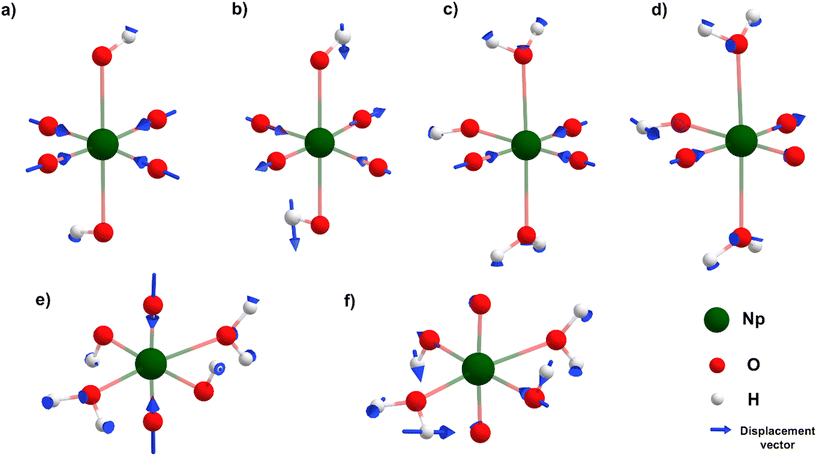
Along Path 1, the changes in predicted Raman spectra remain minimal from DoP 0 to 2. The only significant change observed is the blue-shifting of both in-phase and out-of-phase symmetrical stretches. The in-phase stretch (Fig. 3a) shifts from 736 to 763 cm−1 and finally to 793 cm−1 (Fig. 4), while the out-of-phase stretch (Fig. 3b) shifts from 498 to 530 cm−1 and then to 571 cm−1 (Fig. 4). This blue-shift in the spectral feature can be rationalized by strengthening equatorial bonding within the Np(VII) complex. This occurs as axial interactions become weaker when the OH− converts to a water because of protonation.44,48,54 At DoP 3, the spectra become more complicated due to the lowering of symmetry as the equatorial oxo protonates. Peaks at 850–700 cm−1 (Fig. 4) correspond to combination modes between NpO4− stretches and equatorial O–H wagging modes (Fig. 3d). Displacement vectors indicate that the NpO3+ symmetrical stretch (Fig. 3c) is the key contributor of the main Raman peak at 838 cm−1 (Fig. 4). At DoP 4, the 886 cm−1 corresponds to the symmetrical stretch (ν1) of NpO23+ (Fig. 3e) while other bands correspond to combination modes of Np–OH stretches and H–O–H wagging modes (Fig. 3f). In Path 2, the final cis product has multiple peaks due to lowered symmetry. Three peaks between 900–800 cm−1 correspond to combination modes between NpO4− stretches and equatorial O–H wagging modes, while the peaks at 600–500 cm−1 correspond to combination modes between Np–OH stretches and H–O–H wagging modes.
Along Path 3–6, Raman spectral variations are comparable to the other cases (Fig. 4), where a major peak shows a blue-shift along the protonation path and spectral complexity increases as molecular symmetry decreases with equatorial oxo protonation. Like Path 1 and 2, Raman spectra of trans-complexes remain relatively simple as the NpO23+ moiety remained unprotonated. Most intense peaks in these paths corresponded to either the NpO3+ symmetrical or NpO23+ symmetrical stretch as the main contributor for a particular vibrational mode (Fig. 3). The 773 cm−1 ([NpO3(OH)3](aq)2−) and 805 cm−1 ([NpO3(OH)2(H2O)](aq)−) spectral features are examples of the first scenario, while the 853 cm−1 (trans-[NpO2(OH)3(H2O)](aq)) and 818 cm−1 (trans-[NpO2(OH)4](aq)−) peaks are examples for the second case. Other peaks between 900–600 cm−1 are typically due to combination modes between NpO4− stretches and equatorial O–H wagging modes. Remaining peaks at 600–500 cm−1 are a result of combination modes between Np–OH stretches and H–O–H wagging modes.
At DoP 1, the overall profile is similar to the spectrum at DoP 0, but there is a notable blue-shift of the spectral features (Fig. 5). Positive charge is added to the molecule due to protonation, likely drawing electron density away from the Np(VII)O4− center, which results in a blue-shift of the electronic transition. Similar observations have been reported for uranyl compounds when the uranyl oxo participates in strong hydrogen bonding.62 When comparing the axial OH− protonation in [NpO4(OH)(H2O)](aq)2− to the equatorial oxo in [NpO3(OH)3](aq)2−, we note that the presence of the equatorial oxo results in a greater degree of the resultant blue-shift (Fig. 5). This is likely due to the increased impact of electron withdrawal from the Np(VII)O4− center during equatorial protonation, as the electron is directly added to one of the tetra-oxo groups.
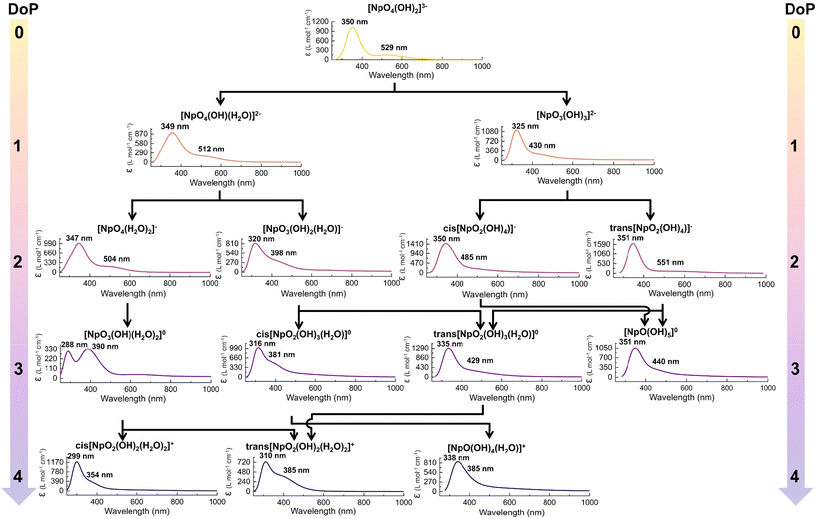 | ||
| Fig. 5 The predicted UV-Vis absorption spectra of Np(VII) along the protonation pathways. Here the simulated spectra were generated by adding Gaussian broadening to TD-DFT predicted absorption lines. | ||
When DoP changes from 1 to 4 for Paths 1–4, the predicted changes are similar to the previously discussed case, where the peaks consistently shift to higher energy with protonation and a more pronounced blue-shift occurs with equatorial oxo protonation (Fig. 5). Interestingly, the spectral changes along Path 5–6 were not consistent, where the absorption features do not constantly blue-shift with protonation (Fig. 5). This inconsistency is primarily seen in cis-[NpO2(OH)4](aq)−, trans-[NpO2(OH)4](aq)− and [NpO(OH)5](aq) complexes, where all the protonation occurred at the equatorial oxo. Reasoning for this anomaly is not entirely clear, but we speculate that these molecular geometries offer unique molecular orbital arrangements and orbital energies that do not align with the generally observed trend.
Overall, the calculations indicate that protonation leads to the blue-shifting of the UV-Vis absorption features (Fig. 5). In quantitative terms, the major absorption feature of the most thermodynamically stable structure blue-shifted by 1, −1, 15, and 40 nm when transitioning from DoP 1 to 4. Conversely, the minor absorption feature blue-shifted by 17, −22, 100, and 144 nm, respectively, clearly demonstrating that protonation has a more significant influence on this feature. The overall spectral profile remains relatively constant until the Degree of Protonation (DoP) reaches 2. Beyond this point, major alterations to the spectral profile can be observed throughout the different paths (Fig. 5).
3.2. Experimental evidence of Np(VII) protonation
During the titration experiments, the pH of the solution was varied from an initial pH of 12.84 to a final value of 1.95. For the first five steps, (pH = 12.84 to pH = 11.86) optical spectra and the color of the solution remain constant. Here, the solution had the characteristic dark green color of Np(VII) and the only detectable species was Np(VII) (Fig. 6). The Raman spectrum of the initial solution contained the characteristic peak at 735 cm−1 which corresponds to [NpO4(OH)2](aq)3− in-phase symmetrical stretch (Fig. 3a). When the pH was lowered to 12.24, the main Raman feature was shifted to 747 cm−1 with a shoulder at 737 cm−1 (Fig. 7). This 10 cm−1 blue-shift is too low to be a result of any protonation, as calculations predict a blue-shift of at least 27 cm−1 for the first protonation (see section 3.1.3). Since Raman-active Np![[double bond, length as m-dash]](https://www.rsc.org/images/entities/char_e001.gif) O features are highly sensitive to non-covalent interactions and matrix of the solution, this shift may be caused by the changes in the matrix during the titration.41,42,67 At a pH of 12.06, a new shoulder feature in the range of 755–758 cm−1 begins to grow and becomes a dominant feature when the pH decreases to 11.86. This feature falls within the typical range for the ν1 mode of Np(V)O2+. However, since there are no detectable optical spectral features for Np(V), this feature is unlikely to be the result of Np(V)O2+. Instead, it could potentially be attributed to the protonation of the axial OH− of [Np(VII)O4(OH)2](aq)3− which is predicted to occur at 763 cm−1 (refer to Fig. 4). Further acidification of the solution to a pH of 11.65 resulted in a brownish green color. Optical spectroscopy identified Np(VII) as the sole detectable oxidation state even at this pH value. The Raman spectrum here resembled that collected at pH 11.86, albeit with a more diminished feature at 736 cm−1.
O features are highly sensitive to non-covalent interactions and matrix of the solution, this shift may be caused by the changes in the matrix during the titration.41,42,67 At a pH of 12.06, a new shoulder feature in the range of 755–758 cm−1 begins to grow and becomes a dominant feature when the pH decreases to 11.86. This feature falls within the typical range for the ν1 mode of Np(V)O2+. However, since there are no detectable optical spectral features for Np(V), this feature is unlikely to be the result of Np(V)O2+. Instead, it could potentially be attributed to the protonation of the axial OH− of [Np(VII)O4(OH)2](aq)3− which is predicted to occur at 763 cm−1 (refer to Fig. 4). Further acidification of the solution to a pH of 11.65 resulted in a brownish green color. Optical spectroscopy identified Np(VII) as the sole detectable oxidation state even at this pH value. The Raman spectrum here resembled that collected at pH 11.86, albeit with a more diminished feature at 736 cm−1.
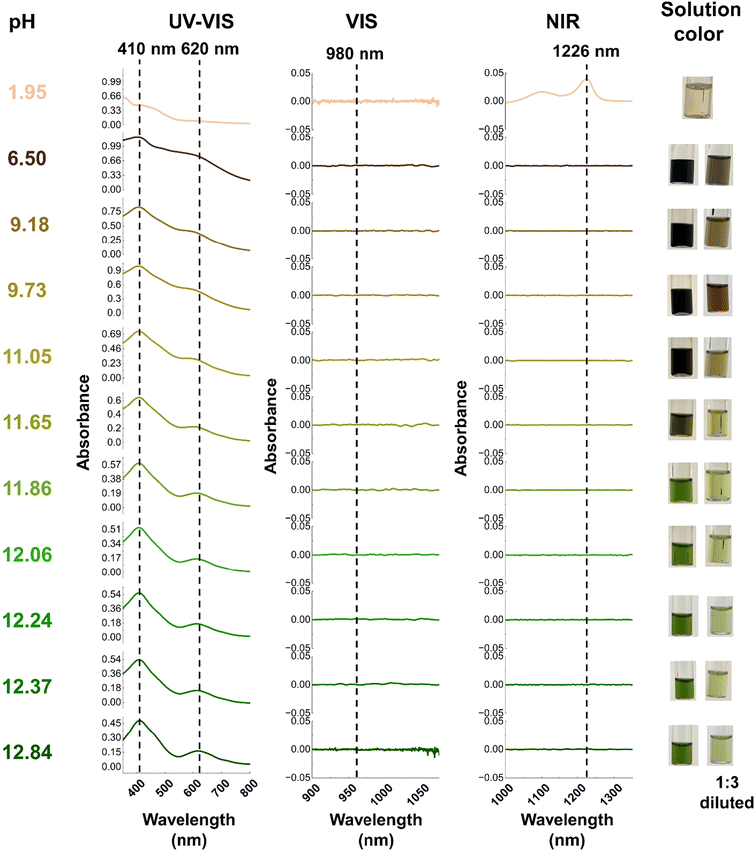 | ||
| Fig. 6 Optical spectroscopy of solution at each stage of the titration. Here the dotted line represents the typical region for observing Np(V–VII) peak. The 410 nm and 620 nm are indicative of Np(VII) while 980 nm and 1226 nm are indicative of Np(V) and Np(VI), respectively.46,52,63–65 | ||
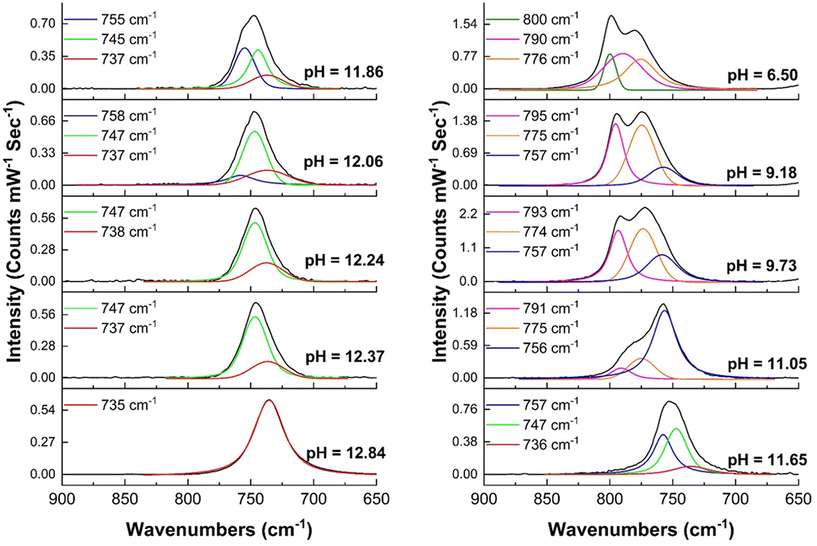 | ||
| Fig. 7 Raman spectroscopy of solution at each stage of the titration. The peak centroids of fitted peaks are shown here. Spectra with fitting parameters are given in ESI, Section 2.1, Fig. S7–S16.† | ||
As the pH of the solution decreases from 11.05 to 9.18, the solution appears to turn black. Upon dilution, it becomes apparent that the solution's color changes sequentially from brownish-green to nutmeg, and finally to brown. Despite this pH change, no detectable optical signals for Np(V) and Np(VI) were observed in the spectra. The UV-Vis absorption profile resembles the typical profile for Np(VII), with the major Np(VII) feature remaining centered at 410 nm. However, the 620 nm peak exhibits a blue-shift of 5–15 nm as the pH decreases. This observation aligns with computational predictions, which suggest that the effect of protonation on the minor (625 nm) feature is significantly greater than on the major (410 nm) feature (refer section 1.3.4). With acidification, an additional peak at ∼490 nm also appears (Fig. 6, and ESI, Section 2.1, Fig. S6†), which could be due to the formation of a protonated species. Raman spectra in this pH range exhibit three peaks centered at (a) 756–757 cm−1, (b) 774–775 cm−1, and (c) 790–795 cm−1 (Fig. 7). The (a) feature can be attributed to the protonation of the axial OH− of [Np(VII)O4(OH)2](aq)3− and the (b) peak falls within a similar energy range (769 cm−1) as measured for [Np(VI)O2(OH)4](aq)2− by Clark et al., yet the absence of detectable Np(VI) suggests that this feature originates from Np(VII) species. According to computational predictions, the NpO3+ symmetrical stretch of [NpO3(OH)3](aq)2− is predicted to occur at 773 cm−1. [NpO3(OH)3](aq)2− is formed by the equatorial protonation of [NpO4(OH)2](aq)3−, suggesting that the (b) feature could result from this protonated product. Finally, the (c) feature aligns well with the calculated in-phase symmetrical stretch of [NpO4(H2O)2](aq)− (793 cm−1), which is formed when both axial OH− of [NpO4(OH)2](aq)3− are protonated.
Even as the pH decreases to 6.50, the only detectable peaks correspond to Np(VII). At this point, a feature at 490 nm becomes apparent (Fig. 6 and ESI, Section 2.1, Fig. S6†). Computational predictions indicate that [NpO3(OH)(H2O)2](aq) should exhibit a second intense UV-Vis feature that could correspond to this new feature at 490 nm in the experimental spectrum. Calculations show that this feature is expected to be blue-shifted compared to the unprotonated species by approximately 140 nm (Fig. 5). Since this new feature in the experimental spectrum (Fig. 6) is approximately 130 nm shifted from the typical 620 nm band, this absorption band may be a result of the growth of [NpO3(OH)(H2O)2](aq). The Raman peaks at 790 and 776 cm−1 (Fig. 7) align well with calculated Raman active modes of [NpO4(H2O)2](aq)− (793 cm−1) and [NpO3(OH)3](aq)2− (773 cm−1), respectively (Fig. 4). The absence of [NpO3(OH)(H2O)2](aq) peaks in the Raman may be due to this species only being present at a low concentration that is below the detection limit of the Raman instrument.
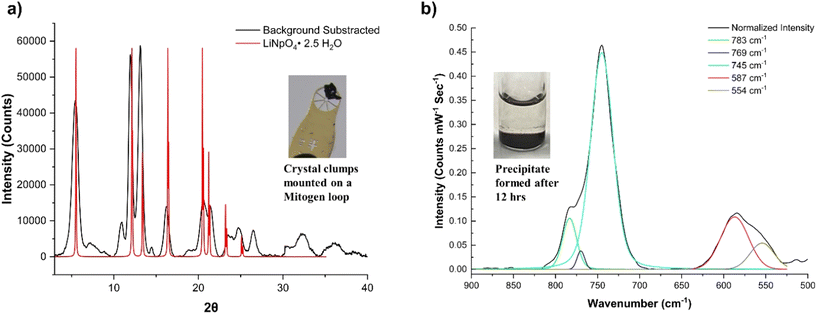
At this stage, a black suspension forms and precipitates over a period of 12 hours, resulting in a clear solution. PXRD of the precipitate shows that it is crystalline and the diffractogram partially matches to LiNp(VII)O4·2.5H2O (PDF ID 00-032-0580) (Fig. 8). Solid-state Raman spectrum of this solid phase indicates peaks centered at 783, 769, 745, 587, and 554 cm−1. None of these features match with NpO22+ ν1 symmetric stretch associated with lithium neptunates (Li2Np(VI)O4: 672 and 693 cm−1, Li4Np(VI)O5: 700 cm−1),8 but the 769 and 745 cm−1 peaks closely match with the NpO22+ ν1 symmetric stretch of [Co(NH3)6]2[Np(VI)O2(OH)4]3·H2O reported by Clark et al.43 To gain more evidence of the Np oxidation state in the solid state, we centrifuged the precipitate, decanted the liquid, and resuspended the residual solid in 1 M LiOH solution (∼2 mL). The precipitate spontaneously dissolved and formed a green solution that was confirmed by optical spectroscopy to be Np(VII) (ESI, Section 2.1, Fig. S17†). Oxidation of Np(VI) to Np(VII) in aqueous media typically requires a strong oxidizing agent, such as O3(aq) or KBrO(aq),17,52 that was absent in this case. The spontaneous dissolution and generation of a Np(VII) solution suggest a majority of the precipitate is more likely a protonated Np(VII) species than a [Np(VI)O2(OH)4](aq)2− phase.
As the final step of titration, we decreased the pH of the solution to 1.95. The primary motivation for this is to ensure our optical spectroscopy setup can clearly detect reduction of Np(VII) to Np(VI) at these concentrations. We confirmed this to be the case, as the spectral signature for the Np(VI) NIR feature can be clearly seen at 1226 nm (Fig. 6). This observation lends further support to our assertion that the primary oxidation state of Np remained in the heptavalent state until the final titration step.
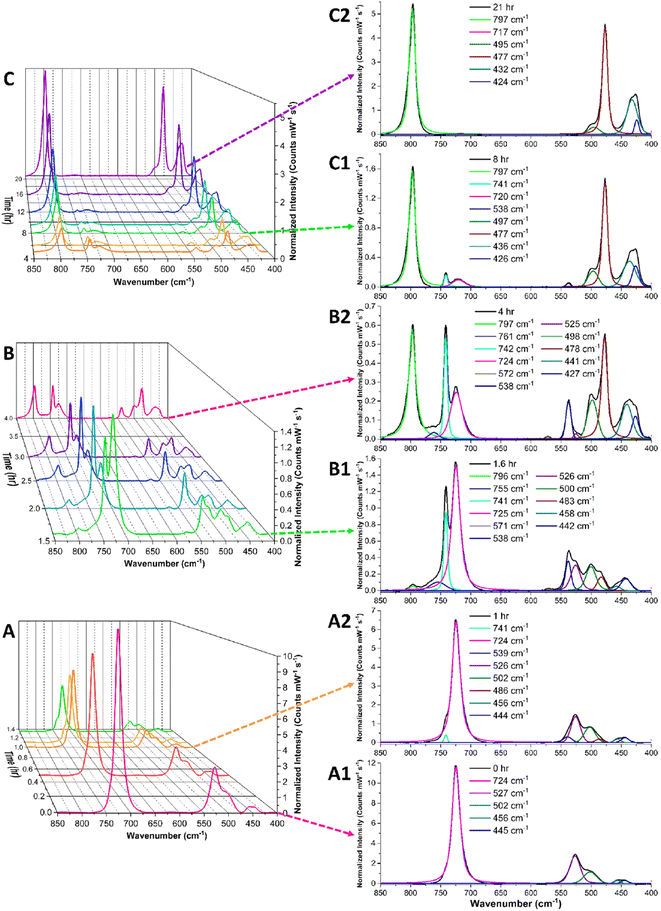
Initially, the sample of [(Co(NH3)6)(NpO4(OH)2)]·nH2O (n = 2–4) was prepared and placed in the Petri dish in the absence of acid to determine the stability of the phase under ambient conditions. Raman spectra were collected every 5 minutes for 24 hours and showed no signs of chemical changes. Fig. 9A1 reveals signals at 724 cm−1 and 525 cm−1, which we attribute to the in-phase and out-of-phase symmetrical stretch of [NpO4(OH)2]3−, respectively. The 13 cm−1 deviation of the in-phase symmetric stretch frequency from that of the solution state sample (737 cm−1) is unsurprising, as matrix effects have been documented causing shifts of this general magnitude in other neptunium species.42 Additional vibrational signals present in the solid-state spectra of the pristine material are located at 500, 456, and 445 cm−1 and can be attributed to the cobalt hexamine cation.70
To drive protonation, the [(Co(NH3)6)(NpO4(OH)2)]·nH2O (n = 2–4) was exposed to an acidic environment by placing it in a covered glass Petri dish along with 1 mL of 5 M HCl in an open small glass vial. This setup allowed the HCl vapor pressure to slowly fill the Petri dish with acidic vapor, gradually exposing the solid sample to an acidic environment with up to 0.0333 mmHg of HCl(g).71 Initially, no major changes are observed in the Raman spectra (Fig. 9A), which may be expected because the acid concentration in the gas phase should initially be very low as the HCl evaporates and begins to equilibrate in the Petri dish environment. After approximately one hour, additional vibrational modes begin to appear in the spectrum (741 and 538 cm−1) and there is some loss in intensity of the original signals at 724 and 525 cm−1.
After approximately 1.6 hours, the spectra in Fig. 9B1 shows a third pair of peaks appearing in the window of interest, with features located at 755 and 571 cm−1. From 1.6 hours to 4 hours of exposure to acid vapor, the changes in the Raman spectra are dominated primarily by the ingrowth of the 741/538 cm−1 and 755/571 cm−1 peak pairs, with the gradual loss of intensity of the original pair of signals at 724 and 525 cm−1. These observed changes are consistent with the protonation of the first and second axial hydroxide ligands in the Np(VII) tetraoxo moiety. This suggests these signals are associated with [Np(VII)O4(OH)2]3− species and not a reduced [Np(VI)O2]2+ complex.
After approximately four hours, the spectral changes are dominated by a gradual decrease in peak intensities of the identified 724, 525, 741, 538, 755, and 571 cm−1 peaks (Fig. 9C) and an ingrowth of a large peak at 797 cm−1. It's notable that the ingrowth of this signal at 797 cm−1 is not accompanied by an additional feature in the 500 to 700 cm−1 region, as would be expected if this peak was associated with a tetraoxo symmetrical stretch. This strongly suggests that the new signal at 797 cm−1 is associated with a Np(VI) dioxo species, which fits well with previously reported literature.43,66,72
Overall, this solid-state acidification experiment demonstrates that the [Np(VII)O4(OH)2]3− moiety in [(Co(NH3)6)(NpO4(OH)2)]·nH2O (n = 2–4) is relatively stable under ambient conditions, but exposure to an acidic environment results in multiple sequential protonation reactions before the heptavalent species reduces to form a [Np(VI)O2]2+ complex. It is also important to note that this solid-state Raman data yields the first experimental evidence of the asymmetric tetraoxo-ligand stretching mode that has previously gone undetected. In particular, the absence of this vibrational mode in the 2004 paper by Clark et al. was a notable gap in evidence that Np(VII) primarily exists as [NpO4(OH)2]3−.11,13 The observation of a Raman band attributed to this vibrational mode adds confirmation for Np(VII) predominately existing as [NpO4(OH)2]3−.
4. Conclusions
In this work, protonation of the tetraoxo Np(VII) anion, [NpO4(OH)2]3−, was explored through computational and experimental techniques. Thermodynamic assessment of possible protonation reactions using computational techniques indicate that protonation reactions with the axial OH− groups of the [NpO4(OH)2]3− anion are more thermodynamically favorable than those of the equatorial oxo groups. It was found that as many as four sequential protonation reactions of the [NpO4(OH)2]3− anion (to DoP = 4) may be thermodynamically favorable. As the DoP increases, the predicted free energy change (ΔG) for the Np(VII) reduction to Np(VI) tends to increase, with the favorable reduction reactions involving reactive oxygen species (specifically peroxides, hydroperoxide, and superoxide). This reduction becomes 3× more exothermic as the DoP increases from 0 to 4. Predictions indicate that until DoP = 4, CO3(aq)2−, Cl(aq)− and NO3(aq)− are unable to reduce Np(VII). In addition, protonation of the [NpO4(OH)2]3− anion would be expected to cause distinct changes to dominant vibrational modes and would also lead to some blue-shifting of the UV-Vis absorption features.Subsequent experimental investigation provides compelling evidence for the protonation of Np(VII) in solution, as indicated by the blue-shift in Raman features in the spectral window between 700–850 cm−1 and the persistence of Np(VII) optical spectroscopic signals across a wide pH range. Observed spectral changes align well with computational predictions, further supporting the protonation hypothesis. Additional evidence suggesting the presence of protonated Np(VII) species rather than a Np(VI) phase came from the observation that a crystalline precipitate, which formed as the solution approached pH = 7, spontaneously dissolved in fresh LiOH to yield a Np(VII) solution. Experiments involving the exposure of a solid-state Np(VII) sample to acidic vapor revealed the appearance of pairs of Raman peaks consistent with the expected behavior of the in-phase and out-of-phase symmetric stretching modes of protonated Np(VII) tetraoxo moieties, providing additional evidence for protonation. However, the appearance of a signal likely associated with a reduced Np(VI) species after prolonged exposure to acid vapor indicates the potential for reduction under these conditions. These findings significantly advance our understanding of heptavalent neptunium chemistry and underscore the need for further studies to fully elucidate the complex behavior and spectroscopic signals associated with neptunium species in complex environments.
Data availability
The data supporting this article have been included as part of the ESI.†Conflicts of interest
There are no conflict to declare.Acknowledgements
G. C. B., H. R., E. L. M., and T. Z. F. acknowledge funding support provided by the Department of Energy, Basic Energy Sciences program under DE-SC0023995. Computational support was provided in part by the University of Iowa. This work used the Theory and Computation facility of the Center for Functional Nanomaterials (CFN), which is a U.S. Department of Energy Office of Science User Facility at Brookhaven National Laboratory under Contract No. DE-SC0012704.References
- S. Chatterjee, S. A. Bryan, A. J. Casella, J. M. Peterson and T. G. Levitskaia, Mechanisms of neptunium redox reactions in nitric acid solutions, Inorg. Chem. Front., 2017, 4(4), 581–594, 10.1039/C6QI00550K.
- L. R. Morss, N. M. Edelstein, J. Fuger, J. J. Katz and G. T. Seaborg, The Chemistry of the Actinide and Transactinide Elements, Springer, Dordrecht, 3rd edn, 2007, vol. 1–5. DOI:10.1007/1-4020-3598-5.
- R. G. Geier, Purex Technical Manual, WHC-SP-0479, Westinghouse Hanford Company, Richland, WA, 1989 Search PubMed.
- R. S. Herbst, P. Baron and M. Nilsson, Ch. 6 - Standard and advanced separation: PUREX processes for nuclear fuel reprocessing, in Advanced Separation Techniques for Nuclear Fuel Reprocessing and Radioactive Waste Treatment, ed. K. L. Nash and G. J. Lumetta, Woodhead Publishing, 2011, pp. 141–175 Search PubMed.
- K. E. Knope and L. Soderholm, Solution and Solid-State Structural Chemistry of Actinide Hydrates and Their Hydrolysis and Condensation Products, Chem. Rev., 2013, 113(2), 944–994, DOI:10.1021/cr300212f.
- A. A. Nemodruk, E. V. Bezrogova and B. F. Myasoedov, Interaction of uranium(VI) with oxidants in alkaline media, J. Radioanal. Chem., 1971, 8(2), 257–262, DOI:10.1007/BF02518190.
- R. E. Wilson, S. Stegman and M. L. Tarlton, Reactions of Neptunium(V) in Alkali-Metal Hydroxides, Inorg. Chem., 2021, 60(23), 17480–17486, DOI:10.1021/acs.inorgchem.1c01858.
- D. C. Hutchison, D. V. Kravchuk, H. Rajapaksha, S. Stegman, T. Z. Forbes and R. E. Wilson, Synthesis of Single Crystal Li2NpO4 and Li4NpO5 from Aqueous Lithium Hydroxide Solutions under Mild Hydrothermal Conditions, Inorg. Chem., 2023, 62(40), 16564–16573, DOI:10.1021/acs.inorgchem.3c02460.
- G. Leinders, B. Acevedo, F. Jutier, G. Colak and M. Verwerft, Speciation and Ammonia-Induced Precipitation of Neptunium and Uranium Ions, Inorg. Chem., 2023, 62(25), 9807–9817, DOI:10.1021/acs.inorgchem.3c00647.
- H. Rajapaksha, G. C. Benthin, D. V. Kravchuk, H. Lightfoot, S. E. Mason and T. Z. Forbes, Three-Dimensional Noncovalent Interaction Network within [NpO2Cl4]2− Coordination Compounds: Influence on Thermochemical and Vibrational Properties, Inorg. Chem., 2023, 62(42), 17265–17275, DOI:10.1021/acs.inorgchem.3c02502.
- D. L. Clark, P. D. Palmer, C. D. Tait and D. W. Keogh, Unusual tetraoxo coordination in heptavalent neptunium, Actinide Res. Q., 2004, 1st Quarter, 15–18 Search PubMed.
- H. Bolvin, U. Wahlgren, H. Moll, T. Reich, G. Geipel, T. Fanghänel and I. Grenthe, On the Structure of Np(VI) and Np(VII) Species in Alkaline Solution Studied by EXAFS and Quantum Chemical Methods, J. Phys. Chem. A, 2001, 105(51), 11441–11445, DOI:10.1021/jp0114283.
- J. E. C. Wren and G. Schreckenbach, Neptunium(VII) in high-ionic-strength alkaline solutions—[NpO2(OH)4]− or [NpO4(OH)2]3−?, Can. J. Chem., 2009, 87(10), 1436–1443, DOI:10.1139/v09-097.
- C. W. Williams, J. P. Blaudeau, J. C. Sullivan, M. R. Antonio, B. Bursten and L. Soderholm, The Coordination Geometry of Np(VII) in Alkaline Solution, J. Am. Chem. Soc., 2001, 123(18), 4346–4347, DOI:10.1021/ja005640g.
- V. P. Shilov, A. V. Gogolev and A. M. Fedoseev, Speciation, stability, and reactions of Np(III–VII) in aqueous solutions, Radiochemistry, 2012, 54(3), 212–227, DOI:10.1134/S1066362212030022.
- N. N. Krot, I. A. Charushnikova and A. A. Bessonov, Synthesis of M(NpO4)2·nH2O (M = Mg, Ca, Sr, Ba) Using H3BO3 Solutions and Properties of These Salts, Radiochemistry, 2018, 60(1), 13–17, DOI:10.1134/S1066362218010022.
- V. I. Spitsyn, A. D. Gelman, N. N. Krot, M. P. Mefodiyeva, F. A. Zakharova, Y. A. Komkov, V. P. Shilov and I. V. Smirnova, Heptavalent state of neptunium and plutonium, J. Inorg. Nucl. Chem., 1969, 31(9), 2733–2745, DOI:10.1016/0022-1902(69)80187-9.
- A. J. Zielen and D. Cohen, The neptunium(VII)-(VI) couple in sodium hydroxide solutions, J. Phys. Chem., 1970, 74(2), 394–405, DOI:10.1021/j100697a027.
- M. J. Frisch, G. W. Trucks, H. B. Schlegel, G. E. Scuseria, M. A. Robb, J. R. Cheeseman, G. Scalmani, V. Barone, G. A. Petersson and H. Nakatsuji, et al., Gaussian 16, 2009 Search PubMed.
- A. D. Becke, Density–functional thermochemistry. III. The role of exact exchange, J. Chem. Phys., 1993, 98(7), 5648–5652, DOI:10.1063/1.464913.
- C. Lee, W. Yang and R. G. Parr, Development of the Colle-Salvetti correlation-energy formula into a functional of the electron density, Phys. Rev. B: Condens. Matter Mater. Phys., 1988, 37(2), 785–789, DOI:10.1103/PhysRevB.37.785.
- S. Grimme, S. Ehrlich and L. Goerigk, Effect of the damping function in dispersion corrected density functional theory, J. Comput. Chem., 2011, 32(7), 1456–1465, DOI:10.1002/jcc.21759.
- S. Grimme, J. Antony, S. Ehrlich and H. Krieg, A consistent and accurate ab initio parametrization of density functional dispersion correction (DFT-D) for the 94 elements H-Pu, J. Chem. Phys., 2010, 132(15), 154104, DOI:10.1063/1.3382344.
- F. Weigend, M. Häser, H. Patzelt and R. Ahlrichs, RI-MP2: optimized auxiliary basis sets and demonstration of efficiency, Chem. Phys. Lett., 1998, 294(1), 143–152, DOI:10.1016/S0009-2614(98)00862-8.
- X. Cao and M. Dolg, Segmented contraction scheme for small-core actinide pseudopotential basis sets, J. Mol. Struct.: THEOCHEM, 2004, 673(1), 203–209, DOI:10.1016/j.theochem.2003.12.015.
- X. Cao, M. Dolg and H. Stoll, Valence basis sets for relativistic energy-consistent small-core actinide pseudopotentials, J. Chem. Phys., 2003, 118(2), 487–496, DOI:10.1063/1.1521431.
- R. Ramirez and D. Borgis, Density Functional Theory of Solvation and Its Relation to Implicit Solvent Models, J. Phys. Chem. B, 2005, 109(14), 6754–6763, DOI:10.1021/jp045453v.
- G. Scalmani and M. J. Frisch, Continuous surface charge polarizable continuum models of solvation. I. General formalism, J. Chem. Phys., 2010, 132(11), 114110, DOI:10.1063/1.3359469.
- J. W. Ochterski, Thermochemistry inGaussian, 2000 Search PubMed.
- F. Neese, F. Wennmohs, U. Becker and C. Riplinger, The ORCA quantum chemistry program package, J. Chem. Phys., 2020, 152(22), 224108, DOI:10.1063/5.0004608.
- D. A. Pantazis and F. Neese, All-Electron Scalar Relativistic Basis Sets for the Actinides, J. Chem. Theory Comput., 2011, 7(3), 677–684, DOI:10.1021/ct100736b.
- D. A. Pantazis, X.-Y. Chen, C. R. Landis and F. Neese, All-electron scalar relativistic basis sets for third-row transition metal atoms, J. Chem. Theory Comput., 2008, 4(6), 908–919 CrossRef CAS PubMed.
- F. Weigend and R. Ahlrichs, Balanced basis sets of split valence, triple zeta valence and quadruple zeta valence quality for H to Rn: Design and assessment of accuracy, Phys. Chem. Chem. Phys., 2005, 7(18), 3297–3305 RSC.
- J. D. Rolfes, F. Neese and D. A. Pantazis, All-electron scalar relativistic basis sets for the elements Rb–Xe, J. Comput. Chem., 2020, 41(20), 1842–1849, DOI:10.1002/jcc.26355.
- B. de Souza, G. Farias, F. Neese and R. Izsák, Predicting Phosphorescence Rates of Light Organic Molecules Using Time-Dependent Density Functional Theory and the Path Integral Approach to Dynamics, J. Chem. Theory Comput., 2019, 15(3), 1896–1904, DOI:10.1021/acs.jctc.8b00841.
- Origin(Pro), Version 2024, OriginLab Corporation, Northampton, Massachusetts, USA, 2024 (accessed 2024) Search PubMed.
- I. A. Charushnikova, N. N. Krot, M. S. Grigor'ev and V. I. Makarenkov, New data on Np(VII) compounds with Co(NH3)63+. Crystal structure of [Co(NH3)6]3[NpO4(OH)2]3·4H2O and refinement of the structure of [Co(NH3)6][NpO4(OH)2]·2H2O, Radiochemistry, 2017, 59(2), 124–133, DOI:10.1134/S1066362217020047.
- R. S. Mulliken, Electronic Population Analysis on LCAO–MO Molecular Wave Functions. I, J. Chem. Phys., 1955, 23(10), 1833–1840, DOI:10.1063/1.1740588 , (acccessed 8/13/2024).
- R. S. Vařeková, S. Geidl, C.-M. Ionescu, O. Skřehota, T. Bouchal, D. Sehnal, R. Abagyan and J. Koča, Predicting pKa values from EEM atomic charges, J. Cheminf., 2013, 5(1), 18, DOI:10.1186/1758-2946-5-18.
- A. Migliore, N. F. Polizzi, M. J. Therien and D. N. Beratan, Biochemistry and Theory of Proton-Coupled Electron Transfer, Chem. Rev., 2014, 114(7), 3381–3465, DOI:10.1021/cr4006654.
- J. L. Bjorklund, M. M. Pyrch, M. C. Basile, S. E. Mason and T. Z. Forbes, Actinyl-cation interactions: experimental and theoretical assessment of [Np(VI)O2Cl4]2− and [U(VI)O2Cl4]2− systems, Dalton Trans., 2019, 48(24), 8861–8871, 10.1039/C9DT01753D.
- M. M. Pyrch, J. L. Bjorklund, J. M. Williams, D. L. Parr Iv, S. E. Mason, J. Leddy and T. Z. Forbes, Impacts of hydrogen bonding interactions with Np(V/VI)O2Cl4 complexes: vibrational spectroscopy, redox behavior, and computational analysis, Dalton Trans., 2020, 49(20), 6854–6866, 10.1039/D0DT00848F.
- D. L. Clark, S. D. Conradson, R. J. Donohoe, P. L. Gordon, D. W. Keogh, P. D. Palmer, B. L. Scott and C. D. Tait, Chemical Speciation of Neptunium(VI) under Strongly Alkaline Conditions. Structure, Composition, and Oxo Ligand Exchange, Inorg. Chem., 2013, 52(7), 3547–3555, DOI:10.1021/ic3020139.
- R. G. Denning, Electronic Structure and Bonding in Actinyl Ions and their Analogs, J. Phys. Chem. A, 2007, 111(20), 4125–4143, DOI:10.1021/jp071061n.
- S. Fortier and T. W. Hayton, Oxo ligand functionalization in the uranyl ion (UO22+), Coord. Chem. Rev., 2010, 254(3), 197–214, DOI:10.1016/j.ccr.2009.06.003.
- D. E. Hobart, Electrochemical and Spectroscopic Studies of Some Less Stable Oxidation States of Selected Lanthanide and Actinide Elements, University of Tennessee - Knoxville, Knoxville, Tennessee, 1981 Search PubMed.
- R. G. Denning, T. R. Snellgrove and D. R. Woodwark, The electronic structure of the uranyl ion, Mol. Phys., 1976, 32(2), 419–442, DOI:10.1080/00268977600103211.
- M. L. Neidig, D. L. Clark and R. L. Martin, Covalency in f-element complexes, Coord. Chem. Rev., 2013, 257(2), 394–406, DOI:10.1016/j.ccr.2012.04.029.
- J. C. Sullivan and A. J. Zielan, The oxidation of water by Np(VII) in aqueous perchloric acid media, Inorg. Nucl. Chem. Lett., 1969, 5(11), 927–931, DOI:10.1016/0020-1650(69)80014-0.
- R. J. Lemire, Chemical thermodynamics of neptunium and plutonium, 2001 Search PubMed.
- S. E. Gilson and P. C. Burns, The crystal and coordination chemistry of neptunium in all its oxidation states: An expanded structural hierarchy of neptunium compounds, Coord. Chem. Rev., 2021, 445, 213994, DOI:10.1016/j.ccr.2021.213994.
- D. Kravchuk, L. J. Augustine, H. Rajapaksha, G. Benthin, E. R. Batista, P. Yang and T. Forbes, Insights into the Mechanism of Neptunium Oxidation to the Heptavalent State, Chem. – Eur. J., 2024, 30(23), e202304049, DOI:10.1002/chem.202304049.
- L. J. Basile, J. C. Sullivan, J. R. Ferraro and P. LaBonville, The Raman Scattering of Uranyl and Transuranium V, VI, and VII Ions, Appl. Spectrosc., 1974, 28(2), 142–145 CrossRef CAS.
- G. Lu, A. J. Haes and T. Z. Forbes, Detection and identification of solids, surfaces, and solutions of uranium using vibrational spectroscopy, Coord. Chem. Rev., 2018, 374, 314–344, DOI:10.1016/j.ccr.2018.07.010.
- A. Kovács, R. J. M. Konings, J. K. Gibson, I. Infante and L. Gagliardi, Quantum Chemical Calculations and Experimental Investigations of Molecular Actinide Oxides, Chem. Rev., 2015, 115(4), 1725–1759, DOI:10.1021/cr500426s.
- R. Grotjahn and M. Kaupp, Reliable TDDFT Protocol Based on a Local Hybrid Functional for the Prediction of Vibronic Phosphorescence Spectra Applied to Tris(2,2′-bipyridine)-Metal Complexes, J. Phys. Chem. A, 2021, 125(32), 7099–7110, DOI:10.1021/acs.jpca.1c05101.
- J. Su, W. H. E. Schwarz and J. Li, Electronic Spectra and Excited States of Neptunyl and Its [NpO2Cl4]2− Complex, Inorg. Chem., 2012, 51(5), 3231–3238, DOI:10.1021/ic202712p.
- C. Liao, J. M. Kasper, A. J. Jenkins, P. Yang, E. R. Batista, M. J. Frisch and X. Li, State Interaction Linear Response Time-Dependent Density Functional Theory with Perturbative Spin–Orbit Coupling: Benchmark and Perspectives, JACS Au, 2023, 3(2), 358–367, DOI:10.1021/jacsau.2c00659.
- P. Tecmer, A. S. P. Gomes, U. Ekström and L. Visscher, Electronic spectroscopy of UO22+, NUO+ and NUN: an evaluation of time-dependent density functional theory for actinides, Phys. Chem. Chem. Phys., 2011, 13(13), 6249–6259, 10.1039/C0CP02534H.
- A. K. Narsaria, J. D. Ruijter, T. A. Hamlin, A. W. Ehlers, C. F. Guerra, K. Lammertsma and F. M. Bickelhaupt, Performance of TDDFT Vertical Excitation Energies of Core-Substituted Naphthalene Diimides, J. Comput. Chem., 2020, 41(15), 1448–1455, DOI:10.1002/jcc.26188.
- P. Zhou, Why the lowest electronic excitations of rhodamines are overestimated by time-dependent density functional theory, Int. J. Quantum Chem., 2018, 118(23), e25780, DOI:10.1002/qua.25780.
- R. G. Surbella, M. B. Andrews and C. L. Cahill, Self-assembly of [UO2X4]2− (X=Cl, Br) dianions with γ substituted pyridinium cations: Structural systematics and fluorescence properties, J. Solid State Chem., 2016, 236, 257–271, DOI:10.1016/j.jssc.2015.09.011.
- P. C. Burns, U6+ Minerals and Inorcanic Compounds: Insight Into an Expanded Structural Hierarchy of Crystal Structures, Can. Mineral., 2005, 43(6), 1839–1894, DOI:10.2113/gscanmin.43.6.1839 , (acccessed 6/10/2024).
- L. R. Sadergaski, K. K. Patton, G. K. Toney, D. W. DePaoli and Æ. H. Delmau, Measuring Neptunium Concentration Using Optical Spectrometry for the Plutonium-238 Supply Program, 2021 Search PubMed.
- L. R. Sadergaski, H. B. Andrews, S. E. Gilson and A. J. Parkison, Quantifying neptunium oxidation states in nitric acid through spectroelectrochemistry and chemometrics, Front. Nucl. Eng., 2023, 2, 1–11, DOI:10.3389/fnuen.2023.1323372.
- C. Madic, G. M. Begun, D. E. Hobart and R. L. Hahn, Raman spectroscopy of neptunyl and plutonyl ions in aqueous solution: hydrolysis of neptunium(VI) and plutonium(VI) and disproportionation of plutonium(V), Inorg. Chem., 1984, 23(13), 1914–1921, DOI:10.1021/ic00181a025.
- M. M. Pyrch, L. J. Augustine, J. M. Williams, S. E. Mason and T. Z. Forbes, Use of vibrational spectroscopy to identify the formation of neptunyl–neptunyl interactions: a paired density functional theory and Raman spectroscopy study, Dalton Trans., 2022, 51(12), 4772–4785, 10.1039/D2DT00200K.
- T. Vitova, I. Pidchenko, D. Schild, T. Prüßmann, V. Montoya, D. Fellhauer, X. Gaona, E. Bohnert, J. Rothe and R. J. Baker, et al., Competitive Reaction of Neptunium(V) and Uranium(VI) in Potassium–Sodium Carbonate-Rich Aqueous Media: Speciation Study with a Focus on High-Resolution X-ray Spectroscopy, Inorg. Chem., 2020, 59(1), 8–22, DOI:10.1021/acs.inorgchem.9b02463.
- S. L. Estes, B. Qiao and G. B. Jin, Ion association with tetra-n-alkylammonium cations stabilizes higher-oxidation-state neptunium dioxocations, Nat. Commun., 2019, 10(1), 59, DOI:10.1038/s41467-018-07982-5.
- T. W. Swaddle, P. J. Craig and P. M. Boorman, The vibrational spectra of simple cobalt(III) and chromium(III) ammine complexes, Spectrochim. Acta, Part A, 1970, 26(7), 1559–1565, DOI:10.1016/0584-8539(70)80216-1.
- J. J. Fritz and C. R. Fuget, Vapor Pressure of Aqueous Hydrogen Chloride Solutions, O° to 50° C, Ind. Eng. Chem. Chem. Eng. Data Series, 1956, 1(1), 10–12, DOI:10.1021/i460001a002.
- C. Madic, D. E. Hobart and G. M. Begun, Raman spectrometric studies of actinide(V) and -(VI) complexes in aqueous sodium carbonate solution and of solid sodium actinide(V) carbonate compounds, Inorg. Chem., 1983, 22(10), 1494–1503, DOI:10.1021/ic00152a015.
Footnotes |
| † Electronic supplementary information (ESI) available. See DOI: https://doi.org/10.1039/d4dt01706d |
| ‡ These authors contributed equally to this work and share first authorship. |
| This journal is © The Royal Society of Chemistry 2024 |

