 Open Access Article
Assessing CMAQ model discrepancies in a heavily polluted air basin using UAV vertical profiles and sensitivity analyses†
Zihan
Zhu‡
ab,
Khanh
Do§
 ab,
Cesunica E.
Ivey¶
 *ab and
Don R.
Collins
ab
aDepartment of Chemical and Environmental Engineering, University of California, Riverside, California 92521, USA. E-mail: iveyc@berkeley.edu
bCollege of Engineering, Center for Environmental Research and Technology (CE-CERT), University of California Riverside, Riverside, California 92507, USA
First published on 7th August 2024
Abstract
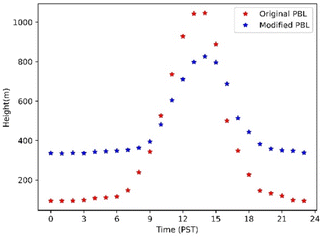
An unmanned aerial vehicle was deployed daily in Riverside, CA from August to November 2020, capturing vertical ozone and particulate matter measurements. Flights took place in the early morning and late afternoon, resulting in 321 vertical profiles from the surface to 500 m above ground level. The measured ozone mixing ratio is statistically compared with ground-based measurements at the Riverside–Rubidoux regulatory air monitoring site in Jurupa Valley, CA and with CMAQ simulated concentrations to assess consistency with the nearest reference monitor and model skill at reproducing the observed vertical structure, respectively. The default model configuration overestimates ground-level ozone by 17.7 ppb in the morning and underestimates it by an average of 2.9 ppb in the afternoon. The sensitivity of the model to factors such as planetary boundary layer (PBL), eddy diffusivity, NOx emissions, and VOC emissions is investigated by modifying key physics and emissions settings in a series of simulations. We found that our default PBL scheme used in the default CMAQ simulation negatively biases the PBL height in the nighttime and positively biases it in the daytime compared to the observations retrieved from a ceilometer. For the observational region of interest, NOx emissions are concluded to be largely underestimated, leading to biases in modeled ozone concentration. We conclude with recommendations for achieving model parity with localized measurements.
Environmental significanceUnmanned aerial vehicle measurements of vertical ozone profiles facilitated the uncovering of potential underestimations in gridded NOx emission estimates for a heavily burdened air basin. Diel discrepancies were also seen for planetary boundary layer height based on ceilometer measurements, and subsequent model adjustments improved ozone mixing ratio simulations for the lower 500 meters of the CMAQ model simulation. Findings reflect potential mechanistic discrepancies over inland Southern California, which features complex terrain, hot and dry climate, and abundant secondary pollutant formation. |
1 Introduction
Air pollution is a major health risk factor globally. Ground-level ozone is one of the six criteria air pollutants regulated by the United States Environmental Protection Agency (U.S. EPA) because of its adverse impacts on human health. Globally, it is linked to over one million premature deaths annually.1,2 Moreover, tropospheric ozone is a short-lived climate pollutant that contributes to global warming.3 It is mainly formed in the atmosphere through chemical reactions involving ozone precursors including NOx, CO, and volatile organic compounds (VOCs).4The South Coast Air Basin (SoCAB) in Southern California is one of the most severely polluted regions in the U.S., suffering from excessive tropospheric ozone pollution. The concurrent state-wide tightening of VOC8 and NOx emissions regulations have made great progress in reducing the maximum hourly average mixing ratios of ozone from 490 ppb to 140 ppb during the past 30 years.5 However, several studies show the ozone concentration has again started to increase.6,7 Despite significant regulatory efforts, in 2020 the SoCAB still experienced 142 days exceeding the 70 ppb daily maximum 8 hour average National Ambient Air Quality Standard (NAAQS).5 Challenges to understanding ozone pollution in the SoCAB include the diversity of emissions sources and the complicated transport due to the terrain (i.e., surrounding mountain ranges).
The challenge to reach attainment of the 8 hour ozone NAAQS using current control strategies motivates the need to reconsider mitigation scenarios. Comprehensive atmospheric models have contributed further insights through their prediction of the response of surface ozone to emissions control strategies. However, biases commonly exist between model simulated ozone and ground site measurements.8,9 Previous studies have found that complex patterns of vertical transport of ozone affect model simulation accuracy significantly.10–13
Near-surface and aloft measurements are often used to quantify uncertainties in model simulations.14–17 There have been dozens of large-scale campaigns in Southern California, including the Southern California Ozone Study (SCOS) and the California Research at the Nexus of Air Quality and Climate Change study (CALNEX). In those and other studies, the deployment of airborne instrumentation is often limited in duration and domain, and generally are restricted to heights of 1 km and above. Recently, the surface to a few hundred-meter layer void is being filled through use of unmanned aerial vehicle (UAV) technology for earth science applications. Chen et al.,18 Guimarães et al.,19 Gronoff et al.,20 and Tirado et al.21 have carried out ozone vertical profile measurements using UAVs over Shanghai, Amazonia urban areas, and Chicago, respectively. Their successful deployments highlight the value of UAV measurements for air composition characterization and vertical distribution assessment.
In this paper, we discuss the results from a 4 month-long campaign during which a UAV was used to measure daily vertical profiles of ozone and particulate matter. The UAV was deployed from August to November 2020, resulting in 321 vertical profiles from the surface to 500 m above ground level (AGL) collected in the early mornings and late afternoons when the atmosphere is generally most stratified. The measured ozone concentration profiles are statistically compared with monitoring station measurements and Community Multiscale Air Quality (CMAQ) model simulations. The height of the top of the planetary boundary layer (PBL) estimated from a ceilometer is leveraged to help understand the potential contributors to CMAQ model bias related to vertical meteorological structure. CMAQ sensitivities to PBL height, eddy diffusivity, NOx emissions, and VOC emissions are investigated due to their importance in vertical pollution profiles in the model.
2 Methods
2.1 Site description
The city of Riverside is located in the SoCAB of Southern California, approximately 80 km east of downtown Los Angeles. In 2020, it had a population of 314![[thin space (1/6-em)]](https://www.rsc.org/images/entities/char_2009.gif) 998 over an area of 211.17 km2. The mean accumulated precipitation from August to November in 2020 was approximately 0 mm (University of California, Riverside). The monthly mean surface air temperature during the measurement period was between 17.72 °C and 26.22 °C. The launch site (Fig. 1) is inside the University of California, Riverside's Agricultural Operations Research Station (33.965083, −117.342417). The Agricultural Operations area is mainly covered by citrus trees and various other plants. The launch site is located in suburban Riverside and is approximately 1.2 km southwest of U.S. Interstate 215.
998 over an area of 211.17 km2. The mean accumulated precipitation from August to November in 2020 was approximately 0 mm (University of California, Riverside). The monthly mean surface air temperature during the measurement period was between 17.72 °C and 26.22 °C. The launch site (Fig. 1) is inside the University of California, Riverside's Agricultural Operations Research Station (33.965083, −117.342417). The Agricultural Operations area is mainly covered by citrus trees and various other plants. The launch site is located in suburban Riverside and is approximately 1.2 km southwest of U.S. Interstate 215.
2.2 Platform and instrumentation
In this study, a customized hexacopter UAV (model Matrice 600 Pro; DJI Innovations, China) was used as the flight platform (Fig. 2). It has a maximum flight duration of about 30 minutes and a maximum payload weight of 5 kg. Flight records including flight time, speed, altitude, latitude, and longitude were retrieved from the DJI GO app.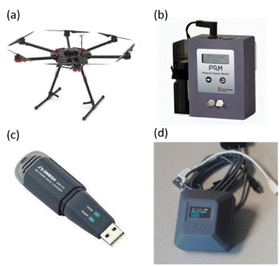 | ||
| Fig. 2 The experimental system included the (a) DJI Matrice 600 Pro, (b) 2B Personal Ozone Monitor, (c) OM-141 temperature and humidity data logger, and (d) APT MINIMA particle sensor. | ||
A Personal Ozone Monitor (POM; 2B Technologies, Inc., Colorado, USA) was mounted inside an enclosure with a short, perfluoroalkoxy (PFA)-lined inlet tube with 0.635 cm outside diameter extending outside and underneath the UAV's body. The ultraviolet absorption-based POM has a precision of the higher of 1.5 ppb or 2% of the reading. The POM's default adaptive filter to average the data was turned off to obtain the raw data. The measurement time interval was 2 s with a sampling flow rate of 0.8 L min−1 to obtain a vertical resolution of approximately 1.2 m for the nominal ascent and decent rate of 0.6 m s−1. The raw data were averaged over a sliding window of length 30 across adjacent elements, and outliers were removed. Outliers were defined as the values that fall more than two standard deviations away from the mean in their respective windows.
Particulate matter concentration was measured using a MINIMA optical particle counter (Applied Particle Technology, California, USA). The MINIMA measures low-resolution size distributions and uses them to estimate PM1, PM2.5, and PM10 every 15 s. The data were uploaded to its vendor-hosted web interface via a mobile hotspot in real time.
Temperature and relative humidity were measured using a portable temperature and humidity data logger (OM-141; Omega Engineering Inc., Connecticut, USA). Its accuracy is ±1.0 °C for temperatures ranging from −10° to 40 °C and ±3% for relative humidity ranging from 20 to 80%.
2.3 UAV flights
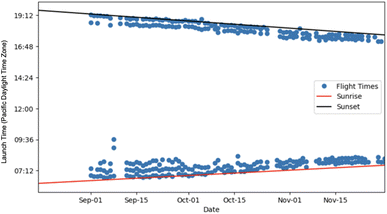
Between 16 August and 30 November 2020, 321 profiles were measured. Routine flights were conducted every day both early in the morning around sunrise and late in the afternoon around sunset as permitted by weather conditions. The flight operation times are shown in Fig. 3 with sunrise and sunset times as references. The morning flight time was selected when the PBL is theoretically at its lowest, while still providing sufficient light for safe UAV operations, while the afternoon flight time reflected the highest PBL. The UAV was controlled using the DJI GO app to fly a round trip vertically to 500 m above ground level at a constant vertical velocity of 0.6 m s−1. A waiver was approved by the Federal Aviation Administration (FAA) to allow flights up to 500 m AGL rather than the standard 120 m.2.4 Ground observation data
Ozone measurements from the South Coast Air Quality Management District (SCAQMD) Riverside-Rubidoux air monitoring site (33° 59′ 58′′N 117° 24′ 57′′W) were used for comparative analyses. The monitoring site is approximately 8 km northwest of the UAV launch site. Data were downloaded via the Air Quality and Meteorological Information System, which is managed by the California Air Resources Board (CARB).5 Observed boundary layer heights were estimated using data from a ceilometer (CL51; Vaisala Inc., Finland), also operated at the Riverside-Rubidoux air monitoring site. Boundary layer heights were assumed to be the height above ground level at which the gradient of the backscatter coefficient was most negative.2.5 CMAQ modeling description
The Community Multiscale Air Quality (CMAQ) model was used to simulate vertical ozone profiles for comparison with flight measurements. We chose CMAQ as it is widely used for NAAQS compliance purposes. CMAQ was used to simulate daily ozone mixing ratios from August to November 2020. Baseline emissions were modified accordingly to capture traffic reductions during periods of reduced anthropogenic activity caused by the COVID-19 pandemic. The model was compiled and run with the GFortran compiler on a dual Xeon workstation running the Ubuntu operating system. The model was run with a configuration provided by SCAQMD that has 4 km horizontal grid spacing and 11 vertical layers over the SoCAB. There are 7 layers that fall within the height range of UAV flights.The SAPRC07tc_ae6_aq chemical mechanism option (SAPRC07tc photochemical mechanism, aerosol module 6, and aqueous chemistry) was used due to its relevance to Southern California NOx-VOC-ozone regimes. Gridded emission inputs of 73 air pollutants were provided as daily emission files with hourly temporal resolution. Details of the SAPRC-07 gas-phase mechanism and an overview of CMAQ's governing processes may be found in the works of William P. L. Carter and Byun and Schere, respectively.22,23 The Weather Research and Forecasting (WRF) model version 3.9 was used to generate meteorological inputs for the CMAQ simulations. The optimal WRF options for the SoCAB are USGS land use, thermal diffusion surface physics scheme,24 and Yonsei University planetary boundary layer scheme.25 We combined initialization data from the North American Mesoscale (NAM) Forecast System with NOAA high-resolution sea surface temperature (SST) nudging to improve the accuracy of meteorological inputs.26
The innermost modeling domain has a horizontal grid spacing of 4 km (domain 3), covering fully the SCAQMD region (Fig. S1†), and domain 3 consisted of 156 × 102 grids nested one way within domains 1 (36 km) and 2 (12 km). More information on baseline model performance using this configuration can be found in a preceding study.27
The 2020 gridded emissions modification for CMAQ inputs was carried out using a two-step calculation. For the first step, lockdown-based 2020 SCAQMD emissions were modified from 2019 baseline emissions using a correction factor. The linear correction factor (eqn (1)) was based on previously acquired SCAQMD future emission projections from 2012 to 2034, from which 2020 pre-lockdown emissions estimates were obtained. The correction factor was applied for seven air pollutant groups (total organic gases, reactive organic gases, CO, NOx, SOx, NH3, PM) based on total annual emissions.
 | (1) |
The second step involved correcting for lockdown-induced traffic volume reductions that began in March 2020 and slowly (but not fully) rebounded as 2020 progressed. Pre-lockdown SCAQMD emissions projections did not reflect the unforeseen traffic reduction that decreased actual mobile source emissions. The 2020 weekly traffic changes were derived from the CalTrans Performance Measurement System (PeMS), from which the changes in total traffic flow and speed at 2991 locations in Southern California were acquired.28 Since traffic observations were not evenly distributed over the 4 km model domain, we used the k-nearest neighbors method to assign traffic data for grid cells with less than or equal to 5 PeMS observations. For grid cells with more than five data points, we first normalized the individual measurements by traffic volume and then averaged the normalized data.
We explore CMAQ model sensitivity to emissions of NOx and VOCs, eddy diffusivity, and PBL. The eddy diffusivity is used in the model to characterize the vertical mixing. We hypothesized that surface ozone concentration would be underestimated if vertical mixing was too strong (i.e., eddy diffusivity is too large). We also hypothesized that biases in diel PBL patterns would lead to discrepancies in modeled vertical profiles. The ESI† includes an explanation of CMAQ vertical mixing parameterization for reference.
3 Results and discussion
3.1 Vertical profile patterns
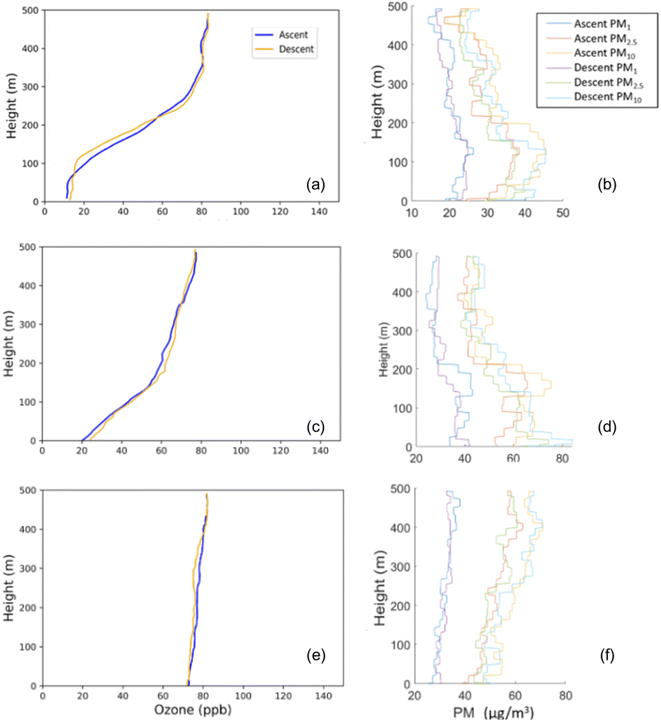
A total of 321 UAV profiles were collected in this study. A representative profile for the morning flights is shown in Fig. 4a and b, with the steep increase in ozone mixing ratio by more than 60 ppb between 100 and 300 m in altitude, indicating the height of the boundary layer. The PM2.5 and PM10 concentrations decreased by about 10 μg m−3 over the same altitude range, while the change in PM1 was not as pronounced. Another example of a morning profile is shown in Fig. 4c and d, in which the ozone mixing ratio shows a smooth change from about 20 ppb at the surface to over 80 ppb at 500 m AGL. This is consistent with the profile expected when ozone formation is slower than depletion in a vertically stratified layer. The PM profiles are similar to those in the preceding example, with PM2.5 and PM10 both decreasing by about 10 μg m−3 across the altitude range of 100 to 200 m.Late afternoon profiles typically show no strong gradient in ozone. In the Fig. 4e and f profiles, the ozone mixing ratio is nearly constant at 75 ppb from the surface to 500 m AGL. The PM2.5 and PM10 profiles increased gradually by about 10 μg m−3 with increasing altitude. This is believed to result from efficient vertical mixing accompanying boundary layer growth during the daytime. Consistent with the examples provided, the PM profiles were generally less influenced than the O3 profiles to the change in boundary layer heights between morning and afternoon.
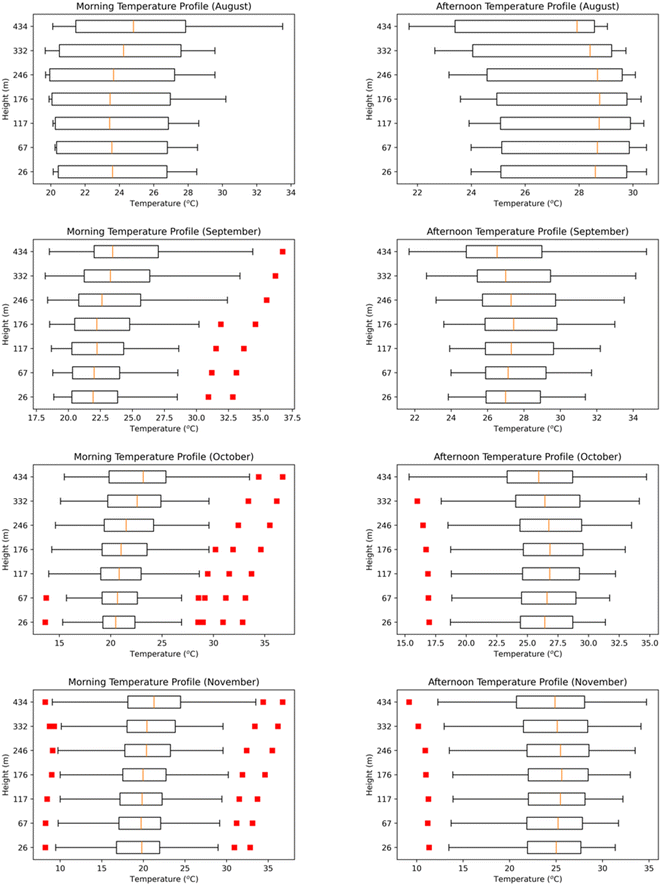
The morning ozone profiles exhibited a steep increase in ozone mixing ratio with respect to vertical height, as shown in Fig. 4a and c. On 4 September 2020 (Fig. 4a), the sunrise occurred at 6:26 AM, and the measurements started at 6:48 AM. Since the measurements began after sunrise, we observed the start of boundary layer mixing through the vertical ozone profile. In the first 100 meters above the ground, the change in ozone concentrations was minimal due to the heat flux. The 21 October 2020 afternoon vertical ozone profile is driven by the heat flux, resulting in little change in concentrations (Fig. 4e). We also examined the distribution of measured morning and afternoon temperature profiles (Fig. 5). Monthly median temperature increased with height in the morning profiles, which corresponds to the pattern of ozone increase with altitude in the morning. Afternoon temperature and ozone profiles reflect well-mixed conditions.
3.2 CMAQ model comparisons with ground and UAV measurements
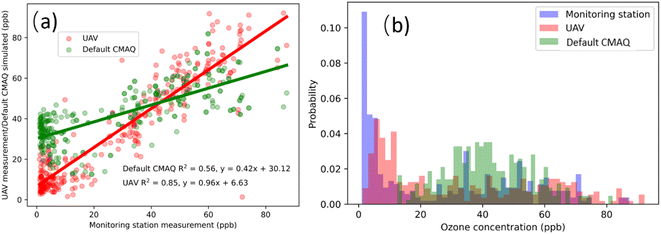
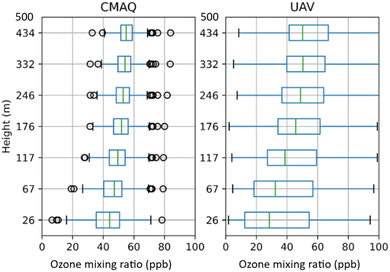
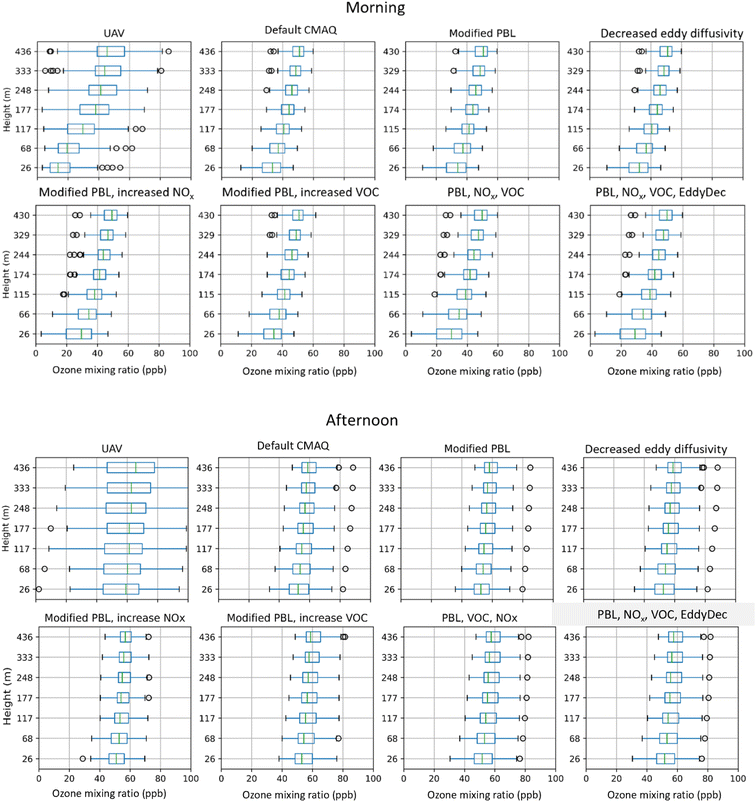
Measured ozone vertical profiles were compared to those from default CMAQ simulations and to ground observations from the Riverside-Rubidoux monitoring site. Fig. 6a shows the UAV-measured data and the hourly simulated data plotted against the monitoring site hourly data for the same period along with the linear regression fits. The average of the UAV measurements while below 5 m AGL and CMAQ's bottommost layer (height typically under 18 m AGL) are considered to be the ground-level concentrations in this analysis. The R2 for the relationship between the UAV and monitoring site data (0.85) is higher than that for the relationship between the CMAQ and monitoring site data (0.56). Based on the fitted equations, the default CMAQ model exhibits a notable bias towards high concentrations at low levels, while displaying lower sensitivity to elevated ozone concentrations. Compared with the results from the default CMAQ simulations, the frequency distribution of O3 measured by the UAV shown in the Fig. 6a also matches better with the ground monitoring observations (Fig. 6b).The box plot in Fig. 7 reveals that the interquartile range of the default CMAQ simulation does not reflect the broader range of that for UAV measurements near the ground in this case. The gradient of the vertical profile from the simulations is smaller than that from the UAV observations. The default CMAQ's difference performance across different altitudes highlights the necessity for exploring its responsiveness to various parameters.
3.3 Evaluation and model inter-comparisons
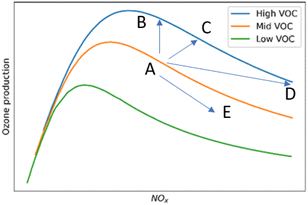
Ground-level ozone concentration is influenced by local ozone production, chemical and depositional loss, and mixing in both horizontal and vertical directions. CMAQ's performance varies across different altitudes, and the discrepancy exists in concentration gradients compared to UAV observations, which indicate bias from mixing in vertical direction. We posit that the bias from mixing in the vertical direction is mainly controlled by the model representations of the PBL. Ozone is formed via a series of photolytic reactions involving NOx and VOCs. The daily maximum surface ozone concentration varies nonlinearly with the precursor concentrations. This process is illustrated in Fig. 8, highlighting the nonlinear relationship between the concentrations of O3, NOx, and VOCs. The sensitivity of modeled ozone concentration to the PBL, NOx concentration, and VOC concentration is explored in sections below by modifying key parameters: PBL height, eddy diffusivity, NOx emissions, and VOC emissions. The net photochemical O3 production rate, P(O3), can be written approximately as the following equation (eqn (2)):29 | (2) |
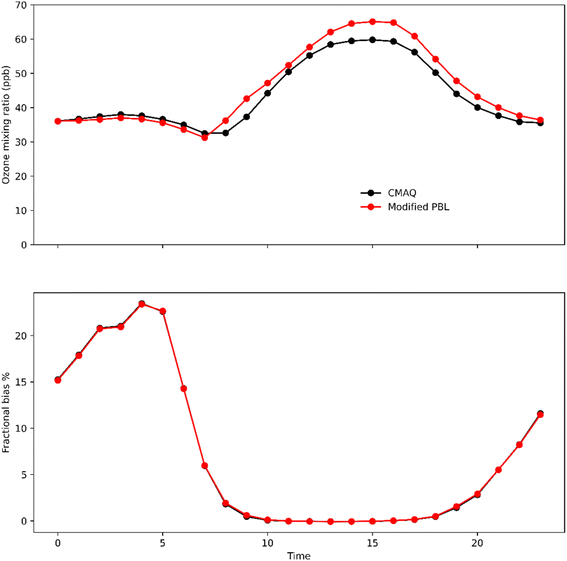
A lower PBL height will be associated with shallower vertical mixing and higher near-surface NOx and VOC concentration. In the daytime, higher precursor concentrations will generally lead to increased ozone production, while higher NOx concentration at night leads to overall consumption of ozone via its reactions with NO and NO2. PBL height was adjusted by applying a global correction factor to better reflect the ceilometer observations, which made the modeled PBL height higher in the nighttime and lower in the daytime (Fig. 9). Compared to the default PBL scheme, the modified PBL height led to a 2 ppb increase in the morning and a 0.6 ppb increase in the afternoon (Fig. 10), and slight improvement on decreasing the fractional bias of about 0.003% for all time ranges. Here, fractional bias is calculated using eqn (3), where M is the ozone mixing ratio from CMAQ, and O is the observed (ground-level) ozone mixing ratio.
 | (3) |
The mean surface ozone mixing ratios were 1.8 and 0.2 ppb lower than those from the default version of the simulation in the morning and afternoon, respectively (Fig. 11). The morning change is expected, reflecting higher concentrations of morning precursors. Referencing the path from A to D in Fig. 8, decreased eddy diffusivity is expected to lead to increased concentrations of NOx and VOC, though the change had relatively little impact on the modeled ozone profile gradients in the morning. The less pronounced decrease in afternoon ozone is the result of perturbing an already well-mixed afternoon state, and the modification impacts were not as significant as those observed in the morning. Compared to the default CMAQ, decreasing eddy diffusivity doesn't change the model performance on capturing lower and upper extremes.
Increasing VOC emissions by 30% with the modified PBL height increased the morning and afternoon ozone mixing ratios by 1.2 ppb (increasing the bias from +17.7 to +18.9 ppb) and 1.9 ppb (decreasing the bias from −2.9 to −1 ppb), respectively, compared with the results from the PBL-only modification. Ozone production increased with increased VOC emissions at high NOx, but the enhancement in resulting concentration was relatively small at low NOx, which is consistent with the A → B depiction in Fig. 8 for a range in the x-axis position of A.
We then increased both NOx and VOC emissions by 30% with the modified PBL height. The mean ground-level ozone mixing ratio decreased by 3.7 ppb (decreasing the bias from +17.7 to +14 ppb) and 0.8 ppb (increasing the bias from −2.9 to −3.7 ppb) in the morning and afternoon, respectively, compared with the results from the PBL-only modification. This result is the combination of all preceding scenarios and is depicted by the A → D path in Fig. 8. The net change in ozone production reflects a balance between the enhancement from increased VOC emissions and, as depicted, suppression from increased NOx emissions.
The height-dependent fractional bias between the modified modeled (M) and default model (O) values, as defined in eqn (3), is presented in Fig. 12. All the simulations have poor performance with fractional bias ranging from 50 to 80% for ground-level ozone mixing ratio in the morning. However, they show improved performance in the afternoon, with fractional biases ranging from −7 to 1% observed at all heights. Among all the modifications, that which combined modifying the PBL height, decreasing eddy diffusivity, and increasing NOx and VOC emission led to the lowest fractional bias of 55.4% for ground-level ozone in the morning. However, this combination of modifications ranks the second-worst for the fractional difference of −3.8% in the afternoon. The modified PBL height and increased VOC emissions simulation has the lowest ground-level fractional bias of 0.9% in the afternoon, while it has the largest ground-level fractional bias of 77% in the morning.
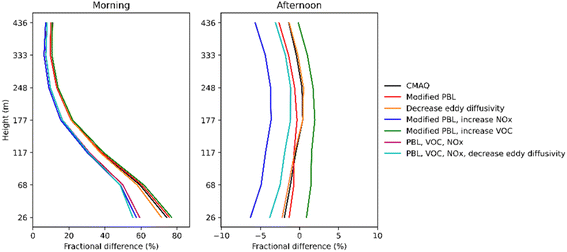 | ||
| Fig. 12 Fractional bias (%) between the UAV-measured and modeled ozone profiles. Results are averaged over all profiles. | ||
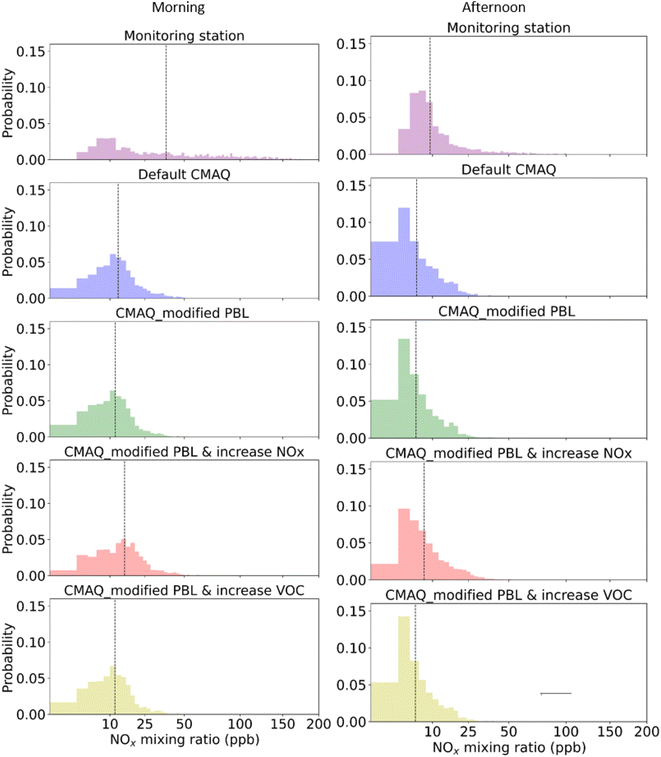
We also compared the frequency distribution of NOx concentration extracted from the model and that measured at the Riverside-Rubidoux monitoring station (Fig. 13). The median NOx concentration increased after modifying the PBL height, which agrees with the reduced mixing as expected. CMAQ underestimates NOx concentration significantly even after increasing NOx emissions by 30%. The median mixing ratio of the monitoring site observations is 5.1 ppb higher than that simulated in the default configuration of CMAQ. The underestimation of observed NOx indicates the potential underestimation of emissions in the current inventory.
Our findings are in agreement with Tang et al.31 that the vertical mixing doesn't strongly influence model performance in simulating ozone concentrations but plays an important role in influencing ozone sensitivity to NOx in some high ozone locations. Li et al.32 also found CMAQ model is not sensitive to the PBL modification. Overall, our findings suggest that NOx emissions modifications lead to the most significant changes in modeled vertical ozone profiles, with subtle changes due to vertical mixing modifications.
4 Conclusion
We describe a dataset collected during a four-month field campaign from August to November 2020 during which daily UAV flights were made to measure vertical ozone and particulate matter profiles from the University of California, Riverside's Agricultural Operations Field. Measured ozone mixing ratios were compared with ground observations from the SCAQMD Riverside-Rubidoux air monitoring site and with CMAQ model simulations. Vertical profiles captured the influence of the boundary layer in the early morning flights. UAV measurements at low altitude agreed well with the ground observations at the air monitoring site. However, CMAQ underestimated surface ozone by 2.9 ppb in the afternoon and overestimated it by 17.7 ppb in the morning. PBL height estimated from ceilometer data aided our understanding of the potential model biases due to meteorology. The PBL height observed from the ceilometer was lower in the daytime and higher at nighttime compared with the modeled PBL height. The model simulation had a larger bias near the ground than aloft.A sensitivity analysis to NOx and VOC emissions showed that an increase in NOx emission by 30% reduced surface ozone mixing ratios by 3.9 and 2.4 ppb in the morning and afternoon, respectively. The extracted NOx mixing ratios from the default model were 5.1 ppb lower than ground observations on average. As expected, ozone mixing ratios increased with increasing VOC emissions. The mean surface ozone mixing ratio was 1.2 ppb and 1.9 ppb higher in the morning and afternoon, respectively, after increasing VOC emission by 30%. Increasing both NOx and VOC emissions by 30% decreases ozone by 3.6 and 0.8 ppb in the morning and afternoon, respectively. It is useful to evaluate physics and emissions modifications in tandem to understand how multiple modifications may interact to change model outcomes for urbanized areas with high anthropogenic emissions over complex terrain. Future modeling studies may benefit from high temporal resolution vertical measurements near the surface, such as those provided by UAV platforms, to closely evaluate model performance and increase model accuracy in heavily burdened air basins.
Conflicts of interest
The authors declare no conflicts of interest for this work.Author contributions
Z. Z. & K. D.: conceptualization, data curation, methodology, formal analysis, writing – original draft; C. E. I. & D. R. C.: conceptualization, methodology, resources, supervision, writing – review & editing draft.Data availability
Data for this article are available at https://drive.google.com/drive/folders/1Mc13GsjX_h8XQxxKf8tNHM3PMGe9INlg?usp=sharing.References
- M. Jerrett, R. T. Burnett, C. A. Pope, K. Ito, G. Thurston and D. Krewski, et al., Long-Term Ozone Exposure and Mortality, N. Engl. J. Med., 2009, 360(11), 1085–1095 CrossRef CAS PubMed . Available from: http://www.nejm.org/doi/10.1056/NEJMoa0803894.
- S. C. Anenberg, L. W. Horowitz, D. Q. Tong and J. J. West, An Estimate of the Global Burden of Anthropogenic Ozone and Fine Particulate Matter on Premature Human Mortality Using Atmospheric Modeling, Environ. Health Perspect., 2010, 118(9), 1189–1195 CrossRef CAS PubMed . Available from: https://ehp.niehs.nih.gov/doi/10.1289/ehp.0901220.
- Intergovernmental Panel on Climate Change (IPCC), Climate Change 2013 – The Physical Science Basis: Working Group I Contribution to the Fifth Assessment Report of the Intergovernmental Panel on Climate Change, Cambridge University Press, 2014, available from: https://www.cambridge.org/core/product/identifier/9781107415324/type/book Search PubMed.
- J. H. Seinfeld and S. N. Pandis, Atmospheric Chemistry and Physics: from Air Pollution to Climate Change, John Wiley & Sons, Hoboken, New Jersey, 3rd edn, 2016, p. 1 Search PubMed.
- California Air Resources Board, Air Quality and Meteorological Information System, Latest Ozone Summary for Selected Regions, 2021, available from: https://www.arb.ca.gov/aqmis2/ozone_ytd.php Search PubMed.
- A. Gaudel, O. R. Cooper, G. Ancellet, B. Barret, A. Boynard, J. P. Burrows, et al., Tropospheric Ozone Assessment Report: Present-day distribution and trends of tropospheric ozone relevant to climate and global atmospheric chemistry model evaluation, Elementa: Science of the Anthropocene, ed. D. Helmig and A. Lewis, 2018, vol. 6, p. 39. Available from: https://online.ucpress.edu/elementa/article/doi/10.1525/elementa.291/112811/Tropospheric-Ozone-Assessment-Report-Present-day Search PubMed.
- M. J. Granados-Muñoz and T. Leblanc, Tropospheric ozone seasonal and long-term variability as seen by lidar and surface measurements at the JPL-Table Mountain Facility, California, Atmos. Chem. Phys., 2016, 16(14), 9299–9319 CrossRef . Available from: https://acp.copernicus.org/articles/16/9299/2016/.
- J. J. Guo, A. M. Fiore, L. T. Murray, D. A. Jaffe, J. L. Schnell and C. T. Moore, et al., Average versus high surface ozone levels over the continental USA: model bias, background influences, and interannual variability, Atmos. Chem. Phys., 2018, 18(16), 12123–12140 CrossRef CAS . Available from: https://acp.copernicus.org/articles/18/12123/2018/.
- K. R. Travis, D. J. Jacob, J. A. Fisher, P. S. Kim, E. A. Marais and L. Zhu, et al., Why do models overestimate surface ozone in the Southeast United States?, Atmos. Chem. Phys., 2016, 16(21), 13561–13577 CrossRef CAS . Available from: https://acp.copernicus.org/articles/16/13561/2016/.
- H. Akimoto, T. Nagashima, J. Li, J. S. Fu, D. Ji and J. Tan, et al., Comparison of surface ozone simulation among selected regional models in MICS-Asia III – effects of chemistry and vertical transport for the causes of difference, Atmos. Chem. Phys., 2019, 19(1), 603–615 CrossRef CAS . Available from: https://acp.copernicus.org/articles/19/603/2019/.
- J. D. Fast, J. Allan, R. Bahreini, J. Craven, L. Emmons and R. Ferrare, et al., Modeling regional aerosol and aerosol precursor variability over California and its sensitivity to emissions and long-range transport during the 2010 CalNex and CARES campaigns, Atmos. Chem. Phys., 2014, 14(18), 10013–10060 CrossRef.
- J. T. Lin and M. B. McElroy, Impacts of boundary layer mixing on pollutant vertical profiles in the lower troposphere: Implications to satellite remote sensing, Atmos. Environ., 2010, 44(14), 1726–1739 CrossRef CAS . Available from: https://linkinghub.elsevier.com/retrieve/pii/S1352231010001147.
- X. Li and B. Rappenglueck, A study of model nighttime ozone bias in air quality modeling, Atmos. Environ., 2018, 195, 210–228 CrossRef CAS . Available from: https://linkinghub.elsevier.com/retrieve/pii/S1352231018306460.
- G. C. Cuchiara, X. Li, J. Carvalho and B. Rappenglück, Intercomparison of planetary boundary layer parameterization and its impacts on surface ozone concentration in the WRF/Chem model for a case study in Houston/Texas, Atmos. Environ., 2014, 96, 175–185 CrossRef CAS . Available from: https://linkinghub.elsevier.com/retrieve/pii/S1352231014005342.
- J. Hu, C. J. Howard, F. Mitloehner, P. G. Green and M. J. Kleeman, Mobile Source and Livestock Feed Contributions to Regional Ozone Formation in Central California, Environ. Sci. Technol., 2012, 46(5), 2781–2789 CrossRef CAS . Available from: https://pubs.acs.org/doi/10.1021/es203369p.
- M. Mena-Carrasco, Y. Tang, G. R. Carmichael, T. Chai, N. Thongbongchoo and J. E. Campbell, et al., Improving regional ozone modeling through systematic evaluation of errors using the aircraft observations during the International Consortium for Atmospheric Research on Transport and Transformation, J. Geophys. Res., 2007, 112(D12) DOI:10.1029/2006JD007762 . Available from: https://agupubs.onlinelibrary.wiley.com/doi/10.1029/2006JD007762.
- G. Tang, X. Zhu, J. Xin, B. Hu, T. Song and Y. Sun, et al., Modelling study of boundary-layer ozone over northern China - part I: ozone budget in summer, Atmos. Res., 2017, 187, 128–137 CrossRef CAS . Available from: https://linkinghub.elsevier.com/retrieve/pii/S0169809516305130.
- Q. Chen, D. Wang, X. Li, B. Li, R. Song and H. He, et al., Vertical Characteristics of Winter Ozone Distribution within the Boundary Layer in Shanghai Based on Hexacopter Unmanned Aerial Vehicle Platform, Sustainability, 2019, 11(24), 7026 CrossRef CAS . Available from: https://www.mdpi.com/2071-1050/11/24/7026.
- Y. Guimarães, B. Batista and M. Ribeiro, et al., Vertical Profiles of Ozone Concentration Collected by an Unmanned Aerial Vehicle and the Mixing of the Nighttime Boundary Layer over an Amazonian Urban Area, Atmosphere, 2019, 10(10), 599 CrossRef . Available from: https://www.mdpi.com/2073-4433/10/10/599.
- G. Gronoff, J. Robinson, T. Berkoff, R. Swap, B. Farris and J. Schroeder, et al., A method for quantifying near range point source induced O3 titration events using Co-located Lidar and Pandora measurements, Atmos. Environ., 2019, 204, 43–52 CrossRef CAS . Available from: https://linkinghub.elsevier.com/retrieve/pii/S1352231019300846.
- J. Tirado, A. O. Torti, B. J. Butterworth, K. Wangen, A. Voon and B. Kies, et al., Observations of coastal dynamics during lake breeze at a shoreline impacted by high ozone, Environ Sci: Atmos., 2023, 3(3), 494–505 Search PubMed . Available from: http://xlink.rsc.org/?DOI=D2EA00101B.
- D. Byun and K. L. Schere, Review of the Governing Equations, Computational Algorithms, and Other Components of the Models-3 Community Multiscale Air Quality (CMAQ) Modeling System, Appl. Mech. Rev., 2006, 59(2), 51 CrossRef.
- W. P. L. Carter, Development of the SAPRC-07 chemical mechanism, Atmos. Environ., 2010, 44(40), 5324–5335 CrossRef CAS.
- M. Huang, B. Huang and A. H. Huang, Implementation of 5-layer thermal diffusion scheme in weather research and forecasting model with Intel Many Integrated Cores, in High-Performance Computing in Remote Sensing IV, 2014 Search PubMed.
- S. Y. Hong, Y. Noh and J. Dudhia, A New Vertical Diffusion Package with an Explicit Treatment of Entrainment Processes, Mon. Weather Rev., 2006, 134(9), 2318–2341 CrossRef . Available from: http://journals.ametsoc.org/doi/10.1175/MWR3199.1.
- R. W. Reynolds, T. M. Smith, C. Liu, D. B. Chelton, K. S. Casey and M. G. Schlax, Daily High-Resolution-Blended Analyses for Sea Surface Temperature, J. Clim., 2007, 20(22), 5473–5496 CrossRef . Available from: http://journals.ametsoc.org/doi/10.1175/2007JCLI1824.1.
- K. Do, M. Mahish, Z. Gao, A. Kashfi Yeganeh, C. L. Blanchard and C. E. Ivey, Emerging investigator series: a machine learning approach to quantify the impact of meteorology on tropospheric ozone in the inland southern California, Environ. Sci.: Atmos., 2023, 3, 1159–1173 CAS.
- S. Tanvir, D. Ravichandran, C. Ivey, M. Barth and K. Boriboonsomsin, Traffic, Air Quality, and Environmental Justice in the South Coast Air Basin During California's COVID-19 Shutdown, in Pandemic in the Metropolis, ed. A. Loukaitou-Sideris, A. M. Bayen, G. Circella and R. Jayakrishnan, Springer International Publishing, Cham, 2023, pp. 131–148. Available from: https://link.springer.com/10.1007/978-3-031-00148-2_9 Search PubMed.
- D. A. Rahn and C. J. Mitchell, Diurnal Climatology of the Boundary Layer in Southern California Using AMDAR Temperature and Wind Profiles, J. Appl. Meteorol. Climatol., 2016, 55(5), 1123–1137 Search PubMed . Available from: https://journals.ametsoc.org/view/journals/apme/55/5/jamc-d-15-0234.1.xml.
- R. A. Meyers, Encyclopedia of Physical Science and Technology, ScienceDirect, 2001, Available from: http://www.sciencedirect.com:5070/referencework/9780122274107/encyclopedia-of-physical-science-and-technology Search PubMed.
- W. Tang, D. S. Cohan, G. A. Morris, D. W. Byun and W. T. Luke, Influence of vertical mixing uncertainties on ozone simulation in CMAQ, Atmos. Environ., 2011, 45(17), 2898–2909 CrossRef CAS.
- X. Li and B. Rappenglück, A WRF–CMAQ study on spring time vertical ozone structure in Southeast Texas, Atmos. Environ., 2014, 97, 363–385 CrossRef CAS . Available from: https://linkinghub.elsevier.com/retrieve/pii/S135223101400630X.
Footnotes |
| † Electronic supplementary information (ESI) available. See DOI: https://doi.org/10.1039/d4ea00004h |
| ‡ Currently at: South Coast Air Quality Management District, Diamond Bar, California 91765, USA. |
| § Currently at: Department of Civil and Environmental Engineering, Northeastern University, Boston, Massachusetts 02115, USA. |
| ¶ Currently at: Department of Civil and Environmental Engineering, University of California Berkeley, Berkeley, California 94720, USA. |
| This journal is © The Royal Society of Chemistry 2024 |


