
 Open Access Article
 This Open Access Article is licensed under a
 Creative Commons Attribution 3.0 Unported Licence
Towards a better understanding of the HO2 uptake coefficient to aerosol particles measured during laboratory experiments
P. S. J.
Lakey
 ab,
T.
Berkemeier
c,
M. T.
Baeza-Romero
d,
U.
Pöschl
c,
M.
Shiraiwa
b and
D. E.
Heard
*a
ab,
T.
Berkemeier
c,
M. T.
Baeza-Romero
d,
U.
Pöschl
c,
M.
Shiraiwa
b and
D. E.
Heard
*a
aSchool of Chemistry, University of Leeds, Woodhouse Lane, Leeds, LS2 9JT, UK. E-mail: d.e.heard@leeds.ac.uk
bDepartment of Chemistry, University of California, Irvine, CA 92697, USA
cMax-Planck Institute for Chemistry, Multiphase Chemistry Department, Hahn-Meitner-Weg 1, 55128 Mainz, Germany
dDepartment of Physical Chemistry, School of Industrial and Aerospace Engineering, Institute of Nanoscience, Nanotechnology and Molecular Materials, Universidad de Castilla-La Mancha, 45071, Toledo, Spain
First published on 12th June 2024
Abstract
The first measurements of HO2 uptake coefficients (γHO2) onto suspended aerosol particles as a function of temperature are reported in the range 314 K to 263 K. For deliquesced ammonium nitrate (AN) particles γHO2 increases from 0.005 ± 0.002 to 0.016 ± 0.005 as the temperature is lowered over this range. For effloresced sodium chloride and ammonium sulphate particles, γHO2 decreases slightly from 0.004 ± 0.002 to 0.000 ± 0.002 and 0.002 ± 0.003, respectively, between 314 and 263 K. For AN particles doped with Cu2+ ions, we find γHO2 ≈ αHO2, the mass accommodation coefficient, which increases very slightly from αHO2 = 0.62 ± 0.05 to 0.71 ± 0.06 between 292 and 263 K with lowering temperature. New measurements of γHO2 are also reported for ammonium sulphate particles doped with a range of Fe2+ and Fe3+ concentrations. The dependence of γHO2 on Cu and Fe concentrations are reconciled with published rate coefficients using the kinetic multi-layer model of aerosol surface and bulk chemistry (KM-SUB). The model shows that in experimental studies using aerosol flow tubes, a time dependence is expected for γHO2 onto aerosol particles which do not contain transition metal ions due to a decrease in the gas-phase concentration of HO2 as a function of time. The model also demonstrates that Fenton-like chemistry has the potential to decrease γHO2 as a function of time for particles containing transition metal ions. For atmospherically relevant transition metal ion concentrations in aerosol particles, γHO2 can take a range of values depending on pH and the particle size from γHO2 < 0.04 to γHO2 = αHO2. γHO2 for larger particles (radius ≥ 0.5 μm) can be significantly reduced by gas-diffusion limitations.
Environmental significanceHO2 plays a crucial role in the oxidation chemistry of the atmosphere, but the numerical value of its uptake coefficient (γHO2) that is used in atmospheric modelling remains uncertain. In this study, experiments indicate that γHO2 for deliquesced and effloresced particles will increase with decreasing temperature. Literature rate coefficients are included in a kinetic model to better understand measured γHO2 trends as a function of time, gas-phase concentrations of HO2, and particle-phase concentrations of transition metal ions. The model demonstrates that γHO2 can vary significantly for different atmospherically relevant particles, reveals important factors that control γHO2, and identifies further experiments that could be performed to resolve uncertainties. |
1. Introduction
OH and HO2 radicals (collectively known as HOx) control the oxidative capacity of the troposphere and hence the lifetimes and concentrations of many trace species within the troposphere, such as NOx (NO and NO2) and volatile organic compounds (VOCs). The reaction of HO2 with NO is a major source of ozone, which can damage vegetation, is a respiratory irritant and a greenhouse gas.1,2 Gas-phase reactions controlling HOx concentrations have been extensively studied, and recommendations for rate coefficients, product branching ratios and photochemical parameters such as absorption cross-sections and photolysis quantum yields have been made for the wider community in models by panels of experts.3–5 Although there is also an IUPAC recommendation for heterogeneous reactions which includes HO2 uptake to aerosol particles,6 there remain uncertainties in processes which control the uptake coefficient γHO2. Over more than two decades, measurements during field campaigns, particularly at lower levels of NOx, have often shown lower HO2 concentrations than predicted by box models containing a mechanism for gas-phase reactions and which have been constrained to other measured species.7–23 The overprediction by the models has often been attributed, at least in part, to HO2 uptake by aerosol particles, although for some earlier studies in coastal regions this conclusion was reached when HO2 loss via reactions with halogen oxides was not recognised and hence not included in the model.Parameterisations of γHO2 for use in atmospheric models have been suggested for a number of modelling studies.24,25 Modelling studies often use a single value of γHO2 = 0.2 (e.g. Jacob26), and studies using the GEOS-Chem model suggested that increases in ozone levels in China were driven by the decrease in levels of PM2.5 in response to government legislation, because PM2.5 scavenges HO2 which would otherwise react with NOx to generate O3.25 Song et al.27 recently developed a new parameterisation for γHO2 that depends both on measured concentrations of Cu2+ within field-sampled aerosol particles and the aerosol liquid water content, the latter calculated from the measured relative humidity (RH). The parameterisation was applied in a multiphase reaction kinetic model, which predicts values of γHO2 that varied significantly during a given field campaign, suggesting a single value of γHO2 is not appropriate.27,28 Moreover, several field measurements of HO2 in China together with modelling studies, some of which utilise this new parameterisation, do not support an important role for heterogeneous uptake of HO2 except under low concentrations of NOx.27,29 Guo et al.30 reported a theoretical evaluation of the roles of several factors which control γHO2 for spherical aerosol particles containing a range of Cu2+ ion concentrations. The study also showed that the use of a single value of γHO2 for aerosol particles of different size, composition or physical state was not appropriate, and concluded that both careful selection of the appropriate value of γHO2 should be made for modelling studies and that further laboratory measurements are needed. However, this theoretical analysis is based on a modified resistor model with some limitations; for example, it does not take into account second-order reactions of HO2 nor the presence of any pH gradient inside of the aerosol particle due to reaction. Similarly, Li et al.31 also recently used a resistor model to investigate the effect of variables such as the HO2, Fe and Cu concentrations on γHO2 and demonstrated that a wide range of γHO2 values were expected.
Taketani et al.32 measured values of γHO2 from 0.09–0.40 from regenerated aerosol particles of water extracts from ambient aerosol particles at two mountain sites in China, which together with aerosol composition measurements suggested a key role for transition metals in controlling HO2 uptake. Recently Zhou et al. reported values of γHO2 using online HO2 reactivity measurements under ambient conditions in two Japanese cities with a system that enriches ambient aerosol particles.33–35 Using an auto-switching aerosol filter, Zhou et al. were able to isolate the loss of HO2 due to heterogeneous uptake, with an average γHO2 of 0.24, but displaying considerable variability, and concluding that a single value of γHO2 should not be used in modelling studies. Using a chemical transport model, Ivatt et al.36 showed that for some parts of the world the dominant chain termination reaction was not reaction of OH with NO2 to form nitric acid, nor reaction of RO2 with HO2 to form peroxides, but rather the reactive removal of HO2 onto aerosol surfaces, placing these regions into a new “aerosol inhibited” photochemical regime.
There are still relatively few laboratory studies that have investigated the γHO2 for different types of aerosol particles, with a large variance in the values reported. Small uptake coefficients are reported in some studies for effloresced (solid, γHO2 < 0.004) and deliquesced (aqueous, 0.004 < γHO2 < 0.02) aerosol particles containing organic compounds and inorganic salts.37–39 However, other studies have measured much larger γHO2 for these solid (γHO2 < 0.01–0.05) and aqueous (γHO2 = 0.09–0.19) aerosol particles.39–42 Li et al.31 have recently demonstrated that differences in γHO2 between studies may be in part due to different experimental HO2 concentrations. Lakey et al.43 reported a large difference (∼4 orders of magnitude) between rate coefficients of aqueous phase HO2/O2− and Cu+/Cu2+ published in the literature,43,44 and those required to fit γHO2 measurements for aerosol particles containing a range of copper ion concentrations. Additional measurements of γHO2 as a function of Cu and Fe concentrations have recently been published, demonstrating that Cu must be greater than 10−5 M to significantly increase γHO2.27,31,42 By assuming a low pH ∼ 4 and a smaller rate coefficient (1.5 × 10⁷ M−1 s−1) between Cu2+ ions and HO2/O2− than had previously been used (8 × 10⁹ M−1 s−1), studies have been able to reproduce the increasing uptake coefficients with an increase of Cu concentrations.27,31 Li et al.31 were also able to reproduce an Fe-doped experiment by similarly lowering the rate coefficient between Fe3+ and HO2/O2−. It has been suggested that the lower rate coefficient between Cu2+ and HO2/O2− may reflect the overall rate coefficient expected in more acidic environments.27,31,45
A time dependence and a HO2 concentration dependence of γHO2 during some experiments38,46 have been observed, raising the question of which value should be used within an atmospheric model. A larger value of γHO2 was measured at lower HO2 concentrations, which is inconsistent with the assumption that the uptake is controlled by HO2 self-reaction within the aerosol particle.38,47 Thus, there are still uncertainties regarding γHO2 in terms of discrepancies between field measurements and model calculations, different laboratory studies and reported rate coefficients of HO2/O2− with Cu+/Cu2+ in the aqueous phase.
Previous studies48–50 measured the uptake coefficient of HO2 at low total pressure (1–3 torr in He) on dry surfaces or solid films of ammonium nitrate, sodium chloride and bromide, and magnesium chloride over a range of temperatures between 240–345 K, with the uptake coefficient decreasing significantly with increasing temperature. There have also been several studies of γHO2 onto sulphuric acid aerosol particles at room temperature39 as well as onto surfaces coated with sulphuric acid at lower temperatures.51–53 The γHO2 onto sulphuric acid also appeared to be temperature dependent with an uptake coefficient of <0.01 and >0.2 measured at 295 K and 243 K, respectively. Field measurements have shown that a larger γHO2 is required to explain the difference between measured and predicted HO2 concentrations at low temperatures.15,47 However, to the best of our knowledge, currently there is no study investigating the temperature dependence of γHO2 onto suspended deliquesced and effloresced aerosol particles.
In this paper we report the first systematic measurements of γHO2 for effloresced and deliquesced ammonium nitrate, sodium chloride and ammonium sulphate aerosol particles as a function of temperature. Measurements of γHO2 for (NH4)2SO4 particles containing variable concentrations of CuSO4, FeSO4 and (NH4)2Fe(SO4)2 are also made. In addition, a simplified mechanism for aerosol uptake of HO2 incorporated within the kinetic multi-layer model of aerosol surface and bulk chemistry (KM-SUB) is used to examine the chemical and physical processes that control γHO2, to rationalize uncertainties and compare the measurements in this work with earlier studies.27,31,38–40,42,43
2. Methods
2.1. General description of apparatus
Experiments were performed using the setup first described by George et al.38 and used in other studies,37,43,46,54 and only a brief description is given here. Atomizer solutions used to generate aerosol particles were prepared by dissolving 5 grams of either sodium chloride (Fisher, 99.9%) or ammonium nitrate (Fisher, 99.9%) into 500 ml Milli-Q water. For some experiments, copper sulphate, iron sulphate or ammonium iron sulphate (Fisher 99.8%) was also added to the atomizer solutions. The concentration of copper and iron in the aerosol particles were estimated from the atomizer concentration solutions following the methodology described in Section 2.2. Aerosol particles were generated from these solutions in a flow of N2 using an atomizer (TSI 3076), and passed through a neutralizer (Grimm 5522), an impactor (TSI 1035900, 0.071 cm pinhole) and a HEPA (High Efficiency Particulate Air) filter/bypass allowing the particle concentration to be altered. Subsequently, the particle flow (1.0 ± 0.1 slpm) was mixed with a humidified flow of N2 (3.0 ± 0.1 slpm) in a conditioning flow tube for ∼10 seconds before entering the reaction flow tube. The size-resolved aerosol particle concentration was measured using a Scanning Mobility Particle Sizer (SMPS, TSI 3080) after the flow tube.HO2 radicals were formed by the photolysis of water vapour over a mercury lamp (L.O.T. Oriel, model 6035) in the presence of trace amounts of oxygen as shown below:
| H2O + hv (193 nm) → OH + H | (R1) |
| H + O2 + M → HO2 + M | (R2) |
The mercury lamp was placed at the end of the injector furthest away from the reaction flow tube to reduce localized heating within the flow tube. The injector flow (1.32 ± 0.05 slpm), which contained the HO2 radicals, was released perpendicularly via several small holes into the main flow within the reaction flow tube. At the end of the flow tube, the HO2 radicals were sampled by a 1 mm diameter pinhole and entered a Fluorescence Assay by Gas Expansion (FAGE) detector, where they reacted with an excess of added NO to form OH radicals that were then detected by laser induced fluorescence (LIF) spectroscopy using the Q1(2) transition of the A2Σ+(v′ = 0) ← X2Πi (v′′ = 0) band at ∼308 nm.20,55 The FAGE detector was kept at low pressure (∼0.85 torr) using a combination of a rotary pump (Edwards, model E1M80) and a roots blower (EH1200). The relative HO2 LIF signal was converted to an absolute concentration following a calibration with a known concentration of HO2. The initial HO2 concentration exiting the moveable injector was varied by altering the current supplied to the mercury lamp and after dilution with the main flow was in the range ∼2.4 × 108 cm−3 to ∼2.7 × 109 cm−3.
Two experimental methodologies were used to measure the HO2 uptake coefficient, γHO2,38 referred to as the ‘moving injector’ method and the ‘fixed injector’ method. For ‘moving injector’ experiments, the injector that released the HO2 radicals was moved backwards and forwards along the reaction flow tube and the decay of HO2 measured both in the absence of and presence of different aerosol particle number concentrations. The decays were performed for reaction times between 10 to 20 seconds, with time zero defined as when HO2 is injected into the main flow, allowing time for full mixing. For ‘fixed injector’ experiments the injector was placed in 6 different positions along the flow tube (equivalent to reaction times of ∼5, 8, 11, 14, 17 and 20 seconds) and the HO2 signal was measured as the aerosol particle concentration in the flow tube was changed. The main difference between these two methodologies is that for the ‘moving injector’ experiments the measured γHO2 is equivalent to the average γHO2 for a reaction time between 10–20 seconds, whereas for the ‘fixed injector’ experiments γHO2 is equivalent to the average γHO2 between 0 seconds (point of mixing of HO2 and aerosol particles) and the reaction time corresponding to the fixed position of the injector.
2.2. Moving injector experiments
For ‘moving injector’ experiments (which is the methodology used for the majority of HO2 aerosol uptake experiments), the HO2 decay along the flow tube in the absence and presence of different aerosol particle concentrations was assumed to follow first-order kinetics as follows:| ln[HO2]t = ln[HO2]0 − kobst | (E1) |
 | (E2) |
2.3. Fixed injector experiments
For ‘fixed injector’ experiments the injector was placed in one position at a time and the HO2 signal was recorded whilst the aerosol particle concentration was varied. The HO2 signal when aerosol particles were present could be described by the following equation: | (E3) |
 | (E4) |
Subtraction of (E3) and (E4) gives:
 | (E5) |
Therefore, for a given injector position, dividing ln[HO2]t,aerosol=0 − ln[HO2]t,aerosol by t gives a value of kaerosol for each aerosol particle surface area concentration. The Brown correction was then applied to obtain k′ and eqn (E2) was used to obtain γHO2, which was then corrected for gas phase diffusion limitations, but as for the moving injector experiments this changed the values by less than 1%.
A range of moving and fixed injector experiments were performed for a range of experimental conditions.
2.4. Temperature-dependent experiments of γHO2
For some experiments the temperature was varied between −10 °C (263 K) and 40 °C (313 K) by flowing a 50![[thin space (1/6-em)]](https://www.rsc.org/images/entities/char_2009.gif) :50 mixture of water and ethylene glycol, which had been cooled or heated using a refrigerated circulator (Thermo Scientific Haake, DC50-K35), through the jackets of both the conditioning flow tube and the main flow tube. Any axial or radial temperature gradients were measured within the flow tube, both along the top edge next to the jacket and along the centre of the flow tube using moveable thermocouples. As shown in Fig. 1, the temperature gradients are small, within 1 °C for almost the whole flow tube.
:50 mixture of water and ethylene glycol, which had been cooled or heated using a refrigerated circulator (Thermo Scientific Haake, DC50-K35), through the jackets of both the conditioning flow tube and the main flow tube. Any axial or radial temperature gradients were measured within the flow tube, both along the top edge next to the jacket and along the centre of the flow tube using moveable thermocouples. As shown in Fig. 1, the temperature gradients are small, within 1 °C for almost the whole flow tube.
 | ||
| Fig. 1 Temperature gradients along the flow tube when the chiller was set to −10 °C and 40 °C (the two extreme temperatures). The injector tip was radially centered and placed at 75 cm from the end of the flow tube, which was open to the atmosphere at 0 cm. The flows were the same as the flows used during experiments. | ||
Initially, attempts were made to place the entire Differential Mobility Analyser (DMA) in a freezer to maintain its temperature and relative humidity to be same as in the aerosol flow tube. However, temperature gradients developed in the freezer leading to convection within the DMA and no aerosol particles were measured. Therefore, the DMA was always kept at room temperature whilst the temperature in the conditioning and reaction flow tubes was varied. When the flow tube was not at room temperature, the relative humidity within it was different to the relative humidity in the DMA that was always kept at room temperature. When the flow tube was at a temperature that was lower than room temperature, the relative humidity in the flow tube would be greater than in the DMA, and therefore the total aerosol particle surface area would be larger in the flow tube than the surface area measured by the SMPS. Alternatively, when the flow tube was at a temperature that was higher than room temperature, the humidity in the flow tube was lower than in the DMA, which meant that the total aerosol particle surface area in the flow tube was smaller than the surface area measured by the SMPS. Therefore, when experiments were performed with aqueous aerosol particles at temperatures different to room temperature, a correction in the total aerosol particle surface area had to be made.
The Extended Aerosol Inorganic Model (E-AIM)58–60 can calculate the molar volume of an aqueous salt solution as a function of temperature and humidity at thermodynamic equilibrium. This model was run for the conditions in both the aerosol flow tube and the DMA. The following methodology was then used to correct the measured surface area in the SMPS to what it would have been within the aerosol flow tube.
Aqueous aerosol particles were assumed to be spherical and by using E-AIM to obtain the molar volume of an aqueous salt solution at different humidities the fractional change in volume is given by:
 | (E6) |
 | (E7) |
Therefore, by combining eqn (E6) and (E7), gives:
 | (E8) |
Eqn (E8) enables a correction for the total surface area of the aerosol particles when measured at a different humidity to that in the flow tube. For example, for a specific experiment performed using NaCl aerosol particles with the flow tube at 0 °C and the DMA at 20 °C, the relative humidity in the DMA was 18% compared to a relative humidity of 48% in the flow tube. This led to a 15% increase in the aerosol particle surface area measured by the SMPS. The flow rate and volume of the gas within the flow tube was also corrected to take into account the temperature.
It should be noted that the correction to the aerosol particle surface area limited the range of aqueous (deliquesced) aerosol particles that could be investigated to ammonium nitrate, as it does not effloresce over the range of temperatures and relative humidities studied. Deliquesced copper-doped ammonium nitrate aerosol particles appeared to grow or shrink in a similar way to pure ammonium nitrate aerosol particles for a given temperature, so it is assumed that the same growth curve can be applied for doped and non-doped AN. However, this methodology could not be used to apply a correction between effloresced and deliquesced aerosol particles for sodium chloride and ammonium nitrate aerosol particles. Even at 10 °C, to keep the RH in the DMA over the efflorescence humidity of sodium chloride and ammonium nitrate, the RH in the flow tube reactor would have to exceed 100% RH. If the relative humidity in the flow tube exceeded 100% RH there would be condensation on the flow tube walls leading to high wall losses and the aerosol particles would grow to form droplets which would be likely to be deposited and would be too large to be measured by the SMPS. Note that a high relative humidity in the flow tube at an elevated temperature could potentially lead to condensation in the DMA and therefore inaccurate measurements. Below the deliquescence point the aerosol particle surface area does not change with relative humidity for effloresced salts, the surface area remains constant as there is no aqueous phase which can increase or decrease in volume as the humidity changes, and so no surface area correction was required. However, when effloresced salt experiments were performed at different temperatures (ammonium sulphate and sodium chloride), it had to be ensured that the effloresced aerosol particles were never exposed to humidities above their deliquescence point.
The temperature range that was investigated in this work (263–314 K) is relevant for the atmosphere. Measurements have not been made at lower temperatures due to lack of HO2 sensitivity (due to higher wall losses), larger temperature gradients along the flow tube and droplet formation (since the RH exceeds 100%).
2.5. Description of the KM-SUB model
The kinetic multi-layer model of aerosol surface and bulk chemistry (KM-SUB) has previously been described in detail by Shiraiwa et al.61 and the adaptations for HO2 have also previously been outlined.54 Therefore, the model is only briefly described below. The KM-SUB model for HO2 uptake consists of different layers: a gas phase, a near-surface gas phase, a sorption layer and 100 bulk layers. Processes included within the model are gas-phase diffusion, adsorption and desorption to and from the surface of the aerosol particle, surface-bulk exchange, diffusion between the bulk layers of the aerosol particle as well as chemical reaction in the gas phase, the particle bulk, and on the walls of the flow tube. Each of these processes have been described in detail elsewhere.61,62 We assumed that the aqueous chemistry shown by reactions (R3)–(R17) below occurred within the aerosol particles. In the model, a gas-phase loss of HO2via its self-reaction (reaction (R18)) and an uptake of HO2 and H2O2 to the walls of the flow tube (Table 1) were included. For simplicity the pH in the aerosol particles was assumed to be constant without being influenced by the following reactions.| HO2(aq) ⇌ H+(aq) + O2−(aq) Keq | (R3) |
| HO2(aq) + HO2(aq) → H2O2(aq) + O2(aq) kBR,4 | (R4) |
| HO2(aq) + O2−(aq) + H2O(l) → H2O2(aq) + O2(aq) + OH−(aq) kBR,5 | (R5) |
| CuSO4(aq) + HO2(aq) → O2(aq) + Cu+(aq) + HSO4−(aq) kBR,6 | (R6) |
| CuSO4(aq) + O2−(aq) → O2(aq) + Cu+(aq) + SO42−(aq) kBR,7 | (R7) |
| Cu2+(aq) + HO2(aq) → O2(aq) + Cu+(aq) + H+(aq) kBR,8 | (R8) |
| Cu2+(aq) + O2−(aq) → O2(aq) + Cu+(aq) kBR,9 | (R9) |
| Cu+(aq) + HO2(aq) + H2O(l) → H2O2(aq) + Cu2+(aq) + OH−(aq) kBR,10 | (R10) |
| Cu+(aq) + O2−(aq) + 2H2O(l) → H2O2(aq) + Cu2+(aq) + 2OH−(aq) kBR,11 | (R11) |
| H2O2(aq) + Cu+(aq) → OH(aq) + OH−(aq) + Cu2+(aq) kBR,12 | (R12) |
| H2O2(aq) + CuSO4(aq) → HO2(aq) + HSO4−(aq) + Cu+(aq) kBR,13 | (R13) |
| Fe(SO4)+(aq) + HO2 (aq) → O2 (aq) + Fe2+(aq) + SO42−(aq) + H+(aq) kBR,14 | (R14) |
| Fe(SO4)+(aq) + O2−(aq) → O2(aq) + Fe2+(aq) + SO42−(aq) kBR,15 | (R15) |
| Fe2+(aq) + HO2(aq) + H2O(l) → H2O2(aq) + Fe3+(aq) + OH−(aq) kBR,16 | (R16) |
| Fe2+(aq) + O2−(aq) + 2H2O(l) → H2O2(aq) + Fe3+(aq) + 2OH−(aq) kBR,17 | (R17) |
| HO2(g) + HO2(g) → H2O2(g) + O2(g) kGP | (R18) |
| Parameter | Description | Value | Reference or comment |
|---|---|---|---|
| a Note that the rate coefficients for CuSO4 with O2−/HO2 have not been directly measured and uncertainty remains with regards to their values. b The rate coefficients with free Cu2+ are only used in Fig. 4(c) and for comparison with CuSO4 in Fig. 5(a). c The experimentally measured mass accommodation coefficients may be different from the surface accommodation coefficients if there are significant gas-phase diffusion limitations or if HO2 diffusing into the bulk becomes a limiting process but should otherwise equal the surface mass accommodation. | |||
| K eq | Equilibrium constant for reaction (R3) | 2.1 × 10⁻⁵ | Thornton et al.47 |
| k BR,4 | Rate coefficient for reaction (R4) | 1.3 × 10⁻¹⁵ cm3 s−1 | Thornton et al.47 |
| k BR,5 | Rate coefficient for reaction (R5) | 1.5 × 10⁻¹³ cm3 s−1 | Thornton et al.47 |
| k BR,6 | Rate coefficient for reaction (R6) | 1.7 × 10⁻¹⁴ cm3 s−1 | Mao et al.63 |
| k BR,7 | Rate coefficient for reaction (R7) | 1.7 × 10⁻¹³ cm3 s−1 | Mao et al.63 |
| k BR,8 | Rate coefficient for reaction (R8) | 1.7 × 10⁻¹³ cm3 s−1 | Jacob26 |
| k BR,9 | Rate coefficient for reaction (R9) | 1.3 × 10⁻¹¹ cm3 s−1 | Jacob26 |
| k BR,10 | Rate coefficient for reaction (R10) | 2.5 × 10⁻¹² cm3 s−1 | Jacob26 |
| k BR,11 | Rate coefficient for reaction (R11) | 1.6 × 10⁻¹¹ cm3 s−1 | Jacob26 |
| k BR,12 | Rate coefficient for reaction (R12) | 1.2 × 10⁻¹⁷ cm3 s−1 | Deguillaume et al.64 only included in Fig. 4(d) |
| k BR,13 | Rate coefficient for reaction (R13) | 7.6 × 10⁻¹⁹ cm3 s−1 | Pham et al.65 only included in Fig. 4(d) same rate coefficient as for Cu2+ is assumed |
| k BR,14 | Rate coefficient for reaction (R14) | 1.7 × 10⁻¹⁸ cm3 s−1 | Rush and Bielski66 |
| k BR,15 | Rate coefficient for reaction (R15) | 2.5 × 10⁻¹³ cm3 s−1 | Rush and Bielski66 |
| k BR,16 | Rate coefficient for reaction (R16) | 2.0 × 10⁻¹⁵ cm3 s−1 | Jacob26 |
| k BR,17 | Rate coefficient for reaction (R17) | 1.7 × 10⁻¹⁴ cm3 s−1 | Jacob26 |
| γ wall | Uptake coefficient of HO2 and H2O2 onto the walls of the flow tube | 6.50 × 10⁻⁶ | HO2 uptake is consistent with the data. An assumption of no products is made |
| k GP | Rate coefficient for HO2 self-reaction in the gas phase | 3 × 10⁻¹² cm3 s−1 | Sander et al.67 |
| H HO2 | Henry's law coefficient for HO2 | 5600 M atm−1 | Thornton et al.47 |
| H H2O2 | Henry's law coefficient for H2O2 | 1.65 × 10⁵ M atm−1 | Staffelbach and Kok68 |
| D b,all | Diffusion coefficient for all species within the aerosol particle bulk | 1 × 10⁻⁵ cm2 s−1 | Thornton et al.47 |
| α s,0 | Surface accommodation coefficientc of HO2 and H2O2 | 0.5 | These values are used unless otherwise stated |
| r p | Particle radius | 50 nm | |
| [HO2] | Initial HO2 concentration | 1 × 109 cm−3 | |
| τ d | Desorption lifetime | 1.0 × 10⁻¹¹ s | |
| D g | Gas phase diffusion coefficient of HO2 and H2O2 in the gas phase | 0.25 cm2 s−1 | Thornton et al.47 |
The rate coefficients for these reactions as well as other parameters that were included in the model are summarized in Table 1. It should be noted that most published Cu-doped experiments have been performed in ammonium sulphate particles, where sulphate concentrations are expected to be greater than 3 M for all relative humidities that have been investigated.27,31,39,40,42,43 Such high sulphate concentrations may cause Cu2+ to form a CuSO4 complex, following a published equilibrium constant for this complex formation of 230.63,69 Accordingly, at >3 M sulphate, CuSO4 concentrations should be significantly higher than Cu2+ concentrations. Thus, we assume that all Cu is present in the form of CuSO4 in the model for ammonium sulphate particles and that CuSO4 can participate in Fenton-like reactions (reaction (R13)). However, additional measurements are required to confirm that CuSO4 is the dominant species in the Cu-doped ammonium sulphate particles modeled in this work and that the equilibrium constant of 230 is valid under the experimental conditions. For the high sulphate concentrations in the experiments, most Fe3+ should form the Fe(SO4)+ and Fe(OH)2+ complexes.63 Both complexes are reported to have the same rate coefficient for their reaction with O2− and, for simplicity, the rate coefficient for the reaction of Fe(SO4)+ with HO2 is used.63,66 Sensitivity studies indicate that using the higher rate coefficient of kBR,14 = 2.2 × 10⁻¹⁶ cm3 s−1 for the reaction of Fe(OH)2+ with HO2 makes a negligible difference for the simulations performed in this work.63 Other parameters in Table 1 include the Henry's law constants of HO2 and H2O2 (HHO2 and HH2O2, respectively), the bulk diffusion coefficient of all species (Db), the desorption lifetime of HO2 and H2O2 (τd), the surface accommodation coefficient of HO2 and H2O2 onto an adsorbate-free surface (αS,0), the gas-phase diffusion coefficient of HO2 and H2O2 (Dg), and the radius (rp) and pH of the aerosol particles. Although the model is only applied to liquid particles in this work, it has the potential to be used for solid particles in the future by setting the partitioning coefficient into the bulk to zero. Transition metal concentrations in Cu or Fe doped ammonium nitrate or ammonium sulphate particles were calculated using the following equation:
 | (E9) |
The concentration of ammonium nitrate (AN) or ammonium sulphate (AS) in the particles was calculated for the flow tube relative humidity and temperature using the E-AIM.58–60 For simplicity we have not included activity coefficients in the model, but it is worth noting that their inclusion has the potential to decrease uptake coefficients. Concentrations were approximately 180 times higher in the particles than in the atomizer solutions.
KM-SUB outputs two different uptake coefficients. The true uptake coefficient (γHO2) is calculated using the near surface gas-phase concentration of a HO2 molecule, whereas the effective uptake coefficient (γHO2,eff) is calculated using the (far-surface) gas-phase concentration to derive the collision flux of HO2 onto the particle surface.62 Hence, γHO2,eff implicitly considers gas-diffusion effects and is typically the observable in measurements and an important variable in atmospheric models when no other form of gas-diffusion correction is performed. The near surface-gas phase concentration can be significantly smaller than the gas-phase concentration if there are gas-diffusion limitations, which can be the case for large particles and fast uptake.62 For most of the modelling performed in this work, the differences between γHO2 and γHO2,eff were negligible and we only report γHO2 for simplicity. In sensitivity tests that used large particles, a difference was observed and separate values for γHO2 and γHO2,eff reported (see the Results section).
3. Results
3.1. Temperature-dependent experiments of γHO2
The HO2 uptake coefficients as a function of temperature are summarized in Table 2, which also provides more information about the specific conditions of the experiments.| Temperature/K | Aerosol particle type | Effloresced or deliquesced | Relative humidity/% | Initial HO2 concentration/108 cm−3 | γ HO2 |
|---|---|---|---|---|---|
| 314 | Sodium chloride | Effloresced | 9 | 8.9 | 0.004 ± 0.002 |
| 304 | Effloresced | 25 | 6.6 | 0.002 ± 0.003 | |
| 292 | Effloresced | 36 | 9.8 | 0.004 ± 0.003 | |
| 284 | Effloresced | 39 | 17 | 0.001 ± 0.002 | |
| 274 | Effloresced | 57 | 6.0 | 0.001 ± 0.002 | |
| 263 | Effloresced | 40 | 5.3 | 0.000 ± 0.002 | |
| 314 | Ammonium sulphate | Effloresced | 10 | 10 | 0.002 ± 0.003 |
| 304 | Effloresced | 13 | 12 | 0.003 ± 0.002 | |
| 292 | Effloresced | 21 | 6.9 | 0.001 ± 0.002 | |
| 284 | Effloresced | 39 | 8.0 | 0.001 ± 0.001 | |
| 274 | Effloresced | 67 | 2.4 | 0.000 ± 0.002 | |
| 263 | Effloresced | 46 | 3.0 | 0.000 ± 0.001 | |
| 292 | Copper doped ammonium nitrate | Deliquesced | 33 | 12 | 0.62 ± 0.05 |
| 284 | Deliquesced | 33 | 13 | 0.71 ± 0.03 | |
| 275 | Deliquesced | 42 | 9.7 | 0.65 ± 0.03 | |
| 263 | Deliquesced | 43 | 6.1 | 0.71 ± 0.06 | |
| 312 | Ammonium nitrate | Deliquesced | 18 | 4.7 | 0.005 ± 0.002 |
| 302 | Deliquesced | 36 | 9.7 | 0.007 ± 0.002 | |
| 292 | Deliquesced | 45 | 13 | 0.005 ± 0.001 | |
| 284 | Deliquesced | 50 | 12 | 0.007 ± 0.003 | |
| 275 | Deliquesced | 52 | 6.1 | 0.010 ± 0.002 | |
| 263 | Deliquesced | 53 | 3.8 | 0.016 ± 0.005 |
Several studies have measured markedly different HO2 uptake coefficients onto solid ammonium sulfate surfaces compared to sodium chloride surfaces, which is indicative of different surface interactions with HO2.38,40,52 It is therefore important to make measurements for both compounds which are commonly found in atmospheric particles. For deliquesced aerosol particles, ammonium nitrate (AN) aerosol particles were chosen because they do not effloresce down to humidities of 0% and therefore a correction could be made for their surface area between the flow tube and the DMA (as described in Section 2.4), which will exhibit different relative humidities. Fig. 2(a) shows an example of the pseudo-first order rate coefficients for loss of HO2, k′, onto deliquesced ammonium nitrate aerosol particles as a function of aerosol particle surface area for the two temperatures, at 263 K (RH = 53%, [HO2]0 = 2.8 × 108 cm−3) and at 312 K (RH = 18%, [HO2]0 = 4.7 × 108 cm−3). Fig. 2(b) shows measurements of γHO2 as a function of temperature for deliquesced ammonium nitrate and effloresced ammonium sulphate and sodium chloride aerosol particles.
 | ||
| Fig. 2 Panel (a) k′ as a function of the surface area per unit concentration of ammonium nitrate aerosol particles at two different temperatures (T = 312 K, RH = 18%, initial [HO2] = 4.7 × 108 cm−3; T = 263 K, RH = 53%; initial [HO2] = 3.8 × 108 cm−3) and linear fits to experimental data; panel (b) measured γHO2 as a function of temperature for deliquesced ammonium nitrate, effloresced sodium chloride and effloresced ammonium sulphate aerosol particles. See Table 2 for conditions of these experiments. The errors represent two standard deviations of between 2 and 8 replicate experiments. | ||
The γHO2 measurements shown in Fig. 2 and summarized in Table 2, are the first measurements of γHO2 for suspended deliquesced or effloresced aerosol particles as a function of temperature. The γHO2 increases significantly as the temperature decreases for deliquesced ammonium nitrate particles, which is consistent with the trend in the work by Thornton et al.47 Although the rate coefficients (R4) and (R5) are likely to increase with increasing temperatures, the Thornton et al.47 model demonstrated that the effect of the Henry's law constant dominates over the rate coefficients to decrease γHO2 as the temperature increases. Therefore, with increasing temperature, the decrease in the γHO2 is the expected behaviour in deliquesced particles due to a smaller HO2 concentration in the bulk of the aerosol particle and available for self-reaction.
Although there are currently no measured γHO2 onto aerosol particles over a range of temperatures reported in the literature, several different studies have measured γHO2 onto aqueous sulphuric acid surfaces at low temperatures and onto aqueous sulphuric acid aerosol particles at room temperature. The γHO2 was measured to be < 0.01 at 295 K,39 > 0.05 at 249 K.53 > 0.2 at 243 K (ref. 52) and 0.055 ± 0.020 at 223 K.51 Overall, there appears to be an increase in γHO2 with decreasing temperature. However, no study has systematically measured γHO2 over a range of temperatures. Griffiths and Cox70 measured N2O5 uptake coefficients between 263 and 303 K onto aqueous ammonium sulphate and aqueous ammonium bisulphate aerosol particles at a relative humidity of 50%. The uptake coefficients varied from 0.005 ± 0.002 at 303 K to 0.036 ± 0.002 at 263 K for ammonium sulphate and from 0.003 ± 0.001 at 303 K to 0.036 ± 0.009 at 263 K for ammonium bisulphate.
The copper(I and II) and iron(II and III) concentrations in the atomiser solutions for all experiments were measured using Inductively Coupled Plasma Mass Spectrometry (ICP-MS) and it was found that although all solutions did contain trace metal contamination, the concentrations were less than 5 ppb. The estimated copper(II) molarity in the aerosol particles was always less than 5 × 10⁻⁵ M for both copper(I and II) and iron(II and III) over the range of temperatures and humidities used. As shown in Section 3.3 below, the observed γHO2 should therefore not be affected by these levels of trace metals, and trace metals can be ruled out as an explanation for the difference between the measurements in this work and those predicted by the Thornton et al.47 model. The limiting factors for HO2 uptake into non-copper doped aqueous ammonium nitrate aerosol particles is likely therefore to be solubility and the rate of reaction of HO2, both of which are temperature dependent.
As shown in Fig. 2(b) and Table 2, a slight increase in γHO2 with temperature is observed for the effloresced sodium chloride and ammonium sulphate particles, with γHO2 increasing from 0.000 ± 0.001 to 0.004 ± 0.003. However, some of the dependence may be due to a decrease in the relative humidity at higher temperatures (see Table 2 for details of experimental conditions), as it was not possible to keep the RH constant over the range of temperatures used as the flow tube and the DMA were at different temperatures. Measurements have previously shown that the presence of water vapor can block reactive sites on a solid surface and lead to a decrease in γHO2.71 Other factors, such as HO2 concentration affecting the uptake measured for these experiments, are also possible. We return to the effect of HO2 concentration in Section 3.2. below. In contrast to this work, Remorov et al.71 and Loukhovitskaya et al.72 observed a negative temperature dependence for HO2 uptake to solid coatings of sodium chloride with larger γHO2 at lower temperatures. The mass accommodation (αHO2) is likely to be temperature dependent as will be discussed below for copper doped aerosol particles. Both Remorov et al.71 and Loukhovitskaya et al.72 worked at 0% RH. However, when Remorov et al.71 increased the water vapour in their flow tube from [H2O] = 0 molecule per cm3 to [H2O] = 3 × 10¹⁵ molecule per cm3 the uptake coefficient decreased by 13 and 21% at 295 K (RH ∼0.5%) and 243 K (RH ∼28%), respectively. Therefore, the lower γHO2 at lower temperatures observed in this work may be due to the higher relative humidities that were utilised, meaning that this work is not inconsistent with the work by Remorov et al.71 and Loukhovitskaya et al.72
The mass accommodation coefficient, αHO2, onto aerosol particles is also expected to be dependent upon temperature. As for previous work, doping with aerosol particles with sufficient Cu(II) means that the uptake of HO2 is not limited by aqueous chemistry, rather by mass accommodation, and hence a measurement of γHO2 yields αHO2. Table 2 shows the results and also gives the conditions for measurements of the temperature dependence of the mass accommodation αHO2 as a function of temperature for copper(II)-doped ammonium nitrate aerosol particles. The aerosol particle copper(II) concentration was estimated as ∼0.7 M, for which the lifetime of HO2 within the aerosol particle is around 100 nanoseconds. It shows that the mass accommodation increases very slightly from αHO2 = 0.62 ± 0.05 to 0.71 ± 0.06 between 292 and 263 K which is consistent with known theory about the dynamics and kinetics of the gas–liquid interfaces. Bulk mass accommodation is expected to be temperature dependent following an Arrhenius-type relationship in which the Gibbs free energy barrier of the transition state between the gaseous and solvated phases, ΔGsolv, governs the temperature dependence of the process. ΔGsolv is usually negative for small molecules on aqueous solutions, hence leading to higher accommodation coefficients at lower temperatures.73 This is in part due to the strong temperature dependence of desorption and reversible adsorption, respectively, which are central to interfacial transport and gas-particle exchange.74
Due to the variability in the conditions of the experiments (e.g. RH, wall loss and HO2 concentration) and a large number of parameters (e.g. rate coefficients, Henry's law constants) required for the KM-SUB model where the temperature dependence is unknown, we did not attempt to calculate the temperature dependence of γHO2 with the model for comparison with experiments.
3.2. Dependence of γHO2 on reaction time and HO2 concentration
Fig. 3 shows an example of the measured pseudo-first-order rate coefficient for the loss of HO2, k′, as a function of aerosol particle surface area for deliquesced sodium chloride aerosol particles at 59% RH and T = 293 K for different reaction times using the fixed injector methodology. From eqn (E2), the gradient is proportional to γHO2, and it is evident from Fig. 3 that γHO2 decreases for larger reaction times.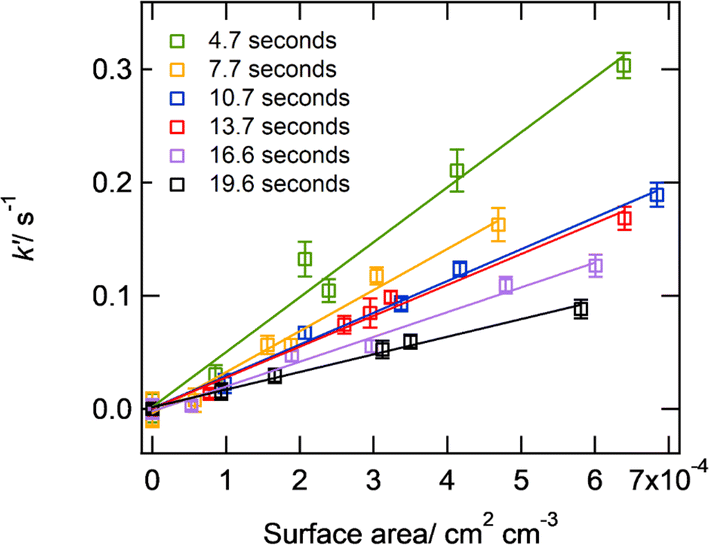 | ||
| Fig. 3 k′ as a function of the surface area per unit concentration of deliquesced sodium chloride aerosol particles at 59% RH and 293 ± 2 K, and for an initial HO2 concentration at time zero of 2.1 × 10⁹ molecule per cm3 for a variety of reaction times (injector position varying from 20–70 cm along the flow-tube) using the ‘fixed injector’ methodology. The solid lines represent linear-least squares fits to the data (eqn (2)). The error bars represent one standard deviation. | ||
Fig. 4(a) shows ‘moving injector’ measurements and modelling of the HO2 uptake coefficient as a function of the initial flow tube HO2 gas-phase concentration. The model predicts that γHO2 will increase with increasing HO2 concentrations and should be proportional to [HO2]g unless it becomes large enough to be limited by mass accommodation. This relationship has previously been described in Thornton et al.47 and a brief explanation follows. The γHO2 can be calculated as the net adsorption flux divided by the collision flux. Unless limited by mass accommodation, the adsorption flux should be controlled by reaction and therefore it is proportional to kBR,4[HO2]2 + kBR,5[HO2][O2−]. The collision flux is proportional to [HO2]g, resulting in γHO2 being proportional to [HO2]g. However, overall measurements collated from several studies do not appear to follow any trend and are quite scattered. Calculations performed using E-AIM suggest that (NH4)2SO4 particles should have a pH ≤ 4. Measurements were significantly higher than those predicted using the model suggesting that perhaps the pH was higher than expected or that trace metal contamination played a role in increasing γHO2 which will be explored further in Fig. 4(c) below. The measurement by Thornton and Abbatt at a high [HO2]g and with a particle buffered to pH = 5.1 was close to the modelled value. In contrast, most measurements with NaCl particles were smaller than the expected γHO2 for particles with a pH = 7, which may be partly due to the HO2 concentrations along the flow tube being lower than the initial HO2 concentration due to wall loss, gas-phase reactions, and uptake to particles. Changes in [HO2]g were not considered in the modelling of this figure and will be explored below.
 | ||
| Fig. 4 Panel (a): measurements (markers) and modelling (lines) of γHO2 as a function of HO2 concentration and pH for (NH4)2SO4 particles and NaCl particles. Measurements were performed using the ‘moving injector’ methodology. Panels (b–d): measurements (markers) and kinetic modelling (lines) of γHO2 as a function of time using the ‘fixed injector’ methodology. Experiments in panel (a) were performed with NaCl particles and initial HO2 concentrations of 2.1 × 109 cm−3 (green) and 7.1 × 108 cm−3 (red). The experiment in panel (c) was conducted with NH4NO3 particles and an initial HO2 concentration of 1 × 109 cm−3. The experiment in panel (d) was conducted using Cu doped (NH4)2SO4 particles and an initial HO2 concentration of 2.7 × 109 cm−3. NaCl particles are assumed to have a pH of 7 and Cu doped (NH4)2SO4 particles are assumed to have a pH of 4. Model simulation parameters are shown in Table 1. Measurements in panel (d) have previously been shown in George et al.38 (2013). In panel (a) a constant [HO2]g is assumed, while in panels (b–d) HO2 decreases along the flow tube. In panel (d) the black lines represent the modelled uptake coefficient in the absence of Fenton chemistry for particles containing [Cu(SO4)] = 0.6 M while the dashed blue line assumes that Fenton-like chemistry is occurring with an initial H2O2 concentration of 2 × 1012 cm−3, a particle number density of 105 cm−3 and a H2O2 uptake coefficient to the walls of 6.5 × 10⁻⁶. | ||
Fig. 4(b–d) show examples of γHO2 time dependence which were measured using the ‘fixed injector’ methodology for different aerosol particle compositions and conditions. For all examples, γHO2 decreases as a function of time. The kinetic model predicts this behaviour for particles that do not contain transition metals (Fig. 4(b and c)) and is able to reproduce the measured trends and the measurements within a factor of two for uptake to NaCl particles by accounting for HO2 loss along the flow tube. Gas-phase reactions, wall losses and uptake to particles account for 1–4%, 10–79% and 17–89% of the total HO2 loss, respectively, for the simulations shown in Fig. 4(b). Lower HO2 concentrations lead to lower uptake coefficients in the absence of metals as γHO2 is controlled by the aqueous self-reactions of HO2 (reactions (R4) and (R5)) as discussed above.
The kinetic model predicts that γHO2 would be higher if the initial HO2 concentration is higher, but the opposite trend is observed in measurements (Fig. 4(b)). Although the reason for the trend in the measurements remains uncertain, model sensitivity tests indicate that there are many factors that could influence the HO2 concentration along the flow tube and could potentially skew the uptake coefficient at a given time. For example, variability between experiments such as larger wall losses and higher particle concentrations can cause a reduction in the HO2 concentration and uptake coefficient. The kinetic model indicated that changing the concentration of the particles could lead to the trends observed during the measurements (Fig. 4(b)). Alternatively, it can be speculated that setting the lamp in the injector to a higher power to obtain higher initial HO2 concentrations may lead to slightly higher initial temperatures resulting in a lower HO2 partitioning coefficient and different initial mixing conditions. More H2O2 is also expected to exit the injector at higher HO2 concentrations which could potentially be converted back to HO2 by Fenton chemistry if there are trace transition metal contaminants in the particles, thereby effectively reducing γHO2. Note that although the ICP-MS measurements indicated low metal contamination, any contamination would become enhanced in the concentrated particles, and we cannot fully disregard contamination from impacting γHO2. However, the cause of the measured HO2 concentration dependence remains uncertain and warrants further investigation in the future.
Fig. 4(c) shows time dependent measurements of γHO2 for ammonium nitrate particles. The overall trend in the uptake coefficients as a function of time is similar to NaCl particles but γHO2 are significantly smaller. Ammonium nitrate aerosol particles have a lower pH than NaCl aerosol particles which causes the slower reaction (R4) to become more important compared to reaction (R5) and leads to less overall partitioning of HO2 into the particles (reaction (R3)). Calculations performed with the E-AIM model suggest that the pH of the ammonium nitrate particles should have been <4.58–60 However, with a pH of 4 the model underestimates γHO2 measurements significantly. Further sensitivity tests indicated that the measurements could be reproduced if contaminants increased the pH to 6 or if there was a small amount of transition metal contamination (e.g. [Cu2+] ∼2 × 10⁻⁷ M) which could be consistent with ICP-MS measurements. Note that uncertainty remains with regards to the formation of Cu complexes in ammonium nitrate particles and free Cu ion rate coefficients have been assumed for this simulation.
Fig. 4(d) shows an example of the significant time dependence of γHO2 for copper-doped ammonium sulphate particles. For these particles, the kinetic model predicts that there should be no time dependence in the experiments and that γHO2 should be approximately the same as the surface mass accommodation coefficient (Fig. 4(d)). This discrepancy between the model and the measurements could be due to and influenced by a variety of factors. Firstly, we cannot exclude the possibility that uneven mixing in the initial part of the flow tube, in the region before laminar flow is achieved, could be causing the measured initial high uptake coefficients. An alternative explanation that has been explored with the model is that Fenton-like chemistry may be occurring. H2O2 is formed in the injector from the self-reaction of HO2. As the ratio of HO2:H2O2 decreases along the flow tube, HO2 formation from Fenton-like chemistry becomes more important and the uptake coefficient decreases. Sensitivity tests indicated that the measurements were able to be reproduced well by assuming an initial H2O2 concentration of 2.5 × 1012 cm−3, a particle number density of 105 cm−3 and a H2O2 uptake coefficient to the walls of 6.5 × 10⁻⁶ (same value as for HO2) (Fig. 4(d)). However, further measurements and more complex modelling are required to better understand these trends and to determine whether Fenton-like chemistry is important in these experiments. It should also be noted that an assumption has been made that CuSO4 reacts with H2O2 in a similar way and with the same rate coefficient as Cu2+ reacting with H2O2. A different rate coefficient would impact the H2O2 concentration required to fit the measurements. Guo et al.30 determined the impact of the aqueous production of HO2 on the uptake coefficient. They concluded that the aqueous-phase production of HO2 is an important factor that influences γHO2. However, they did not elaborate which reactions exactly could be responsible for such production. In this work, we are proposing Fenton and Fenton-like chemistry as a possible route, at least in the experimental conditions, to explain this reformation of HO2.
3.3. Dependence of γHO2 on the Cu and Fe concentration
Fig. 5(a) and (b) show measurements from different studies of γHO2 as a function of Cu and Fe concentrations, respectively, as well as kinetic modelling results. The kinetic model can fit the measurements for Cu doped aerosol particles relatively well with literature rate coefficients if we assume that all Cu is present as CuSO4. The slower rate coefficients of CuSO4 with HO2/O2− compared to Cu2+ with HO2/O2− assumed in this work lead to lower γHO2 than if free Cu2+ ions were present in the particles (brown line, Fig. 5(a)). Note that for the free Cu2+ simulation, γHO2 is mainly controlled by the fast reactions of Cu2+ + O2− and Cu+ + HO2/O2− and that decreasing the rate coefficient of Cu2+ + HO2 has a negligible impact on γHO2 at pH = 4. It is necessary to vary the surface accommodation coefficient to obtain a good fit to different datasets (Fig. 5(a)). The varying measured mass accommodation coefficients are most likely an experimental artefact which may be due to mixing conditions, Fenton-like chemistry (as discussed above), activity coefficients (which are not treated in the model) or some other currently unknown process or reaction. A trend in the uptake coefficient onto Cu-doped aerosol particles as a function of relative humidity has been previously described although the reasons for this remain unclear.42 It should be noted that the Song et al.27 measurements, which the model does not reproduce, are performed at the lowest relative humidity of the different studies (∼43% RH). The model overestimates the uptake coefficient for Fe-doped particles (Fig. 5(b)), which may be due to Fe precipitation. Significant precipitation of iron was observed in the atomizer solutions one day after they were prepared in this work, which could also be occurring in the concentrated aerosol particles reducing its availability for reaction. Although the chemical formula of the precipitate has not been ascertained, it could be Fe(OH)2 or Fe(OH)3. Trace organics have also been shown to have the potential to reduce γHO2 onto Cu-doped aerosol particles.43 Note that sensitivity tests indicate that for atmospherically relevant copper concentrations, the uptake coefficient is independent of [HO2]g when [HO2]g is less than 1 × 1011 cm−3. | ||
| Fig. 5 Measurements (markers) and modelling (lines) of γHO2 as a function of (a, c and e) Cu molarity and (b, d and f) Fe molarity in AS particles. Fe experiments in this work were performed at 293 ± 2 K and 66 ± 2% RH. Panels (a and b) show model sensitivity tests for different surface mass accommodations. Panels (c and d) show model sensitivity tests as a function of pH. Panels (e and f) show model sensitivity tests as a function of particle radius. Model simulations are run with a constant HO2 concentration of 1 × 109 cm−3, αs = 0.5, pH = 4 and with a particle radius of 50 nm unless otherwise stated. The atmospherically relevant molarities of soluble iron (5.4 × 10⁻⁴ −0.27 M) and copper (1.3 × 10⁻⁴–0.018 M) in PM2.5 particles are shown by the blue shaded area. | ||
Fig. 5(c) and (d) show the same experimental measurements but with kinetic modelling pH sensitivity test results for atmospherically relevant aerosol particle pH values. Fitting results to measurements indicate that aerosol particles used in the experimental measurements are most likely to exhibit a pH ≤ 4, which is consistent with ammonium sulphate particles doped with copper and is also consistent with previous modelling work.27,31 Increasing the pH leads to higher uptake coefficients as the HO2 dissociates to form O2− and the effective partitioning coefficient into the particles increases. Changes in pH also lead to a change in the O2− to HO2 ratio resulting in a different overall rate of destruction (reactions (R6), (R7), (R14) and (R15)). However, decreasing the pH below 3 has a negligible effect for Cu-doped particles as HO2, which has a pKa of 4.7, is already almost entirely protonated and reaction (R6) dominates over reaction (R7).26 For the equivalent Fe reactions, there is a much larger difference between kBR,14 and kBR,15 leading to reaction (R15) controlling the uptake even at a low pH of 3.
The blue shaded area in Fig. 5 represents a typical range of total soluble iron and copper concentrations measured in different locations and cities in PM2.5 (Fe: 0.003–1.5% soluble mass fraction, Cu: 0.0008–0.11% soluble mass fraction75). For aerosol particles with a 50 nm radius shown in Fig. 5(c and d), γHO2 can be equal to a wide range of values in these Cu and Fe concentration ranges, depending on the actual soluble transition metal concentration and the pH. Note that the soluble Cu and Fe concentrations may be different for these smaller particles, but far fewer measurements exist compared to PM2.5.76–78 As of now measurements have been performed on ammonium sulphate particles but future measurements of γHO2 as a function of Cu and Fe concentrations should be performed for a wide range of particle compositions for the best comparison with atmospherically relevant concentrations and to gain a better understanding of how the particle composition can influence measurements. It should also be noted that the reaction of Cu+ + O2 → Cu2+ + O2− has not been included in the model simulations as many experiments were performed under nitrogen. Sensitivity studies indicate that the inclusion of this reaction with a rate coefficient of 7.6 × 10⁻¹⁶ cm−3 s−1 would lower the HO2 uptake coefficient by approximately 16–18% when [Cu] ≤ 10−3 M for particles with pH = 4.63,79 For higher Cu concentrations the reduction in the HO2 uptake coefficient becomes smaller and with a concentration of 1 M the HO2 uptake coefficient is only reduced by approximately 1%. Additional reactions could also be included in future versions of the model.63
Fig. 5(e–f) demonstrate the importance of aerosol particle size on γHO2. As the aerosol particle radius increases, γHO2 (calculated with the near surface gas-phase HO2 concentration) also increases due to larger volumes in which the reaction can occur for a given surface area. However, the effective γHO2 (calculated with the HO2 gas-phase concentration), which includes gas-phase diffusion limitations, is likely to be significantly reduced. For example, for 5 μm particles the effective uptake coefficient is predicted to be ∼0.04 over the atmospherically relevant Cu concentration range. This is consistent with a low Knudsen number of 0.034 for this particle radius, which according to gas-kinetic theory will cause a decrease in the near-surface gas concentration, leading to a significant decrease in the effective uptake coefficient in the atmospherically relevant range of transition metal concentrations.62 It should also be noted that for the simulations discussed above, no bulk diffusion limitations due to viscous particles or metal complexation is treated, but these factors have previously been studied and shown to have the potential to reduce γHO2 significantly for particles containing high transition metal concentrations.43,54
4. Discussion and outlook
Our measurements suggest that temperature has a large impact on γHO2, which is consistent with previous parameterizations and known theoretical frameworks.15,73 However, we are currently unable to constrain these measurements with our KM-SUB model due to the large number of uncertainties including the effect of temperature on the rate coefficients and Henry's law constants.The KM-SUB model has demonstrated that a time dependence of γHO2 is expected in flow tube experiments for particles that do not contain transition metal ions. The γHO2 is controlled by HO2 self-reaction in the aerosol particles and therefore decreases along the flow tube as [HO2]g decreases. High wall losses and high particle concentrations can cause γHO2 to decrease significantly as a function of reaction time, which should be acknowledged when analysing HO2 uptake measurement data in the future. This time dependence may increase with increasing RH, as wall losses and gas-phase reaction rate coefficients increase leading to lower HO2 concentrations along the flow tube.80 To obtain accurate γHO2 values it is necessary to use a model which accounts for decreasing HO2 concentrations along the flow tube.
The value of γHO2 onto particles containing transition metal ions also has the potential to be time dependent in experiments if Fenton-like chemistry is occurring. HO2 reformation from H2O2 would decrease the observed γHO2 as the HO2:H2O2 ratio decreases along the flow tube. Further but challenging experiments in which H2O2 concentrations are also measured would be required to confirm this. Gas-phase species such as H2O2, which partitions into aerosol particles in the aerosol flow tube and subsequently facilitates the formation of HO2, have the capacity to elucidate variations observed in the scientific literature concerning diverse laboratory assessments of γHO2 onto Cu-doped particles. There may also be trace organic impurities in the gases or water used in the experiments which decompose in the presence of metal ions forming HO2. Further investigations are required to determine whether any other species exist within the flow tube in addition to H2O2, that would form HO2 or O2− within the particle phase. For example, it is known that the trace O2 concentrations within the aerosol flow tube could react with trace iron and copper concentrations within the aerosol particles forming O2−.64,65 Alternatively, HO2 radicals could be formed from other mechanisms; for example, trace levels of O3 reacting with H2O2 can lead to the formation of radicals.81 The presence of gas-phase species which reform HO2 in the atmosphere may lead to a decrease in the effective γHO2. Further systematic measurements with known H2O2 and transition metal ions will be required to better understand the impact of ambient H2O2 concentrations in the atmosphere on the effective γHO2.
The KM-SUB model was able to reproduce measurements of the γHO2 as a function of Cu relatively well with parameters consistent with previous work.31 We speculate that the formation of CuSO4 may significantly reduce γHO2 in ammonium sulphate particles although this still needs to be further investigated. We demonstrate that increasing aerosol particle pH can significantly increase the uptake coefficient γHO2 of aerosol particles containing transition metal ions due to additional partitioning of HO2 into the particles and changes in the relative importance of different reactions. We have also demonstrated that although γHO2 will increase for larger particles, the effective uptake coefficient γHO2,eff, which includes gas-phase diffusion limitations, will decrease significantly. This may lead to γHO2,eff, which is the typical observable in experiments and parameter in atmospheric model simulations, being larger for smaller particles in the atmosphere.
It has been demonstrated that the value of γHO2 may vary significantly over the range of atmospherically relevant transition metal concentrations. This is consistent with previous measurements and modelling work.27,30–33,35,82 Many factors may influence the value of γHO2 that should be used in atmospheric box models, such as the concentration of soluble transition metal ions, the particle composition, the pH, the aerosol particle size, and the presence of any compounds which reform HO2. Other factors, such as bulk diffusion limitations or the presence of certain organics, can reduce γHO2. As discussed in our previous work, an increase in aerosol particle viscosity can lead to a significant decrease in γHO2 for copper doped aerosol particles by decreasing the rate of diffusion of HO2 into the aerosol particles.54 We have also previously observed a significant decrease in γHO2 from a value of the mass accommodation coefficient αHO2 to approximately two orders of magnitude less when oxalic acid is added to copper-doped aerosol particles.43 In the current work we have not treated the interactions of Cu and Fe in aerosols, which may enhance HO2 uptake, prevent iron precipitation in ambient aerosols, and should be investigated in follow-up studies.63,83 Transition metal distribution across all particles is usually assumed to be even by models. However, in reality, not all atmospheric particles contain transition metals that catalytically remove HO2 and enhance the value of γHO2. This was discussed in a recent study in which Khaled et al.84 hypothesise that γHO2 may be significantly lower for an atmospheric aerosol particle compared to an aerosol particle generated via atomisation in the laboratory using a bulk sample containing transition metal ions. Overall, additional experiments and modelling are required to fully understand the influence of different factors on the HO2 uptake coefficient.
Conflicts of interest
There are no conflicts of interest to declare.Acknowledgements
PSJL is grateful to the Natural Environmental Research Council (NERC) for the award of a studentship. DEH is grateful to the NERC for financial support via grant number NE/F020651/1. We are grateful to Ingrid George, Lisa Whalley and Trevor Ingham for technical assistance, and to Professor Jonathan Abbatt for useful discussions.References
- D. Fowler, K. Pilegaard, M. Sutton, P. Ambus, M. Raivonen, J. Duyzer, D. Simpson, H. Fagerli, S. Fuzzi and J. K. Schjørring, Atmospheric composition change: ecosystems–atmosphere interactions, Atmos. Environ., 2009, 43, 5193–5267 CrossRef CAS.
- U. Pöschl and M. Shiraiwa, Multiphase Chemistry at the Atmosphere–Biosphere Interface Influencing Climate and Public Health in the Anthropocene, Chem. Rev., 2015, 115, 4440–4475 CrossRef PubMed.
- R. A. Cox, M. Ammann, J. N. Crowley, H. Herrmann, M. E. Jenkin, V. F. McNeill, A. Mellouki, J. Troe and T. J. Wallington, Evaluated kinetic and photochemical data for atmospheric chemistry: Volume VII – Criegee intermediates, Atmos. Chem. Phys., 2020, 20, 13497–13519 CrossRef CAS.
- A. Mellouki, M. Ammann, R. A. Cox, J. N. Crowley, H. Herrmann, M. E. Jenkin, V. F. McNeill, J. Troe and T. J. Wallington, Evaluated kinetic and photochemical data for atmospheric chemistry: volume VIII – gas-phase reactions of organic species with four, or more, carbon atoms (≥ C4), Atmos. Chem. Phys., 2021, 21, 4797–4808 CrossRef CAS.
- J. Burkholder, S. Sander, J. Abbatt, J. Barker, C. Cappa, J. Crounse, T. Dibble, R. Huie, C. Kolb and M. Kurylo, Chemical Kinetics and Photochemical Data for Use in Atmospheric Studies; Evaluation Number 19, Jet Propulsion Laboratory, National Aeronautics and Space, Pasadena, CA, 2020 Search PubMed.
- M. Ammann, R. A. Cox, J. Crowley, M. E. Jenkin, A. Mellouki, M. J. Rossi, J. Troe and T. J. Wallington, Evaluated kinetic and photochemical data for atmospheric chemistry: Volume VI–heterogeneous reactions with liquid substrates, Atmos. Chem. Phys., 2013, 13, 8045–8228 CrossRef.
- W. H. Brune, D. Tan, I. F. Faloona, L. Jaegle, D. J. Jacob, B. G. Heikes, J. Snow, Y. Kondo, R. Shetter, G. W. Sachse, B. Anderson, G. L. Gregory, S. Vay, H. B. Singh, D. D. Davis, J. H. Crawford and D. R. Blake, OH and HO2 chemistry in the North Atlantic free troposphere, Geophys. Res. Lett., 1999, 26, 3077–3080 CrossRef CAS.
- C. A. Cantrell, R. E. Shetter, T. M. Gilpin and J. G. Calvert, Peroxy radicals measured during Mauna Loa observatory photochemistry experiment 2: The data and first analysis, J. Geophys. Res.: Atmos., 1996, 101, 14643–14652 CrossRef CAS.
- N. Carslaw, D. J. Creasey, D. E. Heard, P. J. Jacobs, J. D. Lee, A. C. Lewis, J. B. McQuaid, M. J. Pilling, S. Bauguitte, S. A. Penkett, P. S. Monks and G. Salisbury, Eastern Atlantic Spring Experiment 1997 (EASE97) - 2. Comparisons of model concentrations of OH, HO2, and RO2 with measurements, J. Geophys. Res.: Atmos., 2002, 107, ACH 5 Search PubMed.
- N. Carslaw, D. J. Creasey, D. E. Heard, A. C. Lewis, J. B. McQuaid, M. J. Pilling, P. S. Monks, B. J. Bandy and S. A. Penkett, Modeling OH, HO2, and RO2 radicals in the marine boundary layer - 1. Model construction and comparison with field measurements, J. Geophys. Res.: Atmos., 1999, 104, 30241–30255 CrossRef CAS.
- A. L. Haggerstone, L. J. Carpenter, N. Carslaw and G. McFiggans, Improved model predictions of HO2 with gas to particle mass transfer rates calculated using aerosol number size distributions, J. Geophys. Res.: Atmos., 2005, 110, D04304 CrossRef.
- L. Jaegle, D. J. Jacob, W. H. Brune, I. Faloona, D. Tan, B. G. Heikes, Y. Kondo, G. W. Sachse, B. Anderson, G. L. Gregory, H. B. Singh, R. Pueschel, G. Ferry, D. R. Blake and R. E. Shetter, Photochemistry of HOx in the upper troposphere at northern midlatitudes, J. Geophys. Res.: Atmos., 2000, 105, 3877–3892 CrossRef CAS.
- Y. Kanaya, R. Cao, S. Kato, Y. Miyakawa, Y. Kajii, H. Tanimoto, Y. Yokouchi, M. Mochida, K. Kawamura and H. Akimoto, Chemistry of OH and HO2 radicals observed at Rishiri Island, Japan, in September 2003: Missing daytime sink of HO2 and positive nighttime correlations with monoterpenes, J. Geophys. Res.: Atmos., 2007, 112, D11308 Search PubMed.
- Y. Kanaya, Y. Sadanaga, J. Matsumoto, U. K. Sharma, J. Hirokawa, Y. Kajii and H. Akimoto, Daytime HO2 concentrations at Oki Island, Japan, in summer 1998: Comparison between measurement and theory, J. Geophys. Res.: Atmos., 2000, 105, 24205–24222 CrossRef CAS.
- J. Mao, D. J. Jacob, M. J. Evans, J. R. Olson, X. Ren, W. H. Brune, J. M. St Clair, J. D. Crounse, K. M. Spencer, M. R. Beaver, P. O. Wennberg, M. J. Cubison, J. L. Jimenez, A. Fried, P. Weibring, J. G. Walega, S. R. Hall, A. J. Weinheimer, R. C. Cohen, G. Chen, J. H. Crawford, C. McNaughton, A. D. Clarke, L. Jaegle, J. A. Fisher, R. M. Yantosca, P. Le Sager and C. Carouge, Chemistry of hydrogen oxide radicals (HOx) in the Arctic troposphere in spring, Atmos. Chem. Phys., 2010, 10, 5823–5838 CrossRef CAS.
- S. C. Smith, J. D. Lee, W. J. Bloss, G. P. Johnson, T. Ingham and D. E. Heard, Concentrations of OH and HO2 radicals during NAMBLEX: measurements and steady state analysis, Atmos. Chem. Phys., 2006, 6, 1435–1453 CrossRef CAS.
- R. Sommariva, W. J. Bloss, N. Brough, N. Carslaw, M. Flynn, A. L. Haggerstone, D. E. Heard, J. R. Hopkins, J. D. Lee, A. C. Lewis, G. McFiggans, P. S. Monks, S. A. Penkett, M. J. Pilling, J. M. C. Plane, K. A. Read, A. Saiz-Lopez, A. R. Rickard and P. I. Williams, OH and HO2 chemistry during NAMBLEX: roles of oxygenates, halogen oxides and heterogeneous uptake, Atmos. Chem. Phys., 2006, 6, 1135–1153 CrossRef CAS.
- R. Sommariva, A. L. Haggerstone, L. J. Carpenter, N. Carslaw, D. J. Creasey, D. E. Heard, J. D. Lee, A. C. Lewis, M. J. Pilling and J. Zador, OH and HO2 chemistry in clean marine air during SOAPEX-2, Atmos. Chem. Phys., 2004, 4, 839–856 CrossRef CAS.
- P. S. Stevens, J. H. Mather and W. H. Brune, Measurement of tropospheric OH and HO2 by Laser Induced Fluorescence at low pressure, J. Geophys. Res.: Atmos., 1994, 99, 3543–3557 CrossRef CAS.
- D. Stone, L. K. Whalley and D. E. Heard, Tropospheric OH and HO2 radicals: field measurements and model comparisons, Chem. Soc. Rev., 2012, 41, 6348–6404 RSC.
- L. K. Whalley, K. L. Furneaux, A. Goddard, J. D. Lee, A. Mahajan, H. Oetjen, K. A. Read, N. Kaaden, L. J. Carpenter, A. C. Lewis, J. M. C. Plane, E. S. Saltzman, A. Wiedensohler and D. E. Heard, The chemistry of OH and HO2 radicals in the boundary layer over the tropical Atlantic Ocean, Atmos. Chem. Phys., 2010, 10, 1555–1576 CrossRef CAS.
- J. R. Olson, J. H. Crawford, W. Brune, J. Mao, X. Ren, A. Fried, B. Anderson, E. Apel, M. Beaver, D. Blake, G. Chen, J. Crounse, J. Dibb, G. Diskin, S. R. Hall, L. G. Huey, D. Knapp, D. Richter, D. Riemer, J. S. Clair, K. Ullmann, J. Walega, P. Weibring, A. Weinheimer, P. Wennberg and A. Wisthaler, An analysis of fast photochemistry over high northern latitudes during spring and summer using in-situ observations from ARCTAS and TOPSE, Atmos. Chem. Phys., 2012, 12, 6799–6825 CrossRef CAS.
- M. de Reus, H. Fischer, R. Sander, V. Gros, R. Kormann, G. Salisbury, R. Van Dingenen, J. Williams, M. Zöllner and J. Lelieveld, Observations and model calculations of trace gas scavenging in a dense Saharan dust plume during MINATROC, Atmos. Chem. Phys., 2005, 5, 1787–1803 CrossRef CAS.
- H. Macintyre and M. Evans, Parameterisation and impact of aerosol uptake of HO2 on a global tropospheric model, Atmos. Chem. Phys., 2011, 11, 10965–10974 CrossRef CAS.
- K. Li, D. J. Jacob, H. Liao, L. Shen, Q. Zhang and K. H. Bates, Anthropogenic drivers of 2013–2017 trends in summer surface ozone in China, Proc. Natl. Acad. Sci. U. S. A., 2019, 116, 422–427 CrossRef CAS.
- D. J. Jacob, Heterogeneous chemistry and tropospheric ozone, Atmos. Environ., 2000, 34, 2131–2159 CrossRef CAS.
- H. Song, X. Chen, K. Lu, Q. Zou, Z. Tan, H. Fuchs, A. Wiedensohler, D. R. Moon, D. E. Heard and M.-T. Baeza-Romero, Influence of aerosol copper on HO2 uptake: a novel parameterized equation, Atmos. Chem. Phys., 2020, 20, 15835–15850 CrossRef CAS.
- H. Song, K. Lu, H. Dong, Z. Tan, S. Chen, L. Zeng and Y. Zhang, Reduced Aerosol Uptake of Hydroperoxyl Radical May Increase the Sensitivity of Ozone Production to Volatile Organic Compounds, Environ. Sci. Technol. Lett., 2022, 9, 22–29 CrossRef CAS.
- H. Fuchs, Z. Tan, K. Lu, B. Bohn, S. Broch, S. S. Brown, H. Dong, S. Gomm, R. Häseler, L. He, A. Hofzumahaus, F. Holland, X. Li, Y. Liu, S. Lu, K. E. Min, F. Rohrer, M. Shao, B. Wang, M. Wang, Y. Wu, L. Zeng, Y. Zhang and A. Wahner, OH reactivity at a rural site (Wangdu) in the North China Plain: contributions from OH reactants and experimental OH budget, Atmos. Chem. Phys., 2017, 17, 645–661 CrossRef CAS.
- J. Guo, Z. Wang, T. Wang and X. Zhang, Theoretical evaluation of different factors affecting the HO2 uptake coefficient driven by aqueous-phase first-order loss reaction, Sci. Total Environ., 2019, 683, 146–153 CrossRef CAS PubMed.
- J. Li, Y. Sakamoto, K. Sato, Y. Morino and Y. Kajii, Investigation of HO2 uptake onto Cu (II)-and Fe (II)-doped aqueous inorganic aerosols and seawater aerosols using laser spectroscopic techniques, Environ. Sci.: Atmos., 2023, 3, 1384–1395 CAS.
- F. Taketani, Y. Kanaya, P. Pochanart, Y. Liu, J. Li, K. Okuzawa, K. Kawamura, Z. Wang and H. Akimoto, Measurement of overall uptake coefficients for HO2 radicals by aerosol particles sampled from ambient air at Mts. Tai and Mang (China), Atmos. Chem. Phys., 2012, 12, 11907–11916 CrossRef CAS.
- J. Zhou, K. Murano, N. Kohno, Y. Sakamoto and Y. Kajii, Real-time quantification of the total HO2 reactivity of ambient air and HO2 uptake kinetics onto ambient aerosols in Kyoto (Japan), Atmos. Environ., 2020, 223, 117189 CrossRef CAS.
- J. Zhou, K. Sato, Y. Bai, Y. Fukusaki, Y. Kousa, S. Ramasamy, A. Takami, A. Yoshino, T. Nakayama, Y. Sadanaga, Y. Nakashima, J. Li, K. Murano, N. Kohno, Y. Sakamoto and Y. Kajii, Kinetics and impacting factors of HO2 uptake onto submicron atmospheric aerosols during the 2019 Air QUAlity Study (AQUAS) in Yokohama, Japan, Atmos. Chem. Phys., 2021, 21, 12243–12260 CrossRef CAS.
- J. Zhou, Y. Fukusaki, K. Murano, T. Gautam, Y. Bai, Y. Inomata, H. Komatsu, M. Takeda, B. Yuan and M. Shao, Investigation of HO2 uptake mechanisms onto multiple-component ambient aerosols collected in summer and winter time in Yokohama, Japan, J. Environ. Sci., 2024, 137, 18–29 CrossRef CAS.
- P. D. Ivatt, M. J. Evans and A. C. Lewis, Suppression of surface ozone by an aerosol-inhibited photochemical ozone regime, Nat. Geosci., 2022, 15, 536–540 CrossRef CAS.
- P. S. J. Lakey, I. J. George, L. K. Whalley, M. T. Baeza-Romero and D. E. Heard, Measurements of the HO2 Uptake Coefficients onto Single Component Organic Aerosols, Environ. Sci. Technol., 2015, 49, 4878–4885 CrossRef CAS PubMed.
- I. J. George, P. S. J. Matthews, L. K. Whalley, B. Brooks, A. Goddard, M. T. Baeza-Romero and D. E. Heard, Measurements of uptake coefficients for heterogeneous loss of HO2 onto submicron inorganic salt aerosols, Phys. Chem. Chem. Phys., 2013, 15, 12829–12845 RSC.
- J. Thornton and J. P. D. Abbatt, Measurements of HO2 uptake to aqueous aerosol: Mass accommodation coefficients and net reactive loss, J. Geophys. Res.: Atmos., 2005, 110, D08309 Search PubMed.
- F. Taketani, Y. Kanaya and H. Akimoto, Kinetics of heterogeneous reactions of HO2 radical at ambient concentration levels with (NH4)2SO4 and NaCl aerosol particles, J. Phys. Chem. A, 2008, 112, 2370–2377 CrossRef CAS PubMed.
- F. Taketani, Y. Kanaya and H. Akimoto, Kinetic Studies of Heterogeneous Reaction of HO2 Radical by Dicarboxylic Acid Particles, Int. J. Chem. Kinet., 2013, 45, 560–565 CrossRef CAS.
- Q. Zou, H. Song, M. Tang and K. Lu, Measurements of HO2 uptake coefficient on aqueous (NH4) 2SO4 aerosol using aerosol flow tube with LIF system, Chin. Chem. Lett., 2019, 30, 2236–2240 CrossRef CAS.
- P. S. J. Lakey, I. J. George, M. T. Baeza-Romero, L. K. Whalley and D. E. Heard, Organics substantially reduce HO2 uptake onto aerosols containing transition metal ions, J. Phys. Chem. A, 2016, 120, 1421–1430 CrossRef CAS PubMed.
- M. Mozurkewich, P. H. McMurry, A. Gupta and J. G. Calvert, Mass Accommodation Coefficient For HO2 Radicals On Aqueous Particles, J. Geophys. Res.: Atmos., 1987, 92, 4163–4170 CrossRef CAS.
- B. H. J. Bielski, D. E. Cabelli, R. L. Arudi and A. B. Ross, Reactivity of HO2/O2- radicals in aqueous solution, J. Phys. Chem. Ref. Data, 1985, 14, 1041–1100 CrossRef CAS.
- P. S. J. Matthews, M. T. Baeza-Romero, L. K. Whalley and D. E. Heard, Uptake of HO2 radicals onto Arizona test dust particles using an aerosol flow tube, Atmos. Chem. Phys., 2014, 14, 7397–7408 CrossRef.
- J. A. Thornton, L. Jaegle and V. F. McNeill, Assessing known pathways for HO2 loss in aqueous atmospheric aerosols: Regional and global impacts on tropospheric oxidants, J. Geophys. Res.: Atmos., 2008, 113, D05303 CrossRef.
- Y. M. Gershenzon, V. Grigorieva, A. Y. Zasypkin, A. Ivanov, R. Remorov and E. Aptekar, Capture of HO2 radicals by an NH4NO3 surface at low temperatures, Russ. J. Phys. Chem. B, 1999, 18, 79–90 Search PubMed.
- R. Remorov, Y. M. Gershenzon, L. Molina and M. Molina, Kinetics and mechanism of HO2 uptake on solid NaCl, J. Phys. Chem. A, 2002, 106, 4558–4565 CrossRef CAS.
- E. Loukhovitskaya, Y. Bedjanian, I. Morozov and G. Le Bras, Laboratory study of the interaction of HO2 radicals with the NaCl, NaBr, MgCl2·6H2O and sea salt surfaces, Phys. Chem. Chem. Phys., 2009, 11, 7896–7905 RSC.
- P. L. Cooper and J. P. D. Abbatt, Heterogeneous interactions of OH and HO2 radicals with surfaces characteristic of atmospheric particulate matter, J. Phys. Chem., 1996, 100, 2249–2254 CrossRef CAS.
- Y. M. Gershenzon, V. M. Grigorieva, A. V. Ivanov and R. G. Remorov, O3 and OH sensitivity to heterogeneous sinks of HOx and CH3O2 on aerosol particles, Faraday Discuss., 1995, 100, 83–100 RSC.
- D. R. Hanson, J. B. Burkholder, C. J. Howard and A. R. Ravishankara, Measurement Of OH And HO2 Radical Uptake Coefficients On Water And Sulfuric-Acid Surfaces, J. Phys. Chem., 1992, 96, 4979–4985 CrossRef CAS.
- P. S. Lakey, T. Berkemeier, M. Krapf, J. Dommen, S. S. Steimer, L. K. Whalley, T. Ingham, M. T. Baeza-Romero, U. Pöschl and M. Shiraiwa, The effect of viscosity and diffusion on the HO2 uptake by sucrose and secondary organic aerosol particles, Atmos. Chem. Phys., 2016, 16, 13035–13047 CrossRef CAS.
- D. E. Heard and M. J. Pilling, Measurement of OH and HO2 in the troposphere, Chem. Rev., 2003, 103, 5163–5198 CrossRef CAS PubMed.
- R. L. Brown, Tubular Flow Reactors With 1st-Order Kinetics, J. Res. Natl. Bur. Stand., 1978, 83, 1–8 CrossRef CAS PubMed.
- N. A. Fuchs and A. G. Sutugin, Properties of highly dispersed aerosols, Ann Arbor Science Publishers, Ann Arbor, MI, 1970 Search PubMed.
- A. S. Wexler and S. L. Clegg, Atmospheric aerosol models for systems including the ions H+, NH4+, Na+, SO42−, NO3−, Cl−, Br−, and H2O, J. Geophys. Res.: Atmos., 2002, 107, ACH 14-11–ACH 14-14 CrossRef.
- S. L. Clegg, K. S. Pitzer and P. Brimblecombe, Thermodynamics of multicomponent, miscible, ionic solutions. Mixtures including unsymmetrical electrolytes, J. Phys. Chem., 1992, 96, 9470–9479 CrossRef CAS.
- S. L. Clegg, P. Brimblecombe and A. S. Wexler, Thermodynamic model of the system H+− NH4+− SO42-− NO3-− H2O at tropospheric temperatures, J. Phys. Chem. A, 1998, 102, 2137–2154 CrossRef CAS.
- M. Shiraiwa, C. Pfrang and U. Pöschl, Kinetic multi-layer model of aerosol surface and bulk chemistry (KM-SUB): the influence of interfacial transport and bulk diffusion on the oxidation of oleic acid by ozone, Atmos. Chem. Phys., 2010, 10, 3673–3691 CrossRef CAS.
- U. Pöschl, Y. Rudich and M. Ammann, Kinetic model framework for aerosol and cloud surface chemistry and gas-particle interactions - Part 1: General equations, parameters, and terminology, Atmos. Chem. Phys., 2007, 7, 5989–6023 CrossRef.
- J. Mao, S. Fan, D. J. Jacob and K. R. Travis, Radical loss in the atmosphere from Cu-Fe redox coupling in aerosols, Atmos. Chem. Phys., 2013, 13, 509–519 CrossRef.
- L. Deguillaume, M. Leriche, K. Desboeufs, G. Mailhot, C. George and N. Chaumerliac, Transition metals in atmospheric liquid phases: Sources, reactivity, and sensitive parameters, Chem. Rev., 2005, 105, 3388–3431 CrossRef CAS PubMed.
- A. N. Pham, G. Xing, C. J. Miller and T. D. Waite, Fenton-like copper redox chemistry revisited: Hydrogen peroxide and superoxide mediation of copper-catalyzed oxidant production, J. Catal., 2013, 301, 54–64 CrossRef CAS.
- J. D. Rush and B. H. Bielski, Pulse radiolytic studies of the reaction of perhydroxyl/superoxide O2-with iron (II)/iron (III) ions. The reactivity of HO2/O2-with ferric ions and its implication on the occurrence of the Haber-Weiss reaction, J. Phys. Chem., 1985, 89, 5062–5066 CrossRef CAS.
- S. P. Sander, R. R. Friedl, D. M. Golden, M. J. Kurylo, R. E. Huie, V. L. Orkin, G. K. Moortgat, A. R. Ravishankara, C. E. Kolb, M. J. Molina and B. J. Finlayson-Pitts, Chemical Kinetics and Photochemical Data for Use in Atmospheric Studies, JPL Publication, 2003, vol. 14 Search PubMed.
- T. A. Staffelbach and G. L. Kok, Henry law constants for aqueous solutions of hydrogen peroxide and hydroxymethyl hydroperoxide, J. Geophys. Res.: Atmos., 1993, 98, 12713–12717 CrossRef.
- J. Casas, F. Alvarez and L. Cifuentes, Aqueous speciation of sulfuric acid–cupric sulfate solutions, Chem. Eng. Sci., 2000, 55, 6223–6234 CrossRef CAS.
- P. T. Griffiths and R. A. Cox, Temperature dependence of heterogeneous uptake of N2O5 by ammonium sulfate aerosol, Atmos. Sci. Lett., 2009, 10, 159–163 CrossRef.
- R. G. Remorov, Y. M. Gershenzon, L. T. Molina and M. J. Molina, Kinetics and mechanism of HO2 uptake on solid NaCl, J. Phys. Chem. A, 2002, 106, 4558–4565 CrossRef CAS.
- E. Loukhovitskaya, Y. Bedjanian, I. Morozov and G. Le Bras, Laboratory study of the interaction of HO2 radicals with the NaCl, NaBr, MgCl2 . 6H2O and sea salt surfaces, Phys. Chem. Chem. Phys., 2009, 11, 7896–7905 RSC.
- G. M. Nathanson, P. Davidovits, D. R. Worsnop and C. E. Kolb, Dynamics and kinetics at the gas-liquid interface, J. Phys. Chem., 1996, 100, 13007–13020 CrossRef CAS.
- D. A. Knopf, M. Ammann, T. Berkemeier, U. Pöschl and M. Shiraiwa, Desorption Lifetimes and Activation Energies Influencing Gas-Surface Interactions and Multiphase Chemical Kinetics, EGUsphere, 2023, vol. 2023, pp. 1–140 Search PubMed.
- P. S. J. Lakey, T. Berkemeier, H. Tong, A. M. Arangio, K. Lucas, U. Pöschl and M. Shiraiwa, Chemical exposure-response relationship between air pollutants and reactive oxygen species in the human respiratory tract, Sci. Rep., 2016, 6, 32916 CrossRef CAS PubMed.
- Y. Gao, S. Yu, R. M. Sherrell, S. Fan, K. Bu and J. R. Anderson, Particle-size distributions and solubility of aerosol iron over the Antarctic peninsula during austral summer, J. Geophys. Res.: Atmos., 2020, 125, e2019JD032082 CrossRef.
- M. R. Goforth and C. S. Christoforou, Particle size distribution and atmospheric metals measurements in a rural area in the South Eastern USA, Sci. Total Environ., 2006, 356, 217–227 CrossRef CAS PubMed.
- L. Liu, W. Li, Q. Lin, Y. Wang, J. Zhang, Y. Zhu, Q. Yuan, S. Zhou, D. Zhang and C. Baldo, Size-dependent aerosol iron solubility in an urban atmosphere, npj Clim. Atmos. Sci., 2022, 5, 53 CrossRef CAS.
- E. Bjergbakke, K. Sehested and O. L. Rasmussen, The reaction mechanism and rate constants in the radiolysis of solutions, Radiat. Res., 1976, 66, 433–442 CrossRef CAS.
- D. Stone and D. M. Rowley, Kinetics of the gas phase HO2 self-reaction: Effects of temperature, pressure, water and methanol vapours, Phys. Chem. Chem. Phys., 2005, 7, 2156–2163 RSC.
- X. Xu and W. A. Goddard, Peroxone chemistry: formation of H2O3 and ring-(HO2)(HO3) from O3/H2O2, Proc. Natl. Acad. Sci. U. S. A., 2002, 99, 15308–15312 CrossRef CAS PubMed.
- H. Song, K. Lu, H. Dong, Z. Tan, S. Chen, L. Zeng and Y. Zhang, Reduced aerosol uptake of hydroperoxyl radical may increase the sensitivity of ozone production to volatile organic compounds, Environ. Sci. Technol. Lett., 2021, 9, 22–29 CrossRef.
- M. Jingqiu and F. Songmiao, Soluble Fe in Aerosols Sustained by Gaseous HO2 Uptake, 2017 Search PubMed.
- A. Khaled, M. Zhang and B. Ervens, The number fraction of iron-containing particles affects OH, HO2 and H2O2 budgets in the atmospheric aqueous phase, Atmos. Chem. Phys., 2022, 22, 1989–2009 CrossRef CAS.
| This journal is © The Royal Society of Chemistry 2024 |