 Open Access Article
Creative Commons Attribution 3.0 Unported Licence
Toxicological evaluation of SVOCs in exhaust emissions from light-duty vehicles using different fuel alternatives under sub-freezing conditions†
Mo
Yang
 *a,
Päivi
Aakko-Saksa
b,
Henri
Hakkarainen
 a,
Topi
Rönkkö
c,
Päivi
Koponen
b,
Xiao-Wen
Zeng
d,
Guang-Hui
Dong
d and
Pasi I.
Jalava
a
aInhalation Toxicology Laboratory, Department of Environmental and Biological Science, University of Eastern Finland, Yliopistonranta 1, P. O. Box 1627, FI-70211 Kuopio, Finland. E-mail: moyang@uef.fi
bVTT Technical Research Centre of Finland, VTT, P. O. Box 1000, 02044 Espoo, Finland
cTampere University, Aerosol Physics Laboratory, Finland
dGuangdong Provincial Engineering Technology Research Center of Environmental Pollution and Health Risk Assessment, Department of Occupational and Environmental Health, School of Public Health, Sun Yat-sen University, Guangzhou 510080, China
First published on 10th October 2024
Abstract
Semivolatile organic compounds (SVOCs) in exhaust gas, though not directly regulated by emission standards, play a crucial role in assessing both conventional and alternative fuels. Our aim is to compare the differences in and toxicological effects of SVOC exhaust emissions from conventional and alternative fuels under sub-freezing conditions. High levels of NOx, CO2 and PAHs in SVOCs were observed in DI-E2 (EN590 winter-grade diesel), with E10 (gasoline with 10% ethanol) exhibiting higher CO2 and PAH levels compared to E85 (high-blend ethanol with an 83/17% ethanol–gasoline ratio). SVOCs from DI-E6 (EN590 diesel) demonstrated significant cytotoxicity, while E10 resulted in higher inflammatory mediators and genotoxicity. Our findings show that SVOC composition and toxicity in exhaust gas differ based on the fuel type. Despite new emissions regulations reducing diesel vehicle emissions, SVOC toxicity remains unchanged. Toxicity from SVOCs in compressed natural gas and ethanol/gasoline vehicles is notable, with gasoline exhaust showing high inflammatory and genotoxic potential.
Environmental significanceDue to the difficulty in collecting and detecting semivolatile organic compounds (SVOCs), they are not directly regulated by traffic emission standards. However, their presence in exhaust gas is crucial for evaluating both conventional and alternative fuels. We measured various exhaust concentrations of SVOCs emitted by newly regulated passenger vehicles using different fuels under low-temperature conditions, along with the cytotoxicity of SVOCs. We found that under the new emission standards, the toxicity of SVOCs emitted from both conventional and clean fuels cannot be ignored. |
1. Introduction
Over the past few decades, the European Union (EU) has implemented a series of road emission standards aimed at controlling the release of carbon dioxide (CO2), nitrogen dioxide (NO2), and other gases, along with particulate matter (PM), from vehicles in traffic.1 Various new technologies have reformed engines, fuels and exhaust aftertreatment to meet the emission standards. Diesel engines compliant with the 2007 standards, featuring exhaust gas recirculation (EGR), diesel oxidation catalysts, and diesel particulate filters (DPFs), have achieved a significant reduction of 90% in PM, as well as over 90% in volatile organic compounds (VOCs) and semivolatile organic compounds (SVOCs) compared to older engine models.2 The 2010 engine, fitted with urea selective catalytic reduction, achieved a reduction of over 90% in nitrogen oxides (NOx) compared to the 2007 engine.2 However, these stringent emission standards, new internal combustion engine technologies, and advancements in fuel and exhaust aftertreatment have not effectively improved air quality.3,4 This lack of improvement can be attributed to factors such as an aging fleet,5 an increase in the overall number of vehicles, and a transition from diesel to gasoline-powered vehicles. With the worsening environmental pollution and the depletion of natural resources, it is imperative to explore and use effective alternative fuels for diesel and gasoline. At present, there is insufficient research on the impact of alternative fuels, for example, ethanol and natural gas, on vehicle emissions, air pollution, and human health.SVOCs are compounds that are volatile enough to exist as vapors in engine exhaust but can condense under atmospheric conditions. They are largely adsorbed on the surfaces of indoor materials6 and airborne particles.7 Both diesel and engine lubricating oil are primary components of diesel engine exhaust, with engine lubricating oil being a complex mixture of SVOCs.8 The oxidation of SVOC vapors, including engine lubricating oil and n-pentacosane, results in the significant formation of secondary organic aerosols.8–11 Despite the classification of SVOCs as indoor organic pollutants by the World Health Organization (WHO)6 and their exclusion from direct regulation by traffic emission standards,9 their presence in exhaust gas, alongside VOCs and PM, is essential for evaluating the harmful effects of conventional and alternative fuel combustion in engines.
Current studies indicate that compressed natural gas (CNG) fueled vehicles equipped with a three-way catalyst have extremely low levels of particle counts.12 Furthermore, CNG-fueled vehicles demonstrate reduced levels of carcinogenic polycyclic aromatic hydrocarbons (PAHs) in PM when compared to gasoline or diesel vehicles.13 Limited research has been conducted on the generation of SVOCs from alternative fuels. Additionally, higher ethanol blends in gasoline have been found to decrease PM emissions in exhaust gas, with lower toxicological effects observed in PM-bound PAHs.14,15 This phenomenon has also been noticed at sub-freezing ambient temperatures.16,17 Therefore, besides differences in fuel, the running and start-up conditions also affect emissions, particularly at low temperatures, which are associated with higher emissions from passenger cars.18,19 However, although some studies have been conducted on this subject,5,16 the impact of low temperature on emission toxicity remains insufficiently explored.
Therefore, we collected SVOCs from the exhaust of one Euro 2 and four Euro 6 emission-regulated cars at −7 °C. The Euro 2 diesel-powered car (DI-E2) used EN590 winter-grade diesel fuel, while the four Euro 6 cars included DI-E6 using regular EN590 diesel, CNG (compressed natural gas), E10 using gasoline with 10% ethanol, and E85 using high-blend ethanol fuel with an 83/17% ethanol–gasoline-ratio. We exposed RAW264.7 mouse macrophages to the collected SVOCs and evaluated their toxicological effects. DI-E2 and DI-E6 are two types of diesel vehicles that meet different EU standards, and they use different types of diesel fuel. E10 and E85 are ethanol-gasoline blends, with E10 being more commonly used in Finland. E85 and CNG are considered clean energy options and are also available in other European countries. Our aim is to compare the differences in and toxicological effects of SVOC exhaust emissions from conventional and alternative fuels under sub-freezing conditions.
2. Materials and methods
All the sampling methods and details concerning SVOCs are described in the Technical Research Center of Finland (VTT) report of Aakko-Saksa et al.2 The following sections briefly describe some of the important factors.2.1 Cars and fuels
SVOCs were collected from the exhaust of one older Euro 2-regulated diesel car and four new Euro 6 emissions-regulated cars by VTT. SVOCs were collected from the diluted exhaust gas after PM filters. The Euro 2 diesel-powered car (DI-E2) used EN590 winter-grade diesel fuel, while the Euro 6 diesel car (DI-E6) used regular EN590 diesel. Compressed natural gas (CNG), gasoline with 10% ethanol (E10), and high-blend ethanol fuel with an 83/17% ethanol–gasoline-ratio (E85) were used in other Euro 6 cars. Detailed information on the Euro 6 and 2 diesel cars' engines and fuels is presented in the report2 and our previous article.52.2 SVOC sampling and extraction
A standard PM sampling system was used for SVOC sampling. The collection and analysis of SVOCs were conducted using Empore SDB-XC disks (diameter 47 mm). SVOC Empore disks were positioned as back-up filters for SVOC sampling in a standard PM sampler, which used primary filters TX-40. The sample flow rate was 17.5 L min−1, and the Empore disks were then subjected to analyses for PAHs and oxidative potential (dithiothreitol, DTT, HSCH2(CH(OH))2CH2SH). Additionally, some SVOCs were collected into Tenax TA-Carbopack B tubes for chemical analyses. Tenax tubes were positioned after the high-capacity PM filters (fluorophore) in the PM sampling system, utilizing a side stream of diluted exhaust gas. A sample flow of approximately 0.1 L min−1 was drawn through Tenax TA-Carbopack B tubes using a separate pump throughout the entire driving cycle. One background Tenax-tube was collected, and ten SVOC samples were collected with Tenax-tubes. Three parallel tubes were collected for DI-E2, two for E85 and E10 and only one for CNG and DI-E6. Detailed sampling flow data and methods are provided in the report.2 After the sampling filters were washed with high-performance liquid chromatography (HPLC)-gradient grade methanol. SVOC samples were obtained through rotary evaporation and nitrogen blowing. SVOC samples were then stored at −20 °C.2.3 Chemical characterization
Nitrogen oxides were analyzed by chemiluminescence (CLD). NOx emissions refer to the sum of exhaust NO and NO2, calculated as NO2. CO and CO2 were analyzed using the non-dispersive infrared principle. Total hydrocarbon (HC) emissions were measured using a flame ionization detector. Detection limits are provided in ESI Table A2.†Twenty-four individual PAHs in SVOCs were analyzed from the fluorophore filters and Empore disks using the ISO 16000-6:2011 and EN 14662-4:2005 analysis methods. The disks were extracted with toluene using an ultrasonic bath and then analyzed. It was noticed that following toluene extraction of the Empore disks, the solution became cloudy (milky), and a sediment settled at the vial's bottom prior to analysis. This indicated potential partial degradation of the Empore disks during toluene extraction using an ultrasonic bath. However, the sediment didn't interfere with the PAH analyses. The detection limits ranged from 10 to 30 ng (1 μg m−3) per compound, and the measurement uncertainty was 30%.
The dithiothreitol (HSCH2(CH(OH))2CH2SH, DTT) assay was employed to evaluate the oxidative potential of SVOCs. The DTT assays were conducted at Biosafe Biological Safety Solutions Ltd according to the procedure outlined by Charrier & Anastasio,20 with the modification of using 200 μM DTT in Chelex treated 0.10 M phosphate buffer (77.8 mM NaH2PO4 and 22.2 mM KHPO4). OD 412 nm measurements were conducted at five, ten, fifteen, and twenty minutes. The DTT assay was performed under soft natural light conditions. Chelex-treated 0.1 M phosphate buffer served as the negative control, while 9,10-phenanthrenequinone (30 μM) was used as the positive control. The value of the negative sample control (methanol) was subtracted from the sample results. The analysis was conducted with three replicates. The positive control resulted in a DTT loss 3.5 times higher than that of the sample with the highest oxidative potential. DTT loss in phosphate buffer did not exceed the detection limit. DTT assay analysis began with DI-E2 samples, which were submitted for DTT analysis on a mass basis (SVOC mg per sample), concurrently with testing the reference Empore filter (SVOC). DTT samples of E10, E85, CNG, and DI-E6 were analyzed based on volume (m3 exhaust gas per sample).
2.4 Cell culture and exposure experiments
The RAW264.7 mouse macrophage cell line was obtained from the American Type Culture Collection (ATCC). RAW264.7 mouse macrophages were cultured in RPMI 1640 cell culture medium (Life Technologies), supplemented with 10% heat-inactivated fetal bovine serum (Sigma, USA), 1% penicillin-streptomycin, and 1% L-glutamine (Life Technologies, USA) in a 5% CO2 atmosphere at 37 °C. The day before the exposure experiment, the cell suspension was diluted to 2 × 10⁵ cells per mL and 5 × 10⁴ cells per mL and then cultured on 12-well plates and 96-well plates (Costar, Corning, NY, USA) for 24 hours, respectively. On the day of the exposure experiment, the medium was replaced with a fresh medium and the cells were allowed to stabilize for one hour.The SVOC samples were dispersed in pyrogen-free water (Sigma W1503, USA) and dimethyl sulfoxide (DMSO) (final concentration of 0.3% v/v in the cell culture medium, with a dose of 150 mg mL−1) and then sonicated for 30 min. The concentration of SVOC samples before exposure was 1000 L mL−1. RAW264.7 cells were treated with the pyrogen free water control, the DMSO control, the blank membrane control, and three doses of each SVOC sample for 24 hours. For E10 and CNG, the doses were 0.005, 0.01, and 0.025 L mL−1, while for E85, DI-E2 and DI-E6, the doses were 0.001, 0.005, and 0.01 L mL−1. All experiments were conducted in triplicate with a minimum of three replicates.
After 24 hours of SVOC exposure, all the cell culture medium was collected and stored at −80 °C. We recovered cells adhering to the bottom of each well using a cell scratcher with 600 μL of cold phosphate buffered saline (PBS). All the cell tubes were then centrifuged at 8000 rpm for 5 min at 4 °C, the supernatant was removed, and the cells were resuspended with 500 μL of cold PBS. The collected cells underwent toxicological analysis. For the detection of cell membrane integrity and intracellular oxidative potential, 200 μL of cell suspension was used. For cell cycle detection, 180 μL of cell suspension was used. For the detection of genotoxicity (comet assay), 120 μL of cell suspension was used. The cell culture medium was employed for the detection of inflammatory mediators: TNF-α and MIP-2.
2.5 Toxicological analyses
Next, the electrophoresis was set for 20 min at 24V/300 mA. Following that, we transferred all the microscope slides to a clean plate and rinsed them three times with neutralization buffer. DNA was fixed on the microscope slides using 99% ethanol for 10 min. After removing ethanol, all the microscope slides were dried overnight at room temperature and stored under dry, dark conditions. Seventy-five μL of diluted ethidium bromide dye was pipetted onto the microscope slides, covered with a glass plate, and left for 30 min to allow for DNA binding. The nuclei in ethidium bromide (100 cells per dose) were analyzed using a special image analysis system (Comet assay IV, Perceptive Instruments Ltd, Suffolk, UK). Tail intensity was used as the parameter in the statistical analysis.
2.6 Statistical analysis
The comparison of the results for all cell experiments in different groups was conducted using one-way analysis of variance (ANOVA), followed by the least squares difference (LSD) method to compare paired differences between the groups. A p-value < 0.05 was considered to be statistically significant.3. Results
3.1 SVOC emissions and chemical composition
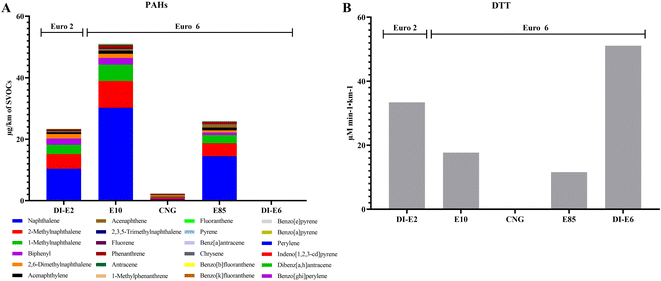
The averages of SVOC exhaust and NOx emissions, as well as concentrations of SVOC-bound organic and inorganic constituents from exhaust gases of one Euro 2 and four Euro 6 engines, are shown in Table 1. DI-E2 exhibited the highest NOx and CO2 emissions, while E10 showed the least. E85 showed the highest CO exhaust and HC emissions, and CNG had the highest methane (CH4) emissions, followed by E85. The total amount of SVOC-bound organic constituents, particularly PAHs, was the largest in E10, with DI-E6 having the least. The proportion of carcinogenic PAHs in total PAHs followed this order: E10 (59.22%), E85 (54.69%), DI-E2 (44.59%), DI-E6 (25.00%), and CNG (21.40%). SVOCs from DI-E2 produced more NOx, CO, CO2, total HCs, and PAHs than DI-E6, while SVOCs from E85 emitted higher NOx, CO, total HCs, and CH4 than E10. SVOCs from CNG emitted the least CO and CO2. The mass concentration of SVOC-bound PAHs in diluted exhaust gas and oxidative potential of SVOCs are shown in Fig. 1. SVOC-bound PAHs in E10, E85 and DI-E2 were relatively high, with naphthalene being the most concentrated PAH. The oxidative potential of SVOCs followed this order: DI-E6 > DI-E2 > E10 > E85 > CNG.| DI-E2 (Euro 2) | E10 (Euro 6) | CNG (Euro 6) | E85 (Euro 6) | DI-E6 (Euro 6) | |
|---|---|---|---|---|---|
| Nitrogen oxides NOx (mg km−1) | 928.3 | 19.2 | 151.2 | 36.4 | 333.1 |
| Carbon monoxide, CO (mg km−1) | 472.1 | 463.9 | 42.1 | 2433.3 | 79.5 |
| Carbon dioxide, CO2 (g km−1) | 241.0 | 176.4 | 129.1 | 158.6 | 187.7 |
| Total hydrocarbons, HCs (mg km−1) | 2.48 | 5.28 | 7.46 | 12.59 | 0.95 |
| Methane, CH4 (mg km−1) | 3.8 | 7.5 | 95.9 | 55.8 | 9.2 |
| Organic constituents in SVOCs: Polyaromatic hydrocarbons, PAHs | |||||
| Sum of total PAHs (μg km−1) | 23.37 | 51.03 | 2.29 | 25.89 | 0.04 |
| Sum of total carcinogenic PAHs (μg km−1) | 10.42 | 30.22 | 0.49 | 14.46 | 0.01 |
3.2 CMA
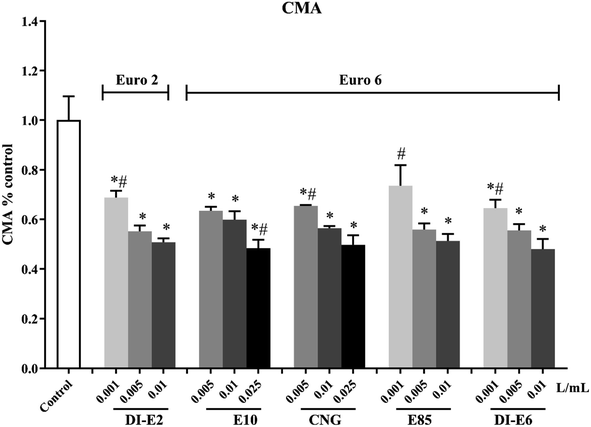
The decrease in CMA compared to control cells after RAW264.7 macrophages were exposed to exhaust gas volume-based doses of SVOC samples is shown in Fig. 2. Exposure to SVOCs decreased all the levels of CMA. The 0.01 L mL−1 group of E85, DI-E2 and DI-E6 caused a similar level of CMA decline as the 0.025 L mL−1 group of E10 and CNG.3.3 Intracellular oxidative potential and cell membrane integrity
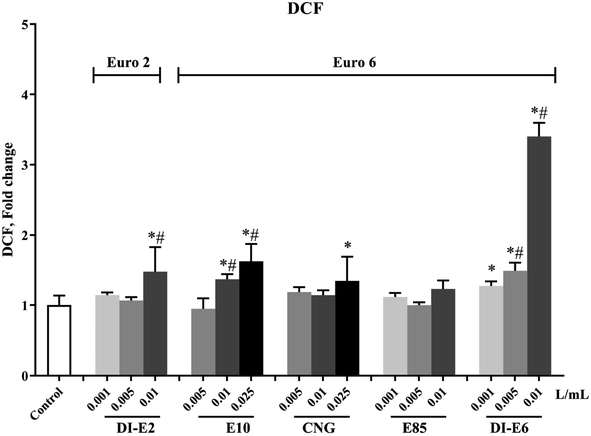
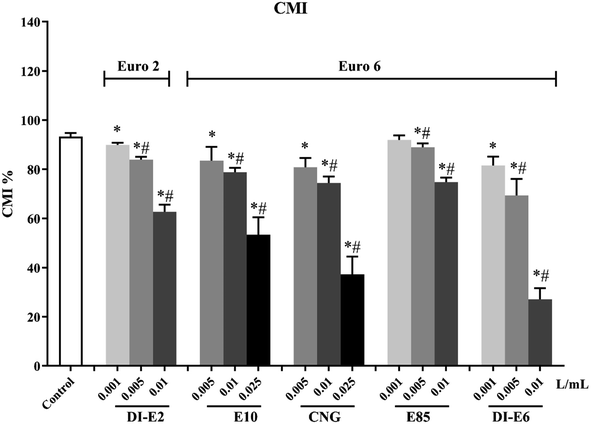
The intracellular oxidative potential of RAW264.7 macrophages after exposure to exhaust gas volume-based doses of SVOC samples is shown in Fig. 3. Exposure to E10 and DI-E6 samples induced a dose-dependent increase in intracellular oxidative potential, especially in the 0.01 L mL−1 group of DI-E6, where the level of intracellular oxidation potential was more than three times that of the control group.The cell membrane integrity and vitality decrease of RAW264.7 macrophages after exposure to exhaust gas volume-based doses of SVOC samples are shown in Fig. 4. Almost all SVOC exposure affected cell membrane integrity. The highest dose, the 0.01 L mL−1 group of DI-E6, resulted in less than 30% membrane integrity, while the 0.025 0.01 L mL−1 group of CNG caused less than 40% membrane integrity.
3.4 Inflammatory mediators
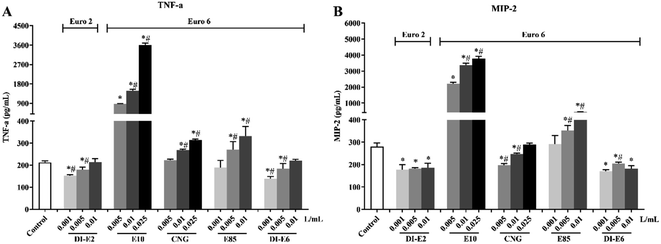
The production of TNF-α and MIP-2 in RAW264.7 macrophages after exposure to exhaust gas volume-based doses of SVOC samples is shown in Fig. 5. Exposure to E10, CNG and E85 exhaust caused increases in TNF-α production, especially in E10, while decreases in TNF-α levels were observed with DI-E2 and DI-E6 exposure. E10 and E85 exhaust exposure caused increases in MIP-2 levels, especially E10, whereas CNG, DI-E2, and DI-E6 exposure resulted in reductions in MIP-2 levels.3.5 Cell cycle
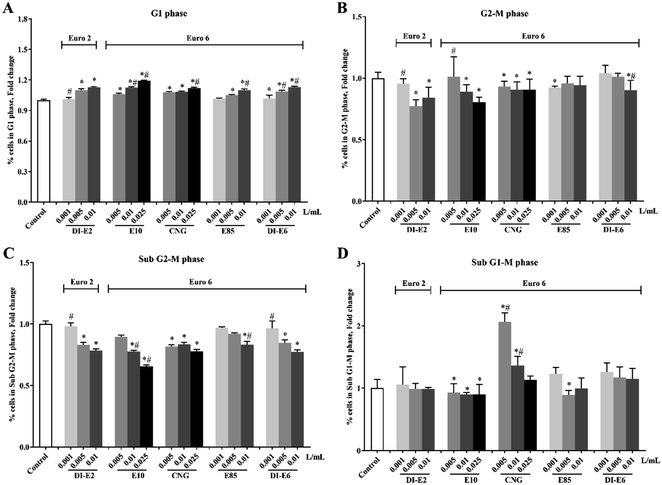
Cells with DNA damage, as measured by flow cytometric cell cycle phase analysis on RAW264.7 macrophages after exposure to exhaust gas volume-based doses of SVOC samples, are shown in Fig. 6. Exposure to all the SVOCs resulted in an increased amount of DNA in the G1 phase and decreased DNA in the sub G2-M phase. Notably, the low-dose 0.005 and 0.01 L mL−1 groups of CNG exhaust caused significant increases in the sub G1-M phase, and the 0.005 L mL−1 group exhibited a higher level than the 0.01 L mL−1 group, with no significant difference observed between the 0.025 L mL−1 group and the control group.3.6 Genotoxicity
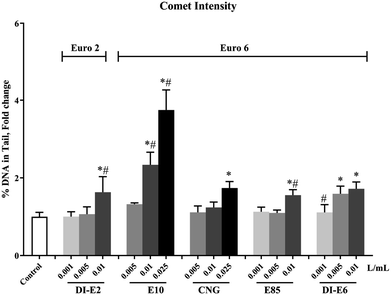
Genotoxicity in RAW264.7 macrophages after exposure to exhaust gas volume-based doses of SVOC samples is shown in Fig. 7. Notably, the 0.01 and 0.025 L mL−1 groups in E10, 0.025 L mL−1 group in CNG, 0.01 L mL−1 group in E85 and DI-E2, and 0.005 and 0.01 L mL−1 groups in DI-E6 induced significant increases in DNA tail intensity, with E10 exhibiting the most pronounced effect. The increases in DNA tail intensity caused by CNG, E85, DI-E2 and DI-E6 samples were less than twice that of the control group.4. Discussion
SVOCs are typically present as vapors in engine exhaust and can readily attach to PM. The exhaust gas, composition and toxicological effects in PM from one Euro 2 regulated car and four Euro 6 emission regulated cars were also evaluated in previous study.5 With the exception of Euro 2 car DI-E2 and Euro 6 car DI-E6, the PAHs in SVOCs produced by E10, CNG, and E85 are much higher than those in PM. Furthermore, similar to the findings of this study, the total amount of PAHs in PM produced by DI-E2, E10 and E85 was also relatively high.5 PAHs are produced when insufficient oxygen or other factors cause incomplete combustion of organic matter, as observed in engines.2 Diesel cars are known for emitting PAHs; however, it is noteworthy that gasoline cars may also emit high concentrations of PAHs, particularly at low temperatures.21 Euro 2 diesel fuel car DI-E2 lacked any exhaust gas aftertreatment system, which may explain the high PAH concentrations in PM and SVOCs emitted by DI-E2. Temperature might play a crucial role in PAH emissions from gasoline fueled cars E10 and E85. Diesel-fueled cars emit significant amounts of PM, especially ultrafine particles, which strongly adsorb PAHs. Although gasoline-fueled cars emit nearly the same amount of PM as diesel-fueled cars,22–24 vehicles using gasoline with high ethanol content have lower emissions.15 The reduction in PM emissions led to a decrease in the number of PM-bound PAHs, resulting in an increase in PAHs in SVOCs. Additionally, the content of PAHs in PM5 and SVOCs emitted by DI-E6 using diesel fuel was very low. This reduction may be attributed to the DPF and EGR systems equipped in the Euro 6 diesel car DI-E6, which effectively decreased both PM and PAH emissions in the exhaust gas.DTT is commonly used to assess particle oxidative potential outside cell environments.25 We found that despite the Euro 6 diesel vehicle DI-E6 being equipped with DPF and EGR systems, SVOCs emitted by it exhibited the highest oxidative potential compared to those emitted by all other vehicles. In contrast to the findings for PM, DI-E2 emitted PM with the highest oxidative potential, whereas DI-E6 emitted PM with the lowest oxidative potential.5 In PM, the trends in DTT, PM mass and number concentration, and PAHs emitted by each vehicle were found to be similar.5 The cleaning system equipped with DI-E6 reduced PM emissions and may further reduce the oxidative potential of PM emitted by DI-E6. However, in the SVOCs from the five vehicles in this study, the change in DTT was not consistent with any SVOC exhaust gas. The only similarity observed in this study was that SVOCs emitted by DI-E6 also caused a significant increase in intracellular oxidative potential, but SVOCs from other vehicles did not induce a similar change in intracellular oxidative potential. Previous studies have found that SVOCs might exert a dominant effect on the DTT response of these particle types after heating diesel or ultrafine particles in the environment.26 However, we found that among SVOCs, PM and PM + SVOCs, the DTT in PM + SVOC was the highest (ESI Fig. A1†); especially the DTT in PM + SVOCs of the DI-E2 car was significantly higher than that of SVOCs and PM (4–6 times). Some studies have found that DTT loss is associated with components such as metals and PAHs in PM, although many of these correlations were not causal.20,27 There were almost no metals in SVOCs, and the content of PAHs in DI-E6 was very low in this study. The high DTT of SVOCs from the DI-E6 car may be attributed to the limited presence of substances that oxidize DTT. Currently, we lack conclusive proof or a clear explanation for the variation in the oxidative potential of SVOCs emitted by different vehicles, necessitating further exploration.
In this study, although the amount of exhaust gas in the SVOCs emitted by DI-E2 was high, it did not cause strong cellular toxicological effects. In contrast, the oxidative and cell membrane damage induced by SVOCs emitted by DI-E6 were more serious. This may be related to the high DTT of DI-E6. PM emitted by DI-E2, characterized by high DTT, also led to a more significant expression of intracellular oxidative potential.5 The new emissions regulations for the Euro 6 passenger diesel car DI-E6 have efficiently reduced SVOC exhaust NOx, CO, CO2, HC, and PAH emissions. However, despite these reductions, oxidative potential and cytotoxicity remain in low-emission SVOCs in this study. Moreover, the NOx levels in SVOCs emitted by DI-E6 were still significantly higher than those of other Euro 6 vehicles. The harmful effects of NOx on humans have been confirmed by many studies.28 Therefore, diesel vehicles subject to new emissions regulations still require additional methods to further improve their exhaust emissions.
E10 and E85 were both gasoline-fueled vehicles with ethanol in this study. The cytotoxicity caused by SVOCs emitted by E10 and E85 was similar, but E10 stimulated cells to secrete higher levels of inflammatory mediators and exhibited more severe genotoxicity. This difference is related to the PAH content in their SVOCs. Naphthalene is the predominant PAH in ambient air.29 The exposure of naphthalene in rodents has been shown to cause nasal tract inflammation and nasal epithelium tumors.30–32 In this study, SVOCs from E10 had the highest levels of PAHs, particularly naphthalene, and induced the production of more inflammatory mediators. Previous research has also indicated that exposure to PM rich in PAH content results in elevated levels of inflammatory mediators.5 Several PAHs, including benzo(a)pyrene, with their metabolites being highly carcinogenic and mutagenic.2 Therefore, exposure to SVOCs from E10 also caused the most significant genotoxicity in this study. This observation aligns with the results of Hakkarainen et al.,5 who reported a consistent trend between the mutagenicity in PM and the PAHs. Despite some exhaust gas components in the SVOCs emitted by E85 being higher than those of E10, the level of cell damage caused by SVOC exposure in E85 was still lower than that in E10 in this study. Therefore, the use of alternative fuels with high ethanol/gasoline ratios may potentially mitigate the adverse effects of vehicle exhaust on human health.
CNG is generated by compressing conventional natural gas, primarily composed of CH4, to less than 1% of its original volume under standard atmospheric pressure.33 In CNG engines, most of the HC emissions are attributed to CH4.34 This occurs due to incomplete combustion and the inefficiency of the oxidation catalyst in effectively removing CH4.34 Therefore, in this study, the levels of CH4 and HC in the SVOC exhaust gas from CNG engines were high. Currently, CNG is considered one of the best solutions to replace fossil fuels because of its inherent clean burning properties.35,36 Research has found that, compared with diesel engines, CNG engines emit nearly 50 times fewer carcinogenic PAHs, 20 times less formaldehyde, and more than 30 times less PM and experience significant reductions in NOx, with genetic toxic activity reduced by up to 20–30 times.37 While reducing HC emissions is essential, CNG vehicles exhibit significant advantages in exhaust emissions reduction compared to diesel and gasoline technologies.5,34 However, the environmental and climate impacts of high HC emissions from CNG engines may outweigh the benefits gained in terms of human health.
Previous studies have indicated that the toxicity of CNG exhaust gas, concerning reactive oxygen species, inflammatory biomarkerd (CYP1A1, IL8, and COX-2), and mutagenicity is very low.38 Additionally, PM from CNG has been found to not cause cytotoxic effects and mutagenicity.5,13 However, in our study, SVOCs from CNG not only reduced cellular mitochondrial activity and damaged cell membrane integrity but also stimulated cells to secrete TNF-α, interfered with DNA replication in Sub-G1-M, and caused cellular genotoxicity.
Similarly, Seagrave et al.39 found that, although the lung toxicity of CNG emission samples was lower than that of gasoline and diesel samples, its mutagenic potency was similar to that of gasoline and diesel emission samples. While most current studies on the toxicity of CNG engine emissions report negative or low toxicity results, the low emissions of CNG engines do not completely eliminate the toxicity of the organic compounds they emit. This is because, in addition to fuel combustion itself, engine lubricating oil is a significant source of SVOCs,8 and CNG engines cannot control the evaporation of engine lubricating oil, leading to the generation of SVOCs. Therefore, the toxicity of organic compounds emitted by CNG engines cannot be ignored.
5. Conclusions
Our study fills the gap in the chemical and toxicological characterization of SVOC emissions from passenger vehicles using different fuels under sub-freezing conditions. While new technology has successfully reduced the emissions of diesel vehicles, the toxicity of SVOCs emitted by them remains unchanged. The toxicity of SVOCs from CNG and ethanol/gasoline blended vehicles cannot be ignored.Data availability
The data are not publicly available, but are available from the corresponding author upon reasonable request.Author contributions
Mo Yang: conceptualization, methodology, validation, formal analysis, investigation, writing-original draft, writing-review and editing, resources, data curation, supervision. Päivi Aakko-Saksa: methodology, validation, formal analysis, data curation. Henri Hakkarainen: methodology, writing-review and editing. Topi Rönkkö: methodology, validation, formal analysis, data curation. Päivi Koponen: methodology, validation, formal analysis, data curation. Xiao-Wen Zeng: writing-review and editing. Guang-Hui Dong: writing-review and editing. Pasi Jalava: conceptualization, methodology, validation, writing-original draft, writing-review and editing, funding acquisition, resources, supervision.Conflicts of interest
The authors declare no conflict of interest.Acknowledgements
The authors thank Piritta Roslund for her technical assistance. This work was supported by the European Union’s Horizon 2020 research and innovation programme under grant agreement No. 814978 (TUBE) and Academy of Finland, grants: 287982, 294081 and 319245.References
- ACEA. The Automobile Industry Pocket Guide 2016–2017. 2016 Search PubMed.
- P. Aakko-Saksa, P. Roslund and P. Koponen, Development and validation of comprehensive emission measurement methods for alternative Fuels at VTT, VTT Technol., 2017, 102 Search PubMed.
- N. Gendron-Carrier, M. Gonzalez-Navarro, S. Polloni and M. A. Turner, Subways and urban air pollution, Am. Econ. J. Appl. Econ., 2022, 14(1), 164–196 CrossRef.
- S. S. Ravi, S. Osipov and J. W. Turner, Impact of Modern Vehicular Technologies and Emission Regulations on Improving Global Air Quality, Atmosphere, 2023, 14(7), 1164 CrossRef CAS.
- H. Hakkarainen, P. Aakko-Saksa, M. Sainio, T. Ihantola, T. J. Rönkkö and P. Koponen, et al., Toxicological evaluation of exhaust emissions from light-duty vehicles using different fuel alternatives in sub-freezing conditions, Part. Fibre Toxicol., 2020, 17(1), 1–17 CrossRef PubMed.
- L. Lucattini, G. Poma, A. Covaci, J. de Boer, M. H. Lamoree and P. E. Leonards, A review of semi-volatile organic compounds (SVOCs) in the indoor environment: occurrence in consumer products, indoor air and dust, Chemosphere, 2018, 201, 466–482 CrossRef CAS.
- C. J. Weschler and W. W. Nazaroff, Semivolatile organic compounds in indoor environments, Atmos. Environ., 2008, 42(40), 9018–9040 CrossRef CAS.
- M. A. Miracolo, A. A. Presto, A. T. Lambe, C. J. Hennigan, N. M. Donahue and J. H. Kroll, et al., Photo-oxidation of low-volatility organics found in motor vehicle emissions: Production and chemical evolution of organic aerosol mass, Environ. Sci. Technol., 2010, 44(5), 1638–1643 CrossRef CAS PubMed.
- D. R. Gentner, S. H. Jathar, T. D. Gordon, R. Bahreini, D. A. Day and H. I. El, et al., Review of urban secondary organic aerosol formation from gasoline and diesel motor vehicle emissions, Environ. Sci. Technol., 2017, 51(3), 1074–1093 CrossRef CAS PubMed.
- A. L. Robinson, N. M. Donahue, M. K. Shrivastava, E. A. Weitkamp, A. M. Sage and A. P. Grieshop, et al., Rethinking organic aerosols: Semivolatile emissions and photochemical aging, Science, 2007, 315(5816), 1259–1262 CrossRef CAS PubMed.
- J. De Gouw, A. Middlebrook, C. Warneke, R. Ahmadov, E. L. Atlas and R. Bahreini, et al., Organic aerosol formation downwind from the Deepwater Horizon oil spill, Science, 2011, 331(6022), 1295–1299 CrossRef CAS PubMed.
- Aakko P. and Nylund N.-O., Particle emissions at moderate and cold temperatures using different fuels. SAE Powertrain & Fluid Systems Conference & Exhibition; 2002 Search PubMed.
- A. K. Agarwal, B. Ateeq, T. Gupta, A. P. Singh, S. K. Pandey and N. Sharma, et al., Toxicity and mutagenicity of exhaust from compressed natural gas: Could this be a clean solution for megacities with mixed-traffic conditions?, Environ. Pollut., 2018, 239, 499–511 CrossRef CAS PubMed.
- M. Munoz, N. V. Heeb, R. Haag, P. Honegger, K. Zeyer and J. Mohn, et al., Bioethanol blending reduces nanoparticle, PAH, and alkyl-and nitro-PAH emissions and the genotoxic potential of exhaust from a gasoline direct injection flex-fuel vehicle, Environ. Sci. Technol., 2016, 50(21), 11853–11861 CrossRef CAS PubMed.
- J. Yang, P. Roth, T. D. Durbin, K. C. Johnson, A. Asa-Awuku and I. D. R. Cocker, et al., Investigation of the effect of mid-and high-level ethanol blends on the particulate and the mobile source air toxic emissions from a gasoline direct injection flex fuel vehicle, Energy Fuels, 2018, 33(1), 429–440 CrossRef.
- PiT. Aakko-Saksa, L. Rantanen-Kolehmainen and E. Skyttä, Ethanol, isobutanol, and biohydrocarbons as gasoline components in relation to gaseous emissions and particulate matter, Environ. Sci. Technol., 2014, 48(17), 10489–10496 CrossRef CAS.
- H. Timonen, P. Karjalainen, E. Saukko, S. Saarikoski, P. Aakko-Saksa and P. Simonen, et al., Influence of fuel ethanol content on primary emissions and secondary aerosol formation potential for a modern flex-fuel gasoline vehicle, Atmos. Chem. Phys., 2017, 17(8), 5311–5329 CrossRef CAS.
- R. Suarez-Bertoa and C. Astorga, Impact of cold temperature on Euro 6 passenger car emissions, Environ. Pollut., 2018, 234, 318–329 CrossRef CAS PubMed.
- C. Weber, I. Sundvor and E. Figenbaum, Comparison of regulated emission factors of Euro 6 LDV in Nordic temperatures and cold start conditions: Diesel-and gasoline direct-injection, Atmos. Environ., 2019, 206, 208–217 CrossRef CAS.
- J. G. Charrier and C. Anastasio, On dithiothreitol (DTT) as a measure of oxidative potential for ambient particles: evidence for the importance of soluble transition metals, Atmos. Chem. Phys., 2012, 12(5), 11317 CAS.
- P. Aakko-Saksa, T. Murtonen, P. Roslund, P. Koponen, J. Nuottimäki, P. Karjalainen, et al., Research on Unregulated Pollutants Emissions of Vehicles Fuelled with Alcohol Alternative Fuels: VTT's contribution to the IEA-AMF Annex 44, 2014 Search PubMed.
- A. Liati, D. Schreiber, Y. A. R. Dasilva and P. D. Eggenschwiler, Ultrafine particle emissions from modern Gasoline and Diesel vehicles: An electron microscopic perspective, Environ. Pollut., 2018, 239, 661–669 CrossRef CAS PubMed.
- S. M. Platt, I. El Haddad, S. Pieber, A. Zardini, R. Suarez-Bertoa and M. Clairotte, et al., Gasoline cars produce more carbonaceous particulate matter than modern filter-equipped diesel cars, Sci. Rep., 2017, 7(1), 1–9 CrossRef CAS PubMed.
- Y. Wu, S. Zhang, J. Hao, H. Liu, X. Wu and J. Hu, et al., On-road vehicle emissions and their control in China: A review and outlook, Sci. Total Environ., 2017, 574, 332–349 CrossRef CAS PubMed.
- R. D. McWhinney, S. S. Gao, S. Zhou and J. P. Abbatt, Evaluation of the effects of ozone oxidation on redox-cycling activity of two-stroke engine exhaust particles, Environ. Sci. Technol., 2011, 45(6), 2131–2136 CrossRef CAS PubMed.
- V. Verma, P. Pakbin, K. L. Cheung, A. K. Cho, J. J. Schauer and M. M. Shafer, et al., Physicochemical and oxidative characteristics of semi-volatile components of quasi-ultrafine particles in an urban atmosphere, Atmos. Environ., 2011, 45(4), 1025–1033 CrossRef CAS.
- S. Hu, A. Polidori, M. Arhami, M. Shafer, J. Schauer and A. Cho, et al., Redox activity and chemical speciation of size fractioned PM in the communities of the Los Angeles-Long Beach harbor, Atmos. Chem. Phys., 2008, 8(21), 6439–6451 CrossRef CAS.
- B. A. M. Bandowe and H. Meusel, Nitrated polycyclic aromatic hydrocarbons (nitro-PAHs) in the environment–a review, Sci. Total Environ., 2017, 581, 237–257 CrossRef PubMed.
- G. Huang, Y. Liu, M. Shao, Y. Li, Q. Chen and Y. Zheng, et al., Potentially Important Contribution of Gas-Phase Oxidation of Naphthalene and Methylnaphthalene to Secondary Organic Aerosol during Haze Events in Beijing, Environ. Sci. Technol., 2019, 53(3), 1235–1244 CrossRef CAS PubMed.
- C. Schreiner, Genetic toxicity of naphthalene: a review, J. Toxicol. Environ. Health, Part B, 2003, 6(2), 161–183 CAS.
- K. Abdo, S. Eustis, M. McDonald, M. Jokinen, B. Adkins and J. Haseman, Naphthalene: a respiratory tract toxicant and carcinogen for mice, Inhalation Toxicol., 1992, 4(4), 393–409 CrossRef CAS.
- H. Clewell, A. Efremenko, J. Campbell, D. Dodd and R. Thomas, Transcriptional responses in the rat nasal epithelium following subchronic inhalation of naphthalene vapor, Toxicol. Appl. Pharmacol., 2014, 280(1), 78–85 CrossRef CAS.
- M. I. Khan, T. Yasmin and A. Shakoor, Technical overview of compressed natural gas (CNG) as a transportation fuel, Renewable Sustainable Energy Rev., 2015, 51, 785–797 CrossRef CAS.
- A. Thiruvengadam, M. Besch, V. Padmanaban, S. Pradhan and B. Demirgok, Natural gas vehicles in heavy-duty transportation-A review, Energy Policy, 2018, 122, 253–259 CrossRef CAS.
- M. Aslam, H. Masjuki, M. Kalam, H. Abdesselam, T. Mahlia and M. Amalina, An experimental investigation of CNG as an alternative fuel for a retrofitted gasoline vehicle, Fuel, 2006, 85(5–6), 717–724 CrossRef CAS.
- A.-H. Kakaee and A. Paykani, Research and development of natural-gas fueled engines in Iran, Renewable Sustainable Energy Rev., 2013, 26, 805–821 CrossRef CAS.
- L. Turrio-Baldassarri, C. L. Battistelli, L. Conti, R. Crebelli, B. De Berardis and A. L. Iamiceli, et al., Evaluation of emission toxicity of urban bus engines: Compressed natural gas and comparison with liquid fuels, Sci. Total Environ., 2006, 355(1), 64–77 CrossRef CAS PubMed.
- Y. Li, J. Xue, J. Peppers, N. Y. Kado, C. F. A. Vogel and C. P. Alaimo, et al., Chemical and Toxicological Properties of Emissions from a Light-Duty Compressed Natural Gas Vehicle Fueled with Renewable Natural Gas, Environ. Sci. Technol., 2021, 55(5), 2820–2830 CrossRef CAS PubMed.
- J. Seagrave, A. Gigliotti, J. D. McDonald, S. K. Seilkop, K. A. Whitney and B. Zielinska, et al., Composition, toxicity, and mutagenicity of particulate and semivolatile emissions from heavy-duty compressed natural gas-powered vehicles, Toxicol. Sci., 2005, 87(1), 232–241 CrossRef CAS PubMed.
Footnote |
| † Electronic supplementary information (ESI) available. See DOI: https://doi.org/10.1039/d4ea00062e |
| This journal is © The Royal Society of Chemistry 2024 |

