 Open Access Article
Creative Commons Attribution 3.0 Unported Licence
A framework for describing and classifying methane reporting requirements, emission sources, and monitoring methods†
Andy
Connor
 *,
Jacob T.
Shaw
 ,
Nigel
Yarrow
,
Neil
Howes
,
Jon
Helmore
,
Andrew
Finlayson
,
Patrick
Barker
and
Rod
Robinson
,
Nigel
Yarrow
,
Neil
Howes
,
Jon
Helmore
,
Andrew
Finlayson
,
Patrick
Barker
and
Rod
Robinson
National Physical Laboratory, Teddington, TW11 0LW, UK. E-mail: andy.connor@npl.co.uk
First published on 24th October 2024
Abstract
Industries, governments, and regulators need trustworthy emissions data to enable them to make informed decisions regarding methane abatement strategy and policies. There are many differing data reporting metrics, as well as a diverse range of both emission sources and methods for monitoring emissions. Different data structures and terminologies can be used to describe similar objects, activities, or characteristics associated with methane monitoring. There is no currently accepted definition of what constitutes a methane monitoring method. Since there is no common basis to describe this information, confusion concerning language, definitions, and terminology can arise which can undermine confidence in data. This paper describes a framework, based on a set of taxonomies and a common lexicon, which aims to address these issues by providing a common structure in which data requirements, emission sources and monitoring methods can be described. The principles of metrology and quality assurance are embedded into this framework along with a means to define the temporal and spatial scales of the reporting and monitoring. It is envisaged that this framework will be developed into a standard to help facilitate more reliable transfer of information between stakeholders internationally. Usage examples for this framework include: to aid the development of test standards (between test laboratories, site operators, and standards bodies); to help ensure the most cost-effective monitoring methods are deployed for a specific purpose; to help identify technological and methodological gaps between what monitoring is needed and what is available, or to help drive more focused innovation in this field.
Environmental significanceThe Intergovernmental Panel on Climate Change (IPCC) estimates that the global warming potential (GWP) of methane is 81.2 times that of carbon dioxide over a 20 year time horizon, and 27.9 times greater over a 100 year time horizon. As the atmospheric lifetime of methane is much shorter than that for carbon dioxide, targeting reductions in methane emissions may be a viable, but urgent, strategy for successful short-term climate change mitigation. Detection and quantification of methane emissions is a crucial part of implementing mitigating strategies to reduce emissions. A standard methane framework for describing and classifying data reporting requirements, emission sources, and monitoring methods based on the principles of metrology will help underpin confidence in reported data. |
1 Introduction
The atmospheric methane burden has gained much attention in recent years, most notably with the signing of the Global Methane Pledge in 2021.1 Efforts to reduce emissions of methane from anthropogenic emission sources, and thereby stall climate impacts, are potentially feasible and cost effective to implement.2 However, implementing measures to mitigate methane emissions requires data that can be trusted and are truly representative of the emissions being monitored. Historically, the reporting of methane emissions has relied on the use of generalised emission factors. However, a lack of comprehensive measurement data and incomplete monitoring means that emission factors can vary widely leading to large discrepancies in national inventories.3 This has led to a clear need to measure methane emissions for reporting emissions.Mitigation of climate risk is not the only driver for monitoring methane emissions. There are also safety considerations and economic benefits to minimising leaks, as methane is both a valuable commodity and can form explosive air mixtures. Trust in emissions data, underpinned by metrological infrastructure and quality assurance practices, is essential to making informed decisions regarding methane reduction practices.
Methane emissions may need to be measured and reported over different spatial scales (from emissions on individual components to regionally aggregated emissions from multiple distinct sources) and temporal scales (from short-lived emission events to continuous emissions) to ensure that the measured data is representative of the emissions source. The reconciliation of datasets across these wide-ranging spatial and temporal scales can be especially challenging4 and hence explicit understanding of the characteristics of different emission sources realistically requires the deployment of a wide range of complementary monitoring techniques. There are many differing requirements for reporting emissions and associated quality metrics, as well as a diverse range of emission sources (and associated environments) and methods for measuring emissions. The following guidance documents have been developed to help navigate the methane monitoring landscape. It is evident from these documents that different terminology is used to describe similar objects, activities, and characteristics. It is therefore unsurprising that confusion concerning language, definitions, and terminology is commonplace:
• GTI Energy has defined a set of protocols5 that describe how to take measurements, process data, and apply an assurance process to all segments of the natural gas supply chain.
• The Energy Institute of Colorado State University has published ‘Advancing Development of Emissions Detection’6 which focuses on technology testing.
• The Oil and Gas Methane Partnership (OGMP2.0)7 has developed a case for a ‘gold standard’ in methane reporting.
• A glossary of terminology in the 2019 refinement to the 2006 IPCC Guidelines for National Greenhouse Gas Inventories.8
• The Methane Guiding Principles partnership has published a number of best practice guides including identification, measurement, and quantification.9
A specific example of terminology is the use of different terms to describe a single object, or a collection of physical objects, in the gas industry that emits methane. GTI Energy used the term ‘Asset’,5 whereas the Energy Institute used the terms ‘Component’, ‘Equipment Unit’, ‘Equipment Group’ or ‘Facility’ – depending on whether one is referring to individual or groups of objects.6 OGMP2.O used ‘Asset’, ‘Operating unit’, ‘Site’, ‘Facility’, or ‘Source’.7 Terms used to describe objects in the IPCC glossary (which is not gas industry focused) include: ‘Pond’, ‘Manure’, or ‘Peatland’, or more generically, ‘Source’.8
The terms ‘Emissions’, ‘Emission rate’ or ‘Emissions flux’ are used to describe the amount of methane emanating from a source or area. Confusion can arise because the terms ‘Emission flux’, ‘Emissions rate’ and ‘Emissions’ are often used interchangeably. ‘Emissions rate’ should be used to describe the amount of methane over a given period of time, in units of mass per time, whereas ‘Emissions flux’ should be used to describe the emission rate through a known surface area, in units of mass per time per square area. The word ‘emissions’ by itself should be avoided when describing a quantity, but elaborate the measurand being referred to, examples are ‘emissions rate’, ‘emissions flux’ or a ‘cumulative emissions total’.
Another source of confusing terminology is often found in the use of various metrological terms including, for example: uncertainty, accuracy, error, repeatability, reproducibility, and precision. These terms are defined in the Joint Committee for Guides, International Vocabulary of Metrology (VIM)10 but are often misused due to their colloquial use in the English language. For example, the usage of uncertainty can be confused with accuracy, the former is a quantitative expression of doubt in a measurement, whereas accuracy is a qualitative statement that expresses the closeness of a measurement to the true value. Usage of the correct terminology, guidance on how to apply metrological principles (for example uncertainty calculations) and expressing the quality of data (for example uncertainty) are important aspects that need to be addressed.
There appears to be no standard definition of what a monitoring method is or should consist of amongst stakeholders engaged in the monitoring of methane. For example, unmanned aerial vehicles may colloquially be referred to as ‘methods’ for monitoring emissions when they are, in the absence of anything else, simply platforms from which measurements can be taken. Some instruments that measure methane concentration may also be referred to as ‘methods’ but cannot individually provide information on emissions unless combined with a sampling strategy and emission quantification model. The Methane Guiding Principles best practice guide9 used the term ‘Method’ to describe a technology or group of technologies used for detection, measurement, or quantification, but methods should ideally also describe the process and quality control and assurance aspects of monitoring methane. All these different definitions can, at best, lead to confusion and, at worst, the deployment of platforms or instruments that do not have the essential elements of a method, for example: a defined protocol, or evidence of validation and quality assurance processes. The Joint Committee for Guides, International Vocabulary of Metrology (VIM)10 defines a measurement method as ‘a generic description of a logical organization of operations used in a measurement’. To help ensure that decisions are based on trustworthy data it is important to have an accepted definition and list of what constitutes a method. This framework attempts to address this for emission monitoring by defining a method and what constitutes a method.
It would also be of great value to have a common lexicon that is industrially and geographically neutral and potentially cross references the existing terms currently in use. In addition, there needs to be a common structure for how information describes how data reporting, emissions sources, or methods is represented. This paper attempts to address the issues and create a common framework that describes how information should be structured. It would be logical to group terms that represent objects, activities, and characteristics into classifications that have similar properties and hence a taxonomy approach was adopted.
There have been previous attempts at developing taxonomies in the field of emissions monitoring, but these have generally focussed solely on monitoring methods and not considered the data requirements or emissions sources. Examples include:
• A review on the capability of satellites for monitoring methane emissions from the oil and gas sector.11
• A taxonomic structure of methane monitoring methods with a focus on spatial scalability.12
• A framework13 specifically for demonstrating equivalence between methane leak detection and repair (LDAR) programs in the context of methane emission mitigation, but not for methane monitoring more widely.
• A review of close-range and screening technologies for mitigating fugitive methane emissions in upstream oil and gas.14
• A review15 and classification of methods for detecting natural gas pipeline leaks, some of which included the direct measurement of methane above-ground.
• Keywords16 associated with methods for measuring methane emissions from oil and gas wells, many of which are captured across the taxonomies presented in the main paper here.
This paper presents the concept of a systematic framework that could be used to describe and categorise data reporting requirements, emissions sources, and monitoring methods as a set of taxonomies that identify and categorise keywords, and a lexicon to define terminology. Throughout all areas of science, reproducibility in results is fundamental to providing confidence in data and metrology is key to producing reproducible results.17 The principles of metrology and quality assurance, as well as scope for representing the wide range of temporal and spatial scales for emissions, are embedded into the framework design. The framework is designed to be industry and technology neutral with an initial focus on methane, but could, in future, be adapted for other pollutant species for which environmental monitoring is vital.
We believe the framework will provide major benefits to the field of methane emissions monitoring by providing:
• A harmonised system (with a lexicon) to help ensure a more reliable transfer of information and knowledge between method providers and stakeholders which would benefit the development of policy and regulations and the standardisation of methodologies. A harmonised system could also lead to more reliable reconciliation and integration of datasets since stakeholders will have consistent terminology and systems for describing information.
• A means for industrial operators, regulators, and other stakeholders to select the most cost-effective monitoring solutions, or suite of complementary solutions, based on understanding the reporting requirements and source characteristics. It is recognised that existing monitoring requirements stipulated by regulators can be intentionally vague to allow for a flexible approach based on technologies that are available and within budget. There is a compromise to be made between performance and cost. The intention of this framework is that it would help a stakeholder navigate that compromise by providing a means to identify technological or methodological gaps that may need to be addressed in the future.
• To help emerging industries or technology providers to navigate the complex methane monitoring landscape, for example stakeholders in the non-oil and gas industries who may want to apply similar practices to their needs.
The purpose of this paper is to highlight the need for this framework and describe its concept.
2 Methods
The design of this taxonomy was carried out in two phases.1. The collation of terms (keywords or phrases) that are used to describe and categorise methane reporting requirements, emissions sources, and monitoring methods and their associated technologies. The terms originated from four decades of work undertaken with a wide range of stakeholders: government departments, academia, standards committees, industry, collaborative research and development, instrument manufacturers, measurement service providers, site operators, technology innovators; and from a UK, European, and international perspective. It is recognised that multiple definitions exist that describe similar objects or properties; an attempt has been made to ensure that those chosen for this framework (or alternatives) are technology and industry neutral.
2. The design of the framework and taxonomy follows these concepts:
• To identify keywords that describe methane emission monitoring, sorted into those that describe reporting requirements (what data is needed), emission sources, and monitoring methods (how data is obtained).
• To sort keywords into ‘properties’ and ‘descriptors’. Properties are used to quantify and categorise information, and descriptors are used where some form of qualitative description is required. For example, the physical height of an emission source can be quantified but may require some form of textual description to provide context, for example: ‘a vent located on top of a large building or flare stack’. Some keywords could be subjective, for example ‘ease of access for a monitoring location’; having the means to identify and categorise objective and subjective phrases is useful.
• To describe a method and all its constituent parts.
• To categorise terms that have similar characteristics and to apply an ‘object-oriented approach’ to describing physical objects and their associated data.
• The principles of metrology must be embedded into this framework to ensure the creation of trustworthy data necessary for informed decision-making. Metrology is embedded into this framework by including relevant keywords such as uncertainty, traceability, and calibration into the taxonomies. All measurement quantities should be expressed using units defined by the International System of Units (SI) where possible, including those non-SI units that are considered acceptable for use within the SI.18 However, we acknowledge that other systems of units may be in use but note that these typically provide a lower degree of traceability.
• The framework has been designed with a focus on anthropogenic sources of methane. Conceivably the framework could be adapted to account for gaseous species that are relevant for clean energy such as hydrogen and carbon dioxide, and also naturally-occurring methane emission sources too.
It should be noted that this work is not intended to review available methane monitoring methods, nor does it provide an intercomparison or even justification of all monitoring options. Detailed descriptions of methods can be found elsewhere although some particularly relevant literature is referenced for convenience.
3 Results and discussion
3.1 Key definitions
The correct usage of terminology is important for developing standards globally. Therefore, a lexicon of key definitions in the field of emissions monitoring is included in the ESI.†The framework defines the following spatial categories used across many of the taxonomies:
• Component: defined as an entity that forms part of a process or system; on an approximate spatial scale of centimetres to metres (for example, a flange that joins two pipes). Component is a widely accepted term for such a scale.
• Functional element: defined as a spatially separate entity that performs a specific purpose or function; on an approximate spatial scale of metres to hundreds-of-metres (for example, slug catcher at a refinery, a process tank, boiler unit, or storage unit). Synonyms widely used include ‘equipment’ or ‘asset’. However, entities at this spatial scale may not necessarily be equipment (often mechanical in nature) or assets (often with implied ownership), they could be livestock or water treatment ponds. ‘Functional element’ is therefore considered here to be a more appropriate term that could be applied universally across all emission source types.
• Site: defined as a spatially separate premises that performs an activity consisting of a number of functions or consists of one (or more) functional elements; on an approximate spatial scale of hundreds-of-metres to a kilometre (for example, a landfill site, tank farm, anaerobic digester plant). In some cases, there may be a cluster of sites that are in close proximity that would cover a scale greater than one kilometre (for example, a refinery). Synonyms widely used include ‘facility’, ‘plant’ or ‘farm’. ‘Site’ was chosen for industry neutrality.
• Regional: defined as a collection of industrial sites, or distinctive areas of transport, urban, or domestic activity; on an approximate spatial scale of one kilometre to hundreds-of-kilometres (for example, a city).
• National: defined as a collection of regions; on an approximate spatial scale of hundreds-of-kilometres and greater (for example, countries, or groups of countries). This scale is associated with national inventory reporting.
• Global: referring to the total integrated system (emissions sources) on this planet.
The framework defines the following temporal categories:
• Snapshot: a single report representing a state at a given time, or two reports separated by a time period or before and after an event (for example, repair). The intention is that the number of reports are limited (most likely two or less).
• Periodic: a periodic report with a defined period (or frequency). The intention is that the number of reports are not necessarily limited (most likely more than two).
• To monitor continuously at a defined sampling rate.
As stated in the introduction, the correct use of terminology and expression of the quality of data are important. Therefore, commonly used (and misused) metrological terms (accuracy, bias, calibration, error, resolution, repeatability, reproducibility, precision, traceability, uncertainty, validation, and verification) are included within the lexicon. For brevity this paper does not provide a full comprehensive list of all metrological terms. Care must be exercised when the term ‘accuracy’ is used to describe objects or events – ‘accuracy’ is a qualitative statement and has therefore not been included in the taxonomies but does appear in the lexicon.
Calibration, repeatability, reproducibility, traceability, validation, and verification are all actions that are listed as descriptive elements within the taxonomies, i.e. actions that require text to describe the relevant conditions, and uncertainty being the measurand at those conditions.
In terms of guidance on how to apply metrological principles, the UK National Physical Laboratory provides a beginners guide to uncertainty which provides guidance on how to correctly calculate uncertainties and reduce uncertainty in measurements.19
3.2 Framework overview
The framework comprises three sets of taxonomies which are used to classify and define various properties and descriptors to provide a thorough but easily understood breakdown of each set (Fig. 1). The taxonomies within each set are described in later sections. The three sets are: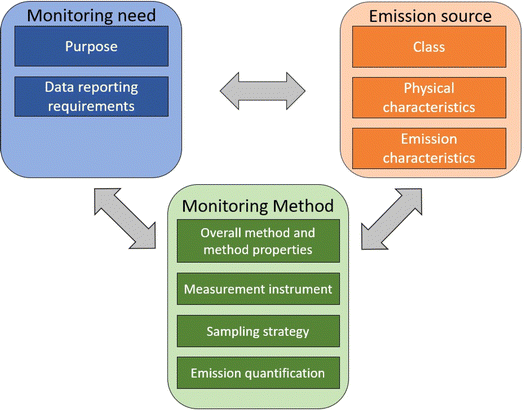 | ||
| Fig. 1 Overview of the methane emission monitoring framework showing three sets of taxonomies: the monitoring need, the emission source, and the monitoring method. | ||
1. Monitoring need: a set of taxonomies which classifies and describes the purpose of the emissions monitoring and what reported data is required.
2. Emission source: a set of taxonomies which classifies and describes the source to be monitored or being monitored (i.e., the different types of emission sources, their properties, and the environments in which they occur).
3. Monitoring method: a set of taxonomies which classifies and describes how the monitoring is to be undertaken.
The three sets of taxonomies could be used independently or in parallel. For example, developing a monitoring standard may require using just the monitoring need and emission source sets without explicitly defining what method should be used. Whereas all three sets could be applied together to select an appropriate monitoring method to meet a particular need and suitable for a particular source. The arrows shown in Fig. 1 illustrate the potential for multi direction and iterative flow of information between the sets. For example, choosing a monitoring method will require information regarding the data reporting requirements and emissions source, but the reporting requirements may have to be revised based on the availability of methods within a defined budget.
A case study demonstrating application of the framework to the quantification of methane emissions from liquefied natural gas (LNG) is presented in the ESI.† The case study provides an example of how to define the purpose and data reporting requirements using the monitoring needs set of taxonomies and examples of emissions sources are given using the emission source taxonomy to describe them. Part of the case study involved selecting a site for monitoring; an example of how the emissions source taxonomy was used to achieve this is given. The monitoring methods set of taxonomies were used to define a specification for a method that could meet the data reporting requirements and used to describe the properties of a method (NPL's mobile Differential Absorption Lidar) that was deployed to carry out the monitoring work. The difference between the method specification and the property of a method highlights the compromises that may have to made when choosing a method, such as budget, safety, logistical constraints.
It should be noted that the taxonomies within each set are not intended to be exhaustive but serve primarily as a basis for reflecting on the requisite considerations for monitoring of emissions.
3.3 A set of taxonomies that describe the monitoring need
Two taxonomies are presented in this set; a taxonomy which defines and classifies the monitoring purpose and a taxonomy which defines and classifies the data reporting requirements.The monitoring purpose taxonomy (Fig. 2) describes and classifies:
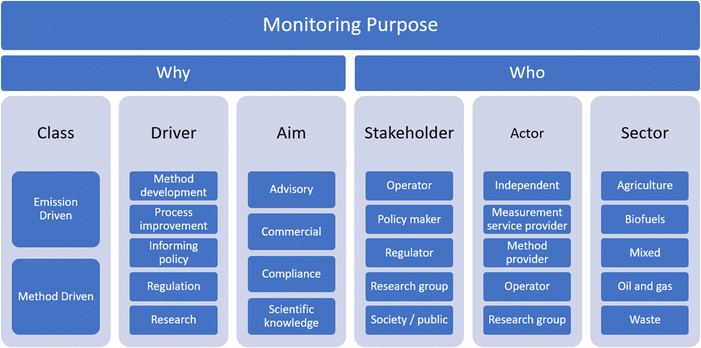 | ||
| Fig. 2 Taxonomy for describing and classifying the purpose of emission monitoring. Keywords are defined in the lexicon in the ESI.† | ||
• Driver: factors that instigate emission monitoring.
• Aim: what is to be achieved by the emissions monitoring.
• Actor: those involved in the monitoring.
• Stakeholder: those who have an interest in the monitoring.
• Sector: the overarching economic sector for which monitoring is required.
We distinguish two classes of monitoring:
1. Emissions driven: the purpose is to measure a property of an emission source through either the methane concentration, emission rate or its source location. Examples are:
• A Leak Detection and Repair (LDAR) programme.
• Exploratory monitoring to gain knowledge about an under-studied emission source, for example, to understand emissions characteristics from a new or change of process on a site.
• To understand the different types of emission sources from an emerging industry such as biogas.
• Obtaining the necessary evidence data for regulatory compliance, for example, of a landfill site(s).
For emissions driven monitoring, the data reporting requirements need to be defined and a method (or complementary set of methods) chosen to undertake the monitoring of the emission source. The choice of method(s) should be based on the data requirements and the known characteristics of the emissions source (i.e. what is required). However, it is recognised that the choice of method may be limited by cost and availability (i.e. what is available). It is envisaged that the framework could be used to perform a technological and methodological gap analysis between what is required and what is available. This could help ensure more informed decisions regarding the choice of monitoring methods and better understanding of the scope and limitations of any measurement campaign. Gap analysis could also be used to drive technological and method development. The data reporting requirements should also point the user to existing protocols relevant to specific industries, such as the GTI Energy Veritas protocols for monitoring emissions from oil and gas sites.5
2. Method driven: the purpose is to develop a monitoring method. For example, the purpose of method-driven monitoring may be to perform method development, with the aim of understanding a method's performance under particular conditions or for a particular application. A different example of method-driven monitoring could be the intercomparison of multiple methods applied to a controlled release experiment simulating a leak on a natural gas pipeline. The focus is on the monitoring method taxonomy; however the emissions taxonomy could be used to help select appropriate emissions source(s) or site(s) to carry out representative field testing of the method. The taxonomy should also point the user to existing guides or protocols.6
The categories shown in Fig. 2 could be further sub-categorised, for example the driver category, ‘research’ could be further sub-categorised as follows:
• Emission factors: develop, improve, validate.
• Understand the source: leakage paths, identify range of emissions, identify non-continuous emitters, measure gas composition, identify source type: diffuse, elevated or point.
In many cases, the aims and drivers are intrinsically related, in that certain drivers imply certain aims. For example, drivers such as regulation, safety, or audit, usually have the aim of complying to a standard or procedure. The aim should, in turn, define the data reporting requirements, which may simply be reporting a site emission rate, or staying below a concentration-threshold. Other drivers, such as research, legislation (to provide advice or information for the development of specific policy legislation), informing policy, or public reassurance, often have the aim of producing advice or yielding scientific knowledge. Similarly, process improvement drivers will typically be for commercial aims. Method-driven drivers are likely to require complex data to provide the necessary information to adequately compare methods and their associated techniques.
Who is affected by, and involved in, emission monitoring is also important when considering the monitoring purpose. This category is subdivided into stakeholders, actors, and sector. Stakeholders are defined as anybody with an active interest or concern in the monitoring conclusions. Actors are defined as those with an active role in undertaking the monitoring. The category sector refers to the overarching industrial or economic sector which is being monitored. Identifying the stakeholders and aims will help determine the complexity of data required; the data complexity is likely to be greater for purposes relating to scientific knowledge compared with purposes relating to compliance. The actors may influence the appropriate method(s) which could be used, or the choice of method(s) may determine the required actor(s), for example, by identifying the required skill set to operate a measurement instrument. Understanding the industry is important since there may be data reporting or logistical requirements specific to certain industries, or different standards, protocols, and terminology that the taxonomy could highlight. Since these categories are related it is important that they are all considered holistically when determining the data reporting requirements.
Fig. 3 illustrates the data reporting requirements taxonomy, which is divided into two separate classes comprising properties (keywords which can be quantified or categorised) and descriptions (keywords which cannot be easily quantified or categorised as they require some description to inform context; for example, the word budget could imply different meanings under different contexts). In Fig. 3, the measurand is typically concerned with the ‘what’, whilst the data granularity defines the ‘where’ (spatial) and the ‘when’ (temporal) aspects of data. Data descriptions typically relate to the type of output required (for example, a dataset, a public report, a new standardised method), or to metadata which may be of relevance to the monitoring method itself.
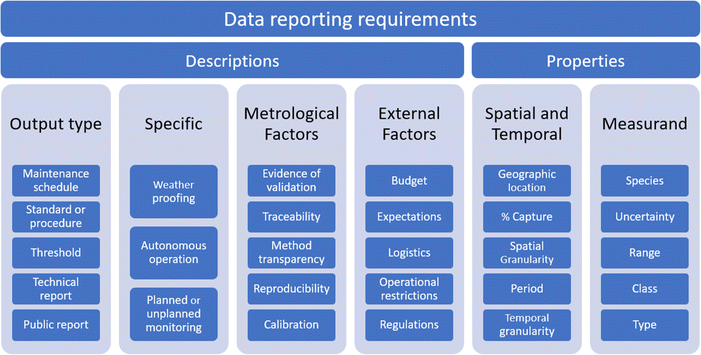 | ||
| Fig. 3 Taxonomy for describing and classifying the data reporting requirements. Many of the data reporting requirement properties could benefit from added description or context (for example, preferred units of measurement). Keywords are defined in the lexicon in the ESI.† | ||
The data reporting requirements for regulatory compliance will likely consist of succinct information about the emission rates and associated uncertainties, the emission sources monitored, and site conditions, whereas method development will require more detailed information, for example: detection limit, bias, minimum quantifiable emissions, repeatability, linearity and response time (potentially more information than that detailed in Fig. 3).
Metrological factors are included in the data reporting requirements taxonomy because it is important that they are considered when determining the reporting requirements and, if appropriate, included in the requirements. Understanding the metrology may be necessary when providing evidence of validation, or when deciding what auditing should be carried out.
The spatial and temporal properties will have quantitative properties associated such as geographic location, time of day, frequency of monitoring etc.
The purposes and data requirements for monitoring, as well as the stakeholders and actors relevant to a particular sector, may change over time. Hence, the taxonomies may need to be regularly reassessed to account for evolving circumstances.
3.4 A taxonomy to describe emissions sources
The emission source taxonomy describes and classifies emission sources based on their characteristics such as spatial scale, emission characteristics, and physical properties (Fig. 4). As with the data reporting requirements taxonomy (Fig. 3), the keywords in the emission source taxonomy are distinguished as properties or descriptors. There are three classes of emissions sources that have been proposed for methane monitoring:20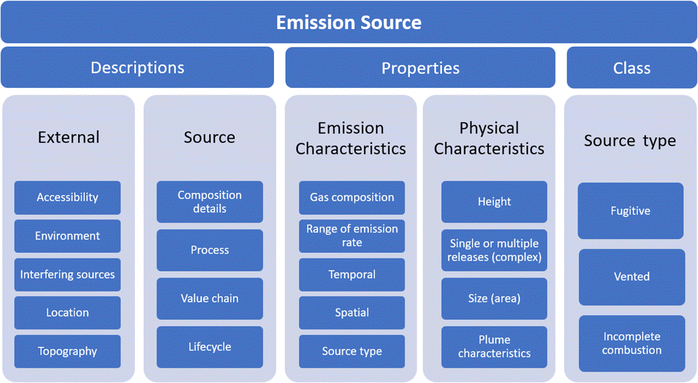 | ||
| Fig. 4 Taxonomy for describing and classifying emission source properties and characteristics. Many of the emission source properties could benefit from additional description or context (for example, preferred units of measurement). Keywords are defined in the lexicon in the ESI.† | ||
1. Fugitive emissions. These are unintentional emissions which may be due to:
• Leaks from components such as pipework or flanges.
• Permeation through seals or casings.
• Emissions from gas sampling operations.
2. Vented emissions. These are emissions from intentional activities such as:
• Venting and purging.
• Start and stop operations.
• Incidents.
3. Emissions due to incomplete combustion. This type of emission may impose additional challenges such as physical challenges (e.g. height of flares, temperature), or the gas composition of the exhaust.
The emission source taxonomy presented here is concerned with describing and characterising anthropogenic or industrial emission sources. The emission source taxonomy also allows for the identification and description of extraneous emission sources which may interfere with monitoring of the target emission source.
Emission source properties are further subdivided into characteristics which can be classified as relating to the emission itself or relating to the physical nature of the source. Physical characteristics include details such as the height of the release point whilst emission characteristics include details such as gas composition and the temporal nature of the emissions (for example, continuous or non-continuous).
3.5 A set of taxonomies for describing monitoring methods
A method is a procedure or a set of instructions for monitoring emissions, which may involve emission detection, localisation and/or quantification. Fig. 5 illustrates a taxonomy that describes and categorises a method's properties. A method should specify the following: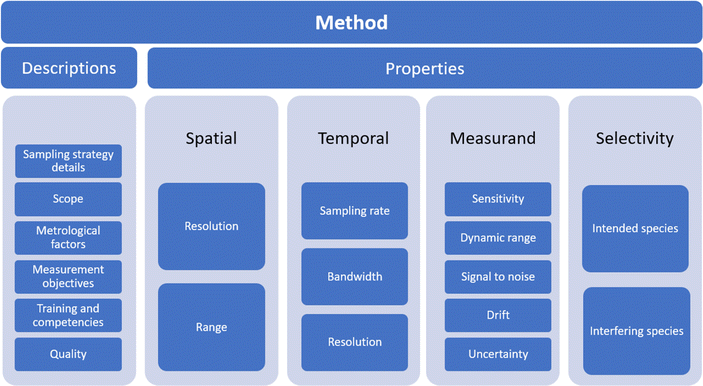 | ||
| Fig. 5 Taxonomy for describing and classifying a method and its properties. Keywords are defined in the lexicon in the ESI.† | ||
•![[thin space (1/6-em)]](https://www.rsc.org/images/entities/char_2009.gif) Scope: a clear definition of the physical magnitude to be measured (for example, gas concentration or leak rates), whether they are direct measurements or estimations (for example, based on models), and if applicable, a means for converting gas concentrations to emission rates.
Scope: a clear definition of the physical magnitude to be measured (for example, gas concentration or leak rates), whether they are direct measurements or estimations (for example, based on models), and if applicable, a means for converting gas concentrations to emission rates.
•![[thin space (1/6-em)]](https://www.rsc.org/images/entities/char_2009.gif) A sampling strategy that describes how the measurement is to be performed and how the data will be collected, assimilated, and reported.
A sampling strategy that describes how the measurement is to be performed and how the data will be collected, assimilated, and reported.
•![[thin space (1/6-em)]](https://www.rsc.org/images/entities/char_2009.gif) Measurement objectives and an agreed and established measurement procedure.
Measurement objectives and an agreed and established measurement procedure.
•![[thin space (1/6-em)]](https://www.rsc.org/images/entities/char_2009.gif) Metrology factors (traceability, calibration, applicable standards, auditing, method transparency) and ways to validate method performance and a quality system to provide confidence in data. A description of the scope and conditions for which the validation (and uncertainty) was performed.
Metrology factors (traceability, calibration, applicable standards, auditing, method transparency) and ways to validate method performance and a quality system to provide confidence in data. A description of the scope and conditions for which the validation (and uncertainty) was performed.
•![[thin space (1/6-em)]](https://www.rsc.org/images/entities/char_2009.gif) Training and competencies that will be required to operate the method (including training for data analysis).
Training and competencies that will be required to operate the method (including training for data analysis).
•![[thin space (1/6-em)]](https://www.rsc.org/images/entities/char_2009.gif) Limitations, dependencies, and assumptions related to the method as a whole, as well as to the measurement instrument, sampling strategy, and emission quantification approach.
Limitations, dependencies, and assumptions related to the method as a whole, as well as to the measurement instrument, sampling strategy, and emission quantification approach.
•![[thin space (1/6-em)]](https://www.rsc.org/images/entities/char_2009.gif) Recommended instruments.
Recommended instruments.
The monitoring method determines the measurement requirements which describe how the measured data is to be obtained, including performance criteria such as measurement uncertainty. This is different from the data reporting requirements (see Fig. 3) which describe what data are required.
A method may be standardised, with prescribed procedures which specify the best available practice, method validation and verification, uncertainty estimation, and application under different circumstances. Alternatively, a method may be under active development, with procedures that are not yet defined due to a lack of knowledge regarding these aspects. It is expected that standardised methods will likely better meet the metrological requirements of monitoring, but it should be acknowledged that not all methods have undergone such rigorous analysis, particularly those that rely on emerging and state-of-the-art measurement and processing techniques.
In Fig. 5, the ‘sampling strategy details’ in the description arm should be used to describe how the data are combined into a final report and how the performance (for example, measurement instrument spatial resolution) determines the uncertainty and granularity of the reported data. The spatial and temporal granularity defines what the method can produce in terms of the reported data.
A method may contain the following three elements:
1. Measurement instrument: a device used for making measurements. A measurement instrument contains a sensor or a detector. The choice of sensor or detector is based on the measurement requirements (which are in turn based on the data reporting requirements – Fig. 3).
2. Sampling strategy: this describes how the measurement data are collected and represented, as well as the platform used to collect the data.
3. Emission quantification: this describes how the methane concentration measurements are converted into a methane emission rate (or emission flux).
Methane monitoring methods must consist of at least a measurement instrument and a sampling strategy but do not necessarily require an emission rate calculation (for example, if only methane concentration needs to be measured for the purpose of emission detection or emission localisation only). Although there are many measurement instruments, sampling strategies, and emission quantification techniques available, the monitoring purpose(s) (Fig. 2) may not be met by any single combination of these method elements alone. A suite of complementary methods, consisting of multiple measurement instruments, sampling strategies, or emissions quantification techniques may therefore be required.
Taxonomies are required to describe the properties of an instrument, sampling strategy or emission quantification. Fig. 6 illustrates a taxonomy which describes and categorises the properties associated with an instrument.
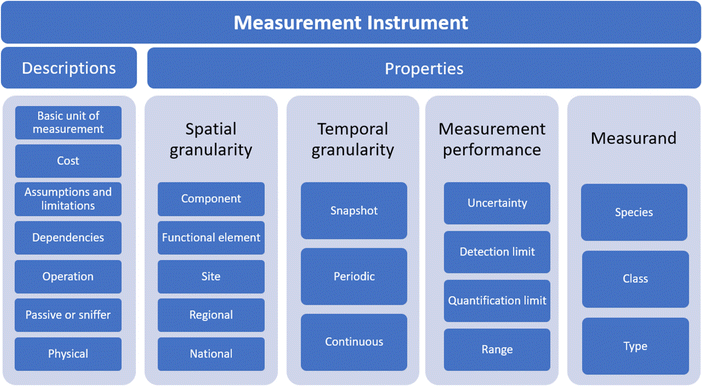 | ||
| Fig. 6 Taxonomy for describing and classifying a method element (in this case, the measurement instrument) and its properties. Keywords are defined in the lexicon in the ESI.† | ||
It is important to identify the source of information for each performance metric. For example, when reviewing the performance specifications for a measurement instrument, is the information obtained from manufacturer supplied data (in which case the specifications may be referring to best case scenarios or have been derived during limited conditions within a stable laboratory environment) or is the information based on testing conducted in an operationally relevant environment? Performance metrics should be verified taking into consideration the scope and conditions in which the instrument is to be used.
The following sections present taxonomies for each of the three method elements introduced above. The taxonomies represent a possible structure which will be of benefit to users assessing the large, and often bewildering, array of techniques available for monitoring methane emissions. The taxonomies are not intended to be exhaustive, and some techniques may be absent. The design of the taxonomies allows for new measurement instruments, sampling strategies (and associated platforms), and emission quantification calculations to be integrated within them. Unfortunately, it is beyond the scope of this work to provide full and complete descriptions for each technique. Detailed descriptions of the underlying principles behind each technique can be found elsewhere.
We have tried to dispense here of the difficult and often problematic and ambiguous referral of methods as either bottom-up or top-down, which is largely dependent on the spatial and temporal scale in question and whether measurements are extrapolated to a greater spatial (or temporal) scale or disaggregated to a lower spatial (or temporal) scale.11,12 For example, the definition of bottom-up could be equally applied to the quantification of component scale emissions (when assessing emissions from a single site) and to site scale emissions (when assessing emissions from a production region), and some methods could be applied equally to bottom-up or top-down measurements. It is important to reconcile independent measurement-derived emission rates at multiple spatial and temporal scales to establish comparability across scales, but this is not always trivial.12
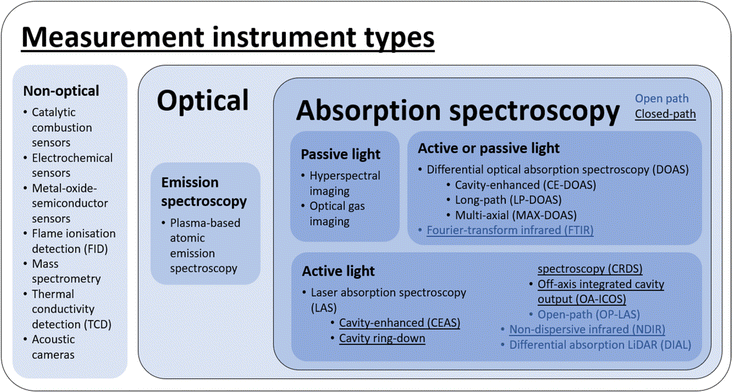 | ||
| Fig. 7 Taxonomy for describing and categorising measurement instruments with example techniques. The techniques listed are not exhaustive. Keywords are defined in the lexicon in the ESI.† Optical absorption spectroscopy instruments which typically make use of open-path light sources are highlighted in blue. Optical absorption spectroscopy instruments which typically make use of closed-path light sources are underlined. | ||
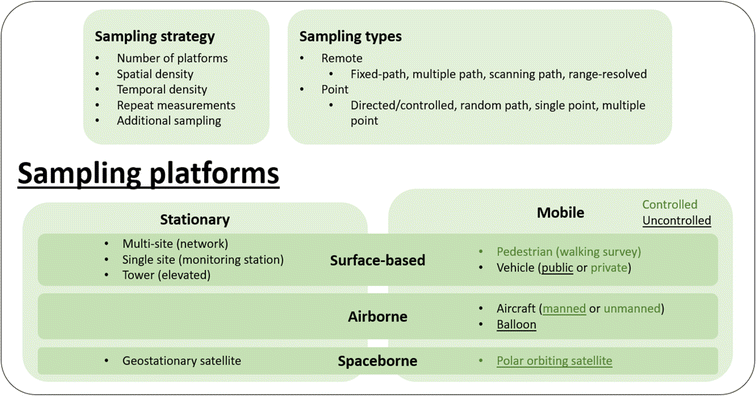 | ||
| Fig. 8 Taxonomy for describing and categorising sampling strategies and sampling platforms. Keywords are defined in the lexicon in the ESI.† | ||
For a particular method the density of sampling may need to provide sufficient information to understand the emissions in terms of its temporal and spatial characteristics. For example, the temporal frequency of sampling should be sufficiently high enough to capture the shortest duration non-continuous emissions, or to capture the frequency of variability in continuous emissions. However, in some cases integrated or average data may be sufficient. The density of spatial sampling will have consequences for characterising the morphology of the emission plume and for distinguishing between multiple emission sources. In practice, achieving high levels of temporal and spatial granularity can be difficult to achieve.
The choice of sampling platform (the platform upon which the measurement instrument is mounted) is part of the sampling strategy. Platforms can either be stationary (their geolocation is fixed) or mobile (their geolocation is variable). Some platforms may be capable of both mobile and stationary sampling, and both types of sampling may be used within the same method; for example, a car could be used to first find an emission plume (mobile sampling) and then sample within that plume by stopping within it (stationary sampling). Each class of sampling platform has different benefits and limitations. Many mobile platforms can conveniently cover large spatial areas (particularly at the site spatial scale) without having to deploy multiple measurement instruments. However, mobile platforms may only capture a ‘snapshot’ in time at each location, whereas stationary platforms can be used to sample for lengthier time periods (or continuously) in a single location. On the other hand, multiple stationary platforms may need to be deployed to obtain the required spatial coverage, and there may be logistical or practical (for example, hazard zones) limitations that restrict their coverage (although this could apply to mobile platforms too).
Sampling platforms can be further divided based on their sampling location within the atmosphere. Platforms can be operated on the ground (i.e., surface-based), above the ground but within the atmosphere (generally considered to be up to ∼100 km in altitude; for example23,24), or can be operated beyond the atmosphere (i.e., spaceborne25,26).
In the case of mobile platforms, their movement offers a further distinguishing feature. Movement can be either controlled (by the method user or actor) or uncontrolled. Controlled platforms can be directly manoeuvred to target sampling in a specific location whereas uncontrolled platforms cannot. Uncontrolled platforms may be subject to movement dictated by the local wind field, as is the case for a sampling balloon. In some cases, differentiating between controlled and uncontrolled may be difficult, and some sampling platforms could conceivably be either, under different circumstances. This may occur when the method user or actor does not have direct control of a platform but the platform can be targeted at specific sources by an external operator, as is the case for some satellites. It is important to try to understand the boundaries between factors that are controlled and uncontrolled. For example, wind and site operational conditions may dictate where a method is deployed and which areas can be monitored.
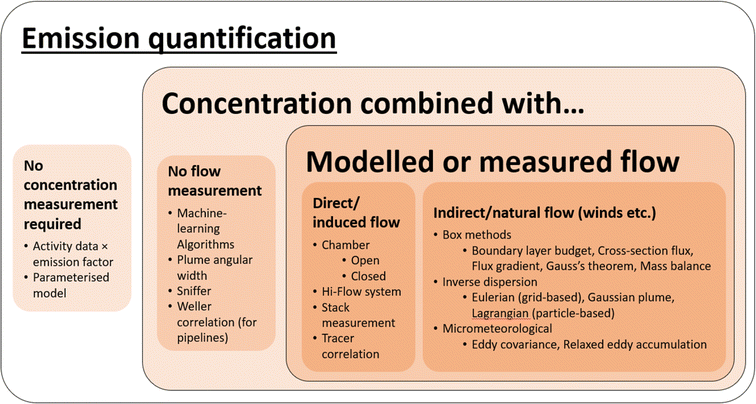 | ||
| Fig. 9 Taxonomy for describing and categorising models for calculating the emission rate. Keywords are defined in the lexicon in the ESI.† | ||
A source of confusion is the use of the terms ‘emissions measurements’ or ‘flux measurements’. As stated previously, ‘emission rate’ is a calculated quantity derived from measurements of concentration combined with other measurements (e.g., wind speed) and/or models. Therefore, the term ‘emissions measurement’ is an oxymoron as it refers to a quantity derived from other measurements and not a quantity that is measured directly. Therefore, currently emissions rates should be referred to as measurement-derived emissions rate.
The ‘no-concentration-measurement’ options are included here for completeness but do not require either of a measurement instrument or sampling strategy. For example, calculating an emission rate from an industrial site can be done using statistical activity data and previously calculated emission factors. Parameterised models use engineering-based calculations to estimate emissions.11 Whilst this approach will estimate an emission rate, the result is reliant on the accuracy of previously calculated emission factors and activity data for the specific site or process. Methane-measurement-based options (all other options in Fig. 9) would be preferable in most cases for specific emission monitoring. It should be noted that emission factors and parameterised calculations can only be assessed for their accuracy (and updated) using a direct methane emissions monitoring method.
Emission rate calculation models can be classified in different ways. Some models make use of a correlation factor between the measured methane concentration and known emission rates derived under controlled conditions. EN15446![[thin space (1/6-em)]](https://www.rsc.org/images/entities/char_2009.gif) 27 describes an approach in which the maximum concentration of methane measured within a certain distance of a leak is correlated to an emission rate using a lookup table. Models that rely on correlation factors are often simple to implement but rely on the accuracy of the derived correlation factors; correlation factors will be less applicable the further the practical conditions differ from the controlled conditions. Machine-learning algorithms have applicability here for the rapid statistical processing of large amounts of data correlating emission observations and known emission rates.28,29 However, many approaches using machine-learning models have yet to be validated and their metrological suitability remains generally unknown, particularly with respect to uncertainty derivation and transparency.
27 describes an approach in which the maximum concentration of methane measured within a certain distance of a leak is correlated to an emission rate using a lookup table. Models that rely on correlation factors are often simple to implement but rely on the accuracy of the derived correlation factors; correlation factors will be less applicable the further the practical conditions differ from the controlled conditions. Machine-learning algorithms have applicability here for the rapid statistical processing of large amounts of data correlating emission observations and known emission rates.28,29 However, many approaches using machine-learning models have yet to be validated and their metrological suitability remains generally unknown, particularly with respect to uncertainty derivation and transparency.
Other emission rate calculation models use a model of atmospheric flow, or transport and dispersion, to derive an emission rate from concentration data. Flow can be measured (or modelled) directly or indirectly. In most cases direct or indirect flow would be measured (for example, using a wind sensor, pressure gauge or 3D anemometer). However, in some cases, the measurement may need to substituted with a wind model. In direct flow approaches, the flow of air is contained and can be controlled using pressure differentials (for example, vacuum pumps). Indirect flow approaches use the wind field as a proxy for flow and assume that the atmospheric transport of methane is driven mainly by the wind and atmospheric turbulence. Box models are typically simpler and may only account for larger scale dispersion driven primarily by the mean wind vector and boundary layer processing. More complex models, such as micrometeorological models and inverse dispersion models, may account for smaller scale and turbulent dispersion but at greater computational cost. Higher resolution meteorological data (measured or modelled) may be needed for the higher fidelity models.
3.6 Maps to illustrate method scope
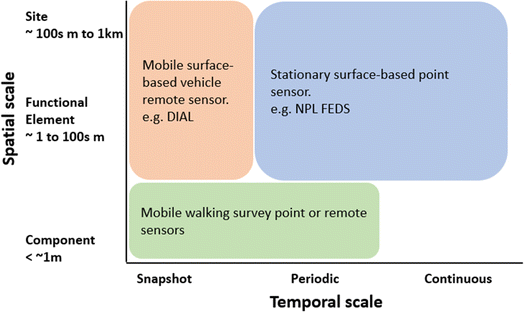
Spatio-temporal maps have been used to illustrate the spatio-temporal range of monitoring methods,9 typically using two orthogonal axes: spatial scale (from component to global) and temporal scale (second to year) where the scale represents the range or resolution of the measurement. Fig. 10 illustrates an example of such a map, showing the temporal categories (as described above) rather than the often-used temporal resolution of the method along the x-axis. The spatial scale is limited from component to site for brevity but can be expanded to include regional to global scale if needed. The temporal category describes the temporal scope of the method, i.e. a method that can only practically provide a snapshot measurement, periodically or monitor continuously. The map includes examples of monitoring methods, platforms, and techniques. There are many conceivable configurations for these types of maps. It could be useful to include the platform and sampling strategy (e.g. point sensor or remote sensor) since such information could indicate the physical accessibility to undertake measurements. Such maps can be useful for understanding the scope of an instrument, technique or indicate technological or methodological gaps in monitoring.4. Conclusions
We present a harmonised framework for describing and classifying data reporting requirements, emission sources, and monitoring methods, including a lexicon of terminology.This paper attempts to address the issues of terminology, the complexity of how data is represented, and the wide range of methods and their associated technologies by defining a set of taxonomies to represent this information. This framework makes a clear distinction between describing reporting requirements (what data is needed) and emissions sources and monitoring methods (how data is obtained). This distinction is necessary to highlight any methodological and technological gaps between what data is needed and what can be obtained using existing methods. Terms (where relevant) have been separated into those that are qualitative (descriptions) and quantitative (properties) which provides the basis for categorising objective and subjective terms. The framework is industry neutral and aimed at stakeholders who may have different levels of experience from an operator in a mature industry (in terms of methane monitoring) to emerging industries and novel technology providers. This framework also defines the essential ingredients of a method; currently there is no such universally accepted description in atmospheric monitoring.
Methane reduction strategies must be based on data that can be trusted and are representative of the source being monitored. These criteria are fundamental to determining whether monitoring is adequate. The principles of metrology and quality assurance are therefore embedded into the framework along with a means to define the temporal and spatial scale of the reporting and monitoring. It is envisaged that categorising and classifying reporting requirements, emission sources, and monitoring methods could be adopted and integrated into existing methane monitoring guidance and standardise general practice to encourage consistency across industries, technologies, and monitored species.
The methane emissions monitoring landscape is complex. For example, data can be described over different spatial and temporal scales, using different types of measurand (e.g. concentration, emissions rate etc.), and there are many ways in which instrumentation can be deployed. A standard and harmonised process for classifying and describing reporting requirements, emissions sources and monitoring methods would not only help to reduce the confusion in terminology between the wide range of stakeholders that are typically involved in emissions monitoring, but also help better articulate this complex landscape to avoid error, confusion, and mis-understanding. It is recommended to collate case studies (perhaps anonymised) to highlight areas where terminology and the complexity of the methane landscape has caused problems – this would help develop standards that are accessible and relevant to stakeholders.
The purpose of this paper has been to highlight the need and concept behind this framework, and not to necessarily define the framework in detail. Indeed, the framework is unlikely to be fully exhaustive and new concepts, technologies, and techniques are intended to be captured and incorporated as they are developed. The next step is to develop this framework into a standard, initially a British Standards Institute Publicly Available Specification, and then eventually into an international standard, that could be used to facilitate more reliable transfer of information (for example, between stakeholders developing standards or monitoring methods, or for the reconciliation of datasets). Further work is required to develop the taxonomies to provide a more comprehensive list of types of emissions sources, methods, and associated technologies. The terms defined in this paper may require revision to ensure compatibility across all industries and geographies. Further work is also needed to cross reference the terms defined within the lexicon here with the wide-ranging terminology that is used throughout the methane monitoring landscape. A committee could be convened to make a final decision on terms and to manage the standardised framework.
Data availability
No primary research results, software or code have been included as part of this review. The definition of taxonomy keywords and lexicon data referred to in this article have been included as part of the ESI.†Author contributions
Andy Connor and Rod Robinson designed the study. Andy Connor and Jacob Shaw wrote the manuscript, with contributions from Neil Howes, Nigel Yarrow, Jon Helmore, Andrew Finlayson, and Patrick Barker. All authors were involved in the construction and deliberation of the framework and provided edits to the manuscript.Conflicts of interest
The authors declare no competing interests.Acknowledgements
We would like to thank all participants in the UK Government's methane innovation committee (2019) for their contribution to the initial phases of this work. We would also like to thank Alex Adams (NPL) for contributions to the figures and graphical abstract. This work was funded by the UK Department for Science, Innovation and Technology as part of its National Measurement System programme.References
- European Commission, Launch by US, EU and Partners of the Global Methane Pledge, 2021, https://ec.europa.eu/commission/presscorner/detail/en/statement_21_5766, (accessed 21 August 2024) Search PubMed.
- E. G. Nisbet, R. E. Fisher, D. Lowry, J. L. France, G. Allen, S. Bakkaloglu, T. J. Broderick, M. Cain, M. Coleman, J. Fernandez, G. Forster, P. T. Griffiths, C. P. Iverach, B. F. J. Kelly, M. R. Manning, P. B. R. Nisbet-Jones, J. A. Pyle, A. Townsend-Small, A. al-Shalaan, N. Warwick and G. Zazzeri, Methane Mitigation: Methods to Reduce Emissions, on the Path to the Paris Agreement, Rev. Geophys., 2020, 58, e2019RG000675 CrossRef.
- J. Gao, C. Guan and B. Zhang, Why are methane emissions from China's oil & natural gas systems still unclear? A review of current bottom-up inventories, Sci. Total Environ., 2022, 807, 151076 CrossRef CAS PubMed.
- D. T. Allen, Methane emissions from natural gas production and use: reconciling bottom-up and top-down measurements, Curr. Opin. Chem. Eng., 2014, 5, 78–83 CrossRef.
- GTI Energy, Veritas: Protocols, 2023, https://veritas.gti.energy/protocols, (accessed 22 August 2024) Search PubMed.
- C. Bell, C. Ilonze, A. Duggan and D. Zimmerle, Performance of Continuous Emission Monitoring Solutions under a Single-Blind Controlled Testing Protocol, Environ. Sci. Technol., 2023, 57, 5794–5805 CrossRef CAS PubMed.
- Oil and Gas Methane Partnership 2.0, The Mineral Methane Initiative OGMP2.0 Framework, 2020, https://ogmpartnership.com/, (accessed 22 August 2024) Search PubMed.
- The Intergovernmental Panel on Climate Change, 2019 Refinement to the 2006 IPCC Guidelines for National Greenhouse Gas Inventories — IPCC, 2019, https://www.ipcc.ch/report/2019-refinement-to-the-2006-ipcc-guidelines-for-national-greenhouse-gas-inventories/, (accessed 18 September 2024) Search PubMed.
- The Methane Guiding Principles partnership, Methane Reduction Management Best Practice Guide - Identification, Detection, Measurement and Quantification, 2024, https://methaneguidingprinciples.org/resources/best-practices/, (accessed 18 September 2024) Search PubMed.
- Bureau International des Poids at Measures, International Vocabulary of Metrology – Basic and general concepts and associated terms (VIM), 3rd edn, 2012, https://www.bipm.org/doi/10.59161/JCGM200-2012, (accessed 22 August 2024) Search PubMed.
- J. Cooper, L. Dubey and A. Hawkes, Methane detection and quantification in the upstream oil and gas sector: the role of satellites in emissions detection, reconciling and reporting, Environ. Sci.: Atmos., 2022, 2, 9–23 CAS.
- B. M. Erland, A. K. Thorpe and J. A. Gamon, Recent Advances Toward Transparent Methane Emissions Monitoring: A Review, Environ. Sci. Technol., 2022, 56, 16567–16581 CrossRef CAS PubMed.
- T. A. Fox, A. P. Ravikumar, C. H. Hugenholtz, D. Zimmerle, T. E. Barchyn, M. R. Johnson, D. Lyon and T. Taylor, A methane emissions reduction equivalence framework for alternative leak detection and repair programs, Elem. Sci. Anth., 2019, 7, 30 CrossRef.
- T. A. Fox, T. E. Barchyn, D. Risk, A. P. Ravikumar and C. H. Hugenholtz, A review of close-range and screening technologies for mitigating fugitive methane emissions in upstream oil and gas, Environ. Res. Lett., 2019, 14, 053002 CrossRef CAS.
- N. V. S. Korlapati, F. Khan, Q. Noor, S. Mirza and S. Vaddiraju, Review and analysis of pipeline leak detection methods, J. Pipeline Sci. Eng., 2022, 2, 100074 CrossRef.
- K. E. Hachem and M. Kang, Reducing oil and gas well leakage: a review of leakage drivers, methane detection and repair options, Environ. Res.: Infrastruct. Sustainability, 2023, 3, 012002 Search PubMed.
- M. Sené, I. Gilmore and J.-T. Janssen, Metrology is key to reproducing results, Nature, 2017, 547, 397–399 CrossRef PubMed.
- Bureau International des Poids at Measures, The international system of units, 9th edn, 2019, https://www.bipm.org/en/publications/si-brochure, (accessed 22 August 2024) Search PubMed.
- National Physical Laboratory, GPG11 A beginner, 2013, https://www.npl.co.uk/gpgs/beginners-guide-measurement-uncertainty-gpg11, (accessed 16 September 2024) Search PubMed.
- Marcogaz, Assessment of methane emissions for Gas Transmission & Distribution System Operators, 2019, https://www.marcogaz.org/publications/assessment-of-methane-emissions-for-gas-transmission-distribution-system-operators/, (accessed 18 September 2024) Search PubMed.
- J. Kamieniak, E. P. Randviir and C. E. Banks, The latest developments in the analytical sensing of methane, TrAC, Trends Anal. Chem., 2015, 73, 146–157 CrossRef CAS.
- M. Kwaśny and A. Bombalska, Optical Methods of Methane Detection, Sensors, 2023, 23, 2834 CrossRef PubMed.
- J. T. Shaw, A. Shah, H. Yong and G. Allen, Methods for quantifying methane emissions using unmanned aerial vehicles: a review, Philos. Trans. R. Soc., A, 2021, 379, 20200450 CrossRef CAS PubMed.
- G. Allen, How to quantify anthropogenic methane emissions with aircraft surveys, Commun. Earth Environ., 2023, 4, 1–3 CrossRef.
- D. J. Jacob, A. J. Turner, J. D. Maasakkers, J. Sheng, K. Sun, X. Liu, K. Chance, I. Aben, J. McKeever and C. Frankenberg, Satellite observations of atmospheric methane and their value for quantifying methane emissions, Atmos. Chem. Phys., 2016, 16, 14371–14396 CrossRef CAS.
- D. J. Jacob, D. J. Varon, D. H. Cusworth, P. E. Dennison, C. Frankenberg, R. Gautam, L. Guanter, J. Kelley, J. McKeever, L. E. Ott, B. Poulter, Z. Qu, A. K. Thorpe, J. R. Worden and R. M. Duren, Quantifying methane emissions from the global scale down to point sources using satellite observations of atmospheric methane, Atmos. Chem. Phys., 2022, 22, 9617–9646 CrossRef CAS.
- Comité Européen de Normalisation, EN 15446, 2008, https://standards.iteh.ai/catalog/standards/cen/ca30d7f9-a531-46eb-9ce1-5786a5270bf1/en-15446-2008, (accessed 22 August 2024) Search PubMed.
- S. Jongaramrungruang, A. K. Thorpe, G. Matheou and C. Frankenberg, MethaNet – An AI-driven approach to quantifying methane point-source emission from high-resolution 2-D plume imagery, Remote Sens. Environ., 2022, 269, 112809 CrossRef.
- J. Wang, J. Ji, A. P. Ravikumar, S. Savarese and A. R. Brandt, VideoGasNet: Deep learning for natural gas methane leak classification using an infrared camera, Energy, 2022, 238, 121516 CrossRef CAS.
Footnote |
| † Electronic supplementary information (ESI) available. See DOI: https://doi.org/10.1039/d4ea00120f |
| This journal is © The Royal Society of Chemistry 2024 |

